This article appeared in a journal published by Elsevier. The attached copy is furnished to the author for internal non-commercial research and education use, including for instruction at the authors institution and sharing with colleagues. Other uses, including reproduction and distribution, or selling or licensing copies, or posting to personal, institutional or third party websites are prohibited. In most cases authors are permitted to post their version of the article (e.g. in Word or Tex form) to their personal website or institutional repository. Authors requiring further information regarding Elsevier’s archiving and manuscript policies are encouraged to visit: http://www.elsevier.com/copyright
Author's personal copy
Waste Management 29 (2009) 2085–2091
Contents lists available at ScienceDirect
Waste Management journal homepage: www.elsevier.com/locate/wasman
Building a better methane generation model: Validating models with methane recovery rates from 35 Canadian landfills Shirley Thompson a,*, Jennifer Sawyer b, Rathan Bonam a, J.E. Valdivia a a b
Natural Resources Institute, University of Manitoba, 70 Dysart Rd., Winnipeg, Manitoba, Canada R3T 2N2 Faculty of Environment, Earth and Resources, University of Manitoba, 440 Wallace Building, Winnipeg, Manitoba, Canada R3T 2N2
a r t i c l e
i n f o
Article history: Accepted 2 February 2009 Available online 27 March 2009
a b s t r a c t The German EPER, TNO, Belgium, LandGEM, and Scholl Canyon models for estimating methane production were compared to methane recovery rates for 35 Canadian landfills, assuming that 20% of emissions were not recovered. Two different fractions of degradable organic carbon (DOCf) were applied in all models. Most models performed better when the DOCf was 0.5 compared to 0.77. The Belgium, Scholl Canyon, and LandGEM version 2.01 models produced the best results of the existing models with respective mean absolute errors compared to methane generation rates (recovery rates + 20%) of 91%, 71%, and 89% at 0.50 DOCf and 171%, 115%, and 81% at 0.77 DOCf. The Scholl Canyon model typically overestimated methane recovery rates and the LandGEM version 2.01 model, which modifies the Scholl Canyon model by dividing waste by 10, consistently underestimated methane recovery rates; this comparison suggested that modifying the divisor for waste in the Scholl Canyon model between one and ten could improve its accuracy. At 0.50 DOCf and 0.77 DOCf the modified model had the lowest absolute mean error when divided by 1.5 yielding 63 ± 45% and 2.3 yielding 57 ± 47%, respectively. These modified models reduced error and variability substantially and both have a strong correlation of r = 0.92. ! 2009 Elsevier Ltd. All rights reserved.
1. Introduction Atmospheric methane concentrations have increased by 30% in the last 25 years (IPCC, 2007) and multiplied by a factor of 2–3 since the 1700s due to human activities. This methane addition has increased radiative forcing by 0.47 W m!2 (IPCC, 2007, 2006). Approximately 70% of methane emissions are anthropogenic (e.g., agriculture, natural gas activities, landfills, etc) and 19% (70 Tg/ year) of these are attributed to landfill gas generation (Lay et al., 1996; Czepiel et al., 2003). Landfill gas is typically 40–60% methane (Senior, 1990), with methane having 25 times the global warming potential of carbon dioxide (CO2) over a hundred year period (IPCC, 2007). Landfills are estimated to be the largest source of anthropogenic methane. In the 1990s, landfill emissions amounted to 37% of United States’ emissions, 48% of United Kingdom’s, and 31% of the European Union’s (Hilger and Humer, 2003). However, new regulations and programs have resulted in diverting organic waste from landfills in the EU and enhanced gas recovery in the US. Technologies and management programs to reduce methane production or recover methane from landfills are relatively inexpensive compared to similar carbon dioxide equivalent (eCO2) reductions (Reilly et al., 1999). Since methane is produced only during the anaerobic decay of organic matter, and not during aerobic decay, * Corresponding author. Tel.: +1 204 474 7170; fax: +1 204 261 0038. E-mail address:
[email protected] (S. Thompson). 0956-053X/$ - see front matter ! 2009 Elsevier Ltd. All rights reserved. doi:10.1016/j.wasman.2009.02.004
the diversion of organic waste from landfills to composting reduces methane production (Thompson and Tanapat, 2005). Also, landfill gas can be collected to heat nearby industrial or agricultural operations or to produce electricity, which can be sold to the power grid. Landfill gas utilization provides a source of revenue, replaces fossil fuel use, and reduces greenhouse gas emissions (Thompson and Tanapat, 2005). However, most provinces in Canada, as well as many other countries in the world have not begun to consider regulations that either ban organics from landfills or require landfill gas recovery. Landfill gas comprises about 3% of Canada’s greenhouse gas (GHG) emissions, or 0.83 tonnes eCO2 per capita (Environment Canada, 2006a,b). From 1990 to 2006, GHG releases from the waste sector increased by about 2.8 Mt, or 15.2% due to increasing amounts of waste being generated and sent to landfills (Environment Canada, 2008). This GHG increase would have been larger had landfill gas recovery projects and waste diversion programs (composting and recycling) not been implemented in Canada (Environment Canada, 2009). Fifty-two landfills in Canada either recovered methane to produce electric power or heat or alternatively flared the landfill gas to reduce methane to CO2 (Thompson et al., 2006, 2007b, 2008). For example, the 25 MW electricity generating plant at the Centre de Tri et d’Élimination des Déchets powered 8200 single detached houses at an initial cost of CAD $37 million with a payback period of only 5 years (EDIE, 2008). Recently the Ontario government required new and existing landfills to install a system to capture methane if the landfill releases more than 1.5 million cubic
Author's personal copy
2086
S. Thompson et al. / Waste Management 29 (2009) 2085–2091
metres annually in order to reduce GHG emissions provincially by over 4 million tonnes annually (EDIE, 2008). Other provinces have reduced organics going to landfills. Two small provinces, Prince Edward Island (PEI) and Nova Scotia (NS), have banned organics in all landfills to increase waste diversion of organics to composting facilities. In NS, 70% of people have curb-side collection of source separated organics (Thompson et al., 2008). Countries in the developing world have methane rates that are generally lower than in developed countries due to lower per capita waste generation and open waste pits. As sanitation imperatives are changing waste disposal practices from open waste pits to landfills, anaerobic decay will result in greater methane production (Hilger and Humer, 2003), unless waste diversion and/or methane recovery programs and regulations are implemented. To evaluate appropriate methane reduction strategies, landfill gas production rates must be accurately quantified. The design and operation of landfill gas extraction and utilization projects require reliable emission forecasts for project feasibility and to ensure environmental compliance (Huitric and Soni, 1997; Oonk and Boom, 1995). Municipalities and companies are reluctant to invest in methane recovery projects due to the high uncertainty in estimating gas production rates and total gas yield, which are needed to accurately determine payback periods for the capital and operational costs of any project. Some methane recovery projects have yielded only 10% of that estimated by methane generation models (Goldstein, 2007). Landfill gas models continue to receive criticism due to their poor accuracy and insufficient validation: most model results have not been evaluated against methane recovery data (Barlaz et al., 2004; Borjesson et al., 2000; Bogner and Matthews, 2003; Mosher et al., 1999). A few studies (Spokas et al., 2006; Barlaz et al., 2004; Bogner and Matthews, 2003; SCS Engineers, 1997) have compared methane recovery data to estimates of methane generation from models, but only for a few landfills. This limited approach is inadequate to validate the model for a wide, rather than site-specific, application. Despite the Intergovernmental Panel on Climate Change’s (IPCC, 2006, 1996) attempt to establish a suitable universal method, countries still use different methods for collecting and reporting their methane production due to lack of validation of models and no model being accurate over a range of conditions. A validated model is needed to facilitate a standardized methodology. This paper profiles the different models and the current understanding of their inputs before evaluating the accuracy of six models’ estimates against methane recovery rates.
2. Methane generation models Landfill gas models describe in simple terms the complex changes occurring during landfill decomposition to estimate methane generation over time. See Table 1 for formulas for all the models evaluated including one zero order model, four existing first order models and one modified first order model. The zero order model, EPER model, generates the rate of methane production independent of the amount of substrate remaining or of the amount of biogases already produced (Scharff, 2005; Scharff and Jacobs, 2006). The German EPER model roughly approximates methane generation from operational landfills but not closed landfills. Although complete anaerobic decay of organic waste in landfills requires many years EPER only considers the last year’s waste input to estimate methane generation (Scharff, 2005; Scharff and Jacobs, 2006; SCS Engineers, 1997). Methane generation at landfills is generally modeled using a first order kinetic equation (Blaha et al., 1991; Bogner and Matthews, 2003; Thompson et al., 2006, 2008) based on waste amounts over time, waste composition, and other factors. In first
Table 1 The formulas for five existing and one modified landfill gas generation models. Model formula
Symbol index
German EPER model
Q = (M)(DOC)(DOCf)(F)(D)
TNO model
Q = (DOCf)(1.87)(M)(DOC)(k)e!(kt)
Belgium model
Q = (M)(DOC)(k)(DOCf) exp!(kt)
Scholl Canyon
Q = (M)(k)(Lo) exp!(kt)
LandGEM version 2.01
Q¼
Q = methane production (kt/ yr) M = waste generation (Mt/yr) DOC = degradable organic carbon (kg/tonne) DOCf = fraction assimilated DOC F = fraction of methane in landfill gas D = collection efficiency factor Q = methane production (kt/ yr) DOCf = fraction of assimilated DOC M = waste generation (Mt/yr) DOC = degradable organic carbon (kg/tonne) k = decay rate (yr!1) t = time of waste disposal (yr) Q = methane production (kt/ yr) M = waste generation (Mt/yr) DOC = degradable organic carbon (kg/tonne) k = decay rate (yr!1) DOCf = fraction Assimilated DOC t = time of waste disposal (yr) Q = methane production (kt/ yr) M = waste generation (Mt/yr) k = decay rate (yr!1) Lo = methane generation potential (kg/tonne) t = time of waste disposal (yr) Q = methane production (kt/ yr)
Modified model
Q¼
!M" 10
!M" 10
ðkÞðLoÞexp!ðktÞ
ðkÞðLoÞexp!ðktÞ
M = waste generation (Mt/yr) k = decay rate (yr!1) Lo = methane generation potential (kg/tonne) t = Time of waste disposal (yr) Q = Methane production (kt/ yr) M = Waste generation (Mt/yr) k = Decay rate (yr!1) L0 = Methane generation potential (kg/tonne) x = divisor of waste between 1 and 10 t = time of waste disposal (yr)
order models, methane production is assumed to be in a steady, linear decrease over time proportional to the degradation of organic matter in any given year and the remaining fraction of organic matter from previous years (Borjesson et al., 2000). Each year’s waste follows a decreasing exponential trend in gas production until it is completely degraded (Huitric and Soni, 1997). Thus, according to these model assumptions, a gradual decline in landfill gas would occur post-closure. First order models, including TNO, Belgium, and LandGEM, are currently used by Denmark, the Netherlands, and the United States, respectively (Thompson et al., 2006, 2008). Environment Canada (2006a,b) and the IPCC (1996) advocate using the Scholl Canyon model for calculating methane production. Although these four first order models have the same basic components with slight differences, their outputs vary considerably.
Author's personal copy
S. Thompson et al. / Waste Management 29 (2009) 2085–2091
In reviewing the model formulas in Table 1 some models have only slight differences. For example, the LandGEM model version (v.) 2.01 uses the same calculations as the Scholl Canyon model but divides the waste by ten (Alexander et al., 2005). The equation used in LandGEM v. 2.01 integrates methane generation over each year, similar to Scholl Canyon. However, the revised equation in LandGEM v. 3.02 integrates methane generation over a 0.1 year time increment, producing slightly lower emission estimates than previous versions for typical k values (Alexander et al., 2005). A modified model is created that divides the waste in the Scholl Canyon model by numbers between one and ten to explore if it is possible to build a better methane generation model. To determine the accuracy of the models, estimates by the models must be compared to the methane recovery rate at specific landfills, while taking into consideration a factor to account for storage and losses. Total methane generated in landfills is a sum of many activities (Eq. (1)), including the methane recovered, emitted into the atmosphere, oxidized by methanotrophs, that has laterally migrated, and that has been internally stored in the landfill volume (Bogner and Spokas, 1993).
CH4 generation rate ¼ CH4 emitted þ CH4 oxidized
þ CH4 recoveredðflaredÞ þ CH4 migrated !1
þ CH4 storage½all units ¼ mass-time '
ð1Þ
2.1. Considering gas recovery efficiencies in the models Modeled results need to be compared to methane recovery rates, taking into consideration gas recovery efficiency, to ensure accuracy (Spokas et al., 2006). Gas recovery efficiencies are typically estimated to be in the range of 60–90%, based on measured gas extraction rates divided by modeled gas generation rates (Alexander et al., 2005; Visse, 2004). As a result of the mass balance work done by Spokas et al. (2006), the French environment agency adopted the default percent recovery values of 35% for an operating cell with an active landfill gas (LFG) recovery system, 65% for a temporary covered cell with an active LFG recovery system, 85% for a cell with clay final cover and active LFG recovery, and 90% for a cell with a geomembrane final cover and active LFG recovery. The US EPA (2004) applies a default gas recovery rate of 75%. 2.2. Model Inputs All landfill gas models calculate methane yield based on three key inputs. The three necessary inputs are: (1) waste amounts deposited in landfill over all the years that the landfill has been opened (except EPER model inputs waste only for the one year of interest), (2) degradable organic content (DOC), and (3) decay rate (k). In addition to those inputs, LandGEM and Scholl Canyon have a methane generation potential (Lo) that is the percentage of methane in the landfill gas multiplied by DOC and other factors. 2.2.1. Degradable organic content (DOC) The DOC of the waste is required in all landfill gas generation models as it represents the waste portion available for microbial degradation into landfill gas (Kim, 2003). The organic fraction of each type of organic waste is considered as all have different decay rates. Celluloses and hemicelluloses, found in food and yard waste, are readily biodegradable under anaerobic conditions, while lignin, found in wood and newspaper, is not (Kim, 2003). Few landfill waste composition studies have been undertaken to quantify DOC accurately (IPCC, 2006). In developed countries, the largest portion of municipal solid waste is biodegradable accounting for
2087
60–75% wet weight (w/w) of the total landfilled with a DOC of approximately 15–25% kg/tonne of waste (Bingemer and Crutzen, 1987). This DOC, all reported in w/w, contains cellulose (40– 50%), lignin (10–15%), hemicellulose (12%), and protein (4%), according to Preen and Murphy (2001). Thompson et al. (2007a) study of 17 Canadian landfills’ waste audits differ slightly with 62% of MSW being biodegradable but with a higher proportion of lignin waste (29%) and a lesser proportion of hemicellulose and cellulose (12% garden and non-food waste and 21% food waste). As waste composition in landfills fluctuate widely based on recycling and organic waste diversion programs (e.g., availability of organic curb-side collection, pay per bag), the regulatory environment (e.g., ban on organics in landfills), and social/economic factors, it is ideal to apply site-specific DOC based on the landfill’s waste composition study. If a site-specific DOC is not available, a waste composition from the same regional or provincial jurisdiction is preferred as they typically have more similar social/economic and, regulatory factors, although programming usually differs by municipality. In our model estimates, a provincial DOC and both IPCC (1996, 2006) default values for the fraction of degradable organic carbon assimilated (DOCf). IPCC (1996) guidelines recommended 0.77 DOCf with an error value of ±10% but the IPCC (2006) amended this value to a default of 0.50, assigning an error of ±20%. The methane generation potential (Lo) represents the amount of methane produced per tonne of waste landfilled. The Lo, shown in Eq. (3), multiplies DOC and DOCf, to the fraction of methane in the landfill gas and other factors. The IPCC (1996) recommended a methane generation potential (Lo) between 100–200 kg of methane/tonne of waste. As recycling and composting programs in the 1990s reduced organics going to landfills, Environment Canada (2006a,b) applied a higher Lo before 1990 at 165 kg of methane/ tonne of waste and after 1990 at 117 kg/tonne. However, provincial waste diversion programs differ, thereby making nation-wide constants unsuitable. 2.2.2. Decay rates The decay rate (k) is the biodegradation half-life in years!1 for organic material in a landfill. The IPCC (2006) recognizes the high uncertainty and error associated with k. The decay rates range from one to 50 years and even longer in landfills located in dry, cold climates. Decay rates have been determined by a number of methods: laboratory simulations (Harries et al., 2001), samples excavated from landfills (Gardner et al., 2003; Rodriguez et al, 2001; Baldwin et al., 1998), and test cells designed to simulate real world conditions (Mehta et al., 2002). Although many different environment conditions act upon decay, typically only precipitation is considered to have an effect on k (US EPA, 2004; Maurice and Lagerkvist, 1997; Lay et al., 1996). Moisture is essential for bacterial growth, metabolism, and nutrient transport. The US EPA (2004) offers a binary choice for default decay rates of either 0.02 year!1 below 25 inches (635 mm) of precipitation or 0.04 year!1 above 25 inches. Thompson et al. (2006) and Environment Canada (2006a,b) define a linear relationship between decay and annual precipitation to scale k with location-specific moisture levels based on the US EPA (2004) defaults. A linear relationship between moisture and decay rate has been observed in other field and laboratory studies (McDougall and Pyrah, 1999; Chian and DeWalle, 1979).
3. Method The methane generation estimates from five existing models and a modified Scholl Canyon model were compared to methane recovery rates for 35 landfills, adding a 20% loss factor,
Author's personal copy
2088
S. Thompson et al. / Waste Management 29 (2009) 2085–2091
to determine the accuracy of the models. To undertake this analysis the following steps were undertaken: 1. Conducted a national survey that captured 52 of the 52 Canadian landfills recovering methane (100% return rate), obtaining necessary model inputs, and methane recovery rates for landfills in 2005 (Thompson et al., 2007b). All 52 landfills had recovery data; however, due to insufficient waste data and outliers, only 35 landfills were considered to calibrate the landfill gas models. The 35 landfills operated in five provinces, namely, Alberta, British Columbia, Ontario, Nova Scotia, and Quebec. 2. Estimated methane generation for 35 landfills for six models using the equations listed in Table 1. The German EPER, Belgium, TNO, Scholl Canyon, LandGEM, and a modified Scholl Canyon model (dividing the waste by numbers between one and ten) were all run in Excel 2002 with the following three factors: (i) Waste amounts. The site-specific yearly waste quantity from the opening of the landfill to year 2005 were applied to all models except the EPER model, which only considered the 2005 waste amount (Sawyer and Thompson, 2007). (ii) Degradable organic carbon (DOC) and Methane Generation Potential. Waste composition data shown in Table 2 were plugged into Eq. (2).
DOC ¼ ð0:4 ( AÞ þ ð0:17 ( BÞ þ ð0:15 ( CÞ
þ ð0:30 ( DÞ½all units wet weightðw=wÞof kg carbon=kg waste'
ð2Þ
where DOC = degradable organic carbon A = fraction of municipal solid waste (MSW) that is paper and textiles waste B = fraction of MSW that is garden or park waste C = fraction of MSW that is food waste D = fraction of MSW that is wood or straw waste. The current audit composition was modified for the pre-recycling and composting period, as presented in Table 2 by subtracting the organic waste diverted from the DOC available in Statistics Canada (2002, 2004). In the Scholl Canyon, LandGEM, and modified models, the DOC is entered into Eq. (3) to yield the methane generation potential (Lo):
Lo ¼ F ( DOC ( DOCf ( 16=12 ( MCF
ð3Þ
where Lo = Methane generation potential (kg/tonne) MCF = Methane correction factor (fraction; default = 1.0) DOC = Degradable organic carbon (kg/tonne) DOCf = Fraction of assimilated DOC (IPCC, 1996 default = 0.77; IPCC, 2006 default = 0.50); F = Fraction of methane in landfill gas (0.5 default) 16/12 = Stoichiometric factor.
Table 3 Decay rates derived from precipitation for each province. Province
Mean precipitation (mm)*
Decay rate (year !1)
Half-life (year)
British Columbia Alberta Ontario Quebec Nova Scotia
1281 445 902 1070 1452
0.048 0.023 0.037 0.042 0.056
20.8 43.5 27.0 23.9 17.9
*
Environment Canada (2006b).
(iii) Decay rates are determined based on precipitation rates in Table 3 by the following equation based on US EPA (2004) defaults of k
k ¼ 3:2 ( 10!5 ðxÞ þ 0:01
ð4Þ
where: k = decay rate (year ); and x = annual average precipitation from 1971 to 2006 for province where the landfill is (Environment Canada Weather Office, 2006). 3. Added 20% to the methane recovery rates to get ‘‘methane generation rates” as the midpoint of 80% between the US EPA (2004) default of 75% and the Spokas et al. (2006) default of 85% for clay final covers. 4. Compared the methane generation rate to the estimates for the 35 landfills for each of the five established models and the modified Scholl Canyon model. The absolute mean and median percent error and Pearson correlation were calculated. The absolute percent error measures the percent difference between the observed and modeled values. The Pearson correlation (r) measures the direction and strength of the linear relationship between two quantitative variables (Sweet and Grace-Martin, 2003). !1
4. Results and discussion Table 4 compares methane generation estimates of six models compared to recovery rates considering a loss factor, for 35 landfills for both a DOCf of 0.50 and 0.77. No model perfectly matches the methane recovery data but some models fare better than others. The LandGEM model consistently underestimated methane generation, but all other models typically overestimated methane generation. Using the smaller fraction for DOCf of 0.5, rather than 0.77, reduces the estimate for methane generation error by almost half for the EPER (from 589% to 332%) and for the TNO model (from 376% to 201%). The German EPER and TNO models consistently pro-
Table 2 Degradable organic content and methane generation potential (Lo) values derived. Province
Ontarioa
Paper and textiles (% w/w) Garden and Park waste Food Waste Wood and Straw waste (w/w) DOC (% w/w) DOC post-recycling (kg/tonne) DOC (pre-recycling, kg/tonne) Lo (post-recycling, kg/tonne) Lo (pre-recycling, kg/tone)
Nova Scotiab
Quebecc
Albertad
British Columbiad
27.0 13.0 25.0 2.9
27.7 15.4 25.3 NA
59.0 NA 2.7 2.9
35.0 11.0 12.0 6.0
40.6 17.5 11.7 0.3
17.6 176 205 90 105
17.5 175 227 90 105
24.9 249 283 128 145
19.5 195 228 100 117
21.2 212 261 109 134
NA – Unavailable categorical information. a Ontario Ministry of the Environment (2004). b Government of Nova Scotia (2003). c Government of Quebec (2002). d Thompson et al. (2007a).
Author's personal copy
2089
S. Thompson et al. / Waste Management 29 (2009) 2085–2091 Table 4 Model results for the 35 landfills compared to methane recovery rates with loss factor. Model type Prexisting models German EPER model with DOCf = 0.5 with DOCf = 0.77 TNO model with DOCf = 0.5 with DOCf = 0.77 Belgium model with DOCf = 0.5 with DOCf = 0.77 Scholl Canyon model with DOCf = 0.5 with DOCf = 0.77 LandGEM model with DOCf = 0.5 with DOCf = 0.77 Modified Scholl Canyon model Dividing waste by 1.5-with DOCf = 0.5 Dividing waste by 2.3-with DOCf = 0.77
Mean absolute error and standard error (%)
Error median
Correlation (r)
Mean relative error (%)
332 ± 396 589 ± 666
238 371
0.8589 0.8589
312 578
201 ± 207 376 ± 356
153 322
0.88 0.8785
131 289
91 ± 92 171 ± 177
30 125
0.8674 0.8674
22 111
71 ± 86 115 ± 152
!28 43
0.9210 0.9164
13 91
89 ± 11 81 ± 17
!93 !86
0.9210 0.9164
!89 !81
63 ± 45 57 ± 48
!52 !38
0.9210 0.9164
!25 !17
duced much higher estimates than the methane generation rates with very large standard errors. The German EPER model provided the largest average error of 332 ± 396% at 0.5 DOCf and 589 ± 666% at 0.77 DOCf, but with a strong correlation at r = 0.86. This poor accuracy is not surprising as the model considers only methane generation from the 2005 year’s waste. However, the first order TNO Model was not much better – it produced a mean error of 201 ± 207% at 0.5 DOCf and 376 ± 356% at 0.77 DOCf, with a correlation of r = 0.88. The overestimation by the TNO model was consistent with the findings of Oonk and Boom (1995) and Scharff (2005). Other models estimated rates closer to the actual methane generation rates. The Belgium model fared better at 0.5 DOCf than at 0.77 DOCf, with an average absolute error of 91 ± 92% and 171 ± 177% with a correlation of r = 0.87 for both. The model estimates by the LandGEM and Scholl Canyon models were closest to the actual methane generation rates than the other existing models. The Scholl Canyon model’s mean absolute error was 71 ± 86% at DOCf = 0.50 and 115 ± 152% at DOCf = 0.77 with a very strong correlation of r = 0.92. At DOCf = 0.50 most methane generation estimates were underestimated by Scholl Canyon, resulting in a median of !28%, but at DOCf = 0.77 were overestimated with a median of 43. The LandGEM model was the only model that consistently produced estimates lower than the recovery rate, with the absolute mean percent error of 89 ± 11% at 0.5 DOCf and 81 ± 17% at 0.77 DOCf. That the LandGEM’s estimates are so much smaller than the generation rates (relative absolute error of !89 ± 11% at 0.5 DOCf and !81 ± 17% at 0.77 DOCf) results in the small standard error.
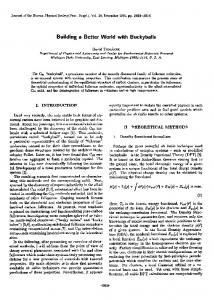
Fig. 2. Error rates when different divisors are applied to waste amounts in a Modified Scholl Canyon Model (DOCf = 0.77).
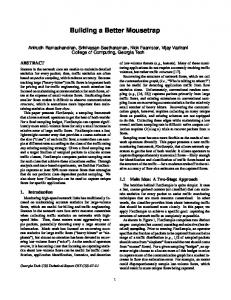
As the only difference between the LandGEM (v. 2.01) model and the Scholl Canyon model is a divisor for waste of ten, the waste divisor was varied between one (Scholl Canyon) and ten (LandGEM) to create a modified model. At DOCf = 0.5 the modified model’s mean absolute error is lowest at 63 ± 45%, which occurs when waste is divided by 1.5. See Fig. 1 to show that a divisor of 1.5 has the lowest mean absolute error but not the smallest standard error. At DOCf = 0.77 the modified model’s lowest mean absolute percent error was at 57 ± 47%, having a correlation of 0.92. See Fig. 2 to show that 2.3 has the lowest mean absolute error but not the smallest standard error. At both DOCf defaults the modified model had a strong correlation at 0.92. 5. Conclusion
Fig. 1. Error rates when different divisors are applied to waste in a Modified Scholl Canyon Model (DOCf = 0.50).
This study is the first to compare modeled methane generation to methane generation recovery rates for a statistical sample of landfills. Clearly, this type of model validation is needed to develop a more accurate model so that estimated yield can effectively determine the viability of landfill projects, the sizing of equipment (e.g., generators, boilers, etc.), and the need for organic waste diversion. Existing models are all strongly correlated with the methane generation rate; however, not all the models are accurate. In particular, the German EPER and TNO models were wildly inaccurate in modeling the actual methane generation rates in Canada. The Belgium, Scholl Canyon, and LandGEM v. 2.01 models produced the best results of the existing models: their respective mean absolute percent errors with methane generation rates were
Author's personal copy
2090
S. Thompson et al. / Waste Management 29 (2009) 2085–2091
out by 91%, 71%, and 89% at DOCf = 0.50 and 171%, 115% and 81% at DOCf = 0.77. The Scholl Canyon and Belgium median error of !27% and 30%, respectively, shows that a number of high overestimates pulled the mean of these models up and that these models may provide more accurate estimates in a normal distribution. Most models had better accuracy with 0.5 DOCf, which is the default recommended by IPCC (2006). The Scholl Canyon model errors were on average too high (particularly at 0.77 DOCf) and the LandGEM estimates were consistently too low; this suggested that a Scholl Canyon model with a waste divisor between one and ten would yield more accurate results. At 0.50 DOCf and 0.77 DOCf the modified model had the lowest absolute mean error of 63 ± 45% when divided by 1.5 and 57 ± 47% when divided by 2.3, respectively. These modified models reduced error and variability substantially and both had a strong correlation of r = 0.92. This decrease in absolute error of the modified model from Scholl Canyon is 8 ± 41% for 0.5 DOCf and 58 ± 104% for 0.77 DOCf. This improved model may allow more municipalities to adopt methane recovery and consider the importance of implementing organic diversion by yielding credible data. These modified models are the best option available for first order models at present. As LandGEM, v. 3.01 produces lower estimates than LandGEM 2.01, LandGEM v. 3.01would not have produced more accurate results. Ideally a model would be within 10–25% of the recovery data, with limited variability across different landfill conditions. However, considering that defaults or provincial rates were applied for landfill gas concentration, decay rates and DOC, rather than site-specific data, the results for Belgium, Scholl Canyon, LandGEM, and the modified models are fairly good. Applying provincial rates or other defaults add additional errors that site-specific inputs and measured decay rates and DOC would not. While this analysis presumes that existing models consider all the important factors in determining methane generation, other factors could be impacting methane generation, including depth of landfills, temperature, and waste density (Thompson et al., 2007a). As well as the model itself, inputs to the model require more research to reduce error in model estimates. This paper clearly shows the difference that inputs make. Applying the IPCC change from DOCf of 0.77 (IPCC, 1996) to 0.5 (IPCC, 2006) had a huge impact on the accuracy of estimates, decreasing error by halve for a number of models. Decay rates hold much uncertainty and need further research work. As well, most landfills have not conducted a waste composition study required to calculate sitespecific DOC. Waste composition fluctuates widely within Canada, making it inaccurate to assign national DOC values. The provincial values assigned are slightly better but do not account for differences in municipal programming. In the future, this input may become better documented when municipalities examine the impact of diversion initiatives by doing waste audits. To reduce the impact of landfills on GHG, composting and/or methane recovery is required. Few provinces or municipalities in Canada ban organic materials in landfills or provide curb-side collection of organics to divert from landfills to composting facilities. As well, recycling rates have to improve to reduce methane generation. That a higher lignin value was found for the recent Canadian waste composition audit (Thompson et al., 2006) compared to other studies suggests Canada needs to both adopt wood waste diversion programs and have targets for municipalities to reach high recycling rate targets for paper. References Alexander, A., Burklin, C., Singleton, A., 2005. Landfill Gas Emissions Model (LandGEM) Version 3.02 User’s Guide. US EPA, Washington. (retrieved 28.10.08.).
Baldwin, T.D., Stinson, J., Ham, R., 1998. Decomposition of specific materials buried within sanitary landfills. Journal of Environmental Engineering 124 (12), 1193– 1202. Barlaz, M.A., Green, G., Chanton, J.P., Goldsmith, C.D., Hater, G.R., 2004. Evaluation of a biologically active cover for mitigation of landfill gas emissions. Environmental Science and Technology 38, 4891–4899. Bingemer, H.G., Crutzen, P.J., 1987. The production of methane from solid wastes. Journal of Geophysical Research (D2) 92, 2181–2187. Blaha, D., Bartlett, K., Czepiel, P., Harris, R., Crill, P., 1991. Natural and anthropogenic methane sources in New England. Atmospheric Environment 33, 243–255. Bogner, J., Matthews, E., 2003. Global methane emissions from landfills: new methodology and annual estimates 1980–1996. Global Biogeochemical Cycles 17 (2), 34-1–34-18. Bogner, J., Spokas, K., 1993. Landfill CH4: rates, fates, and role in global carbon cycle. Chemosphere 31, 369–386. Borjesson, G., Samuelsson, B., Galle, J., Svensson, B.H., 2000. Methane emissions from landfills: options for measurement and control. Stratford-upon-Avon. Chian, E.S.K., DeWalle, F.B., 1979. Effects of moisture regimes and temperature on MWS stabilization. In: Proceedings from the 5th Research Symposium on Municipal Solid Waste. US EPA, Florida. Czepiel, P.M., Shorter, J.H., Mosher, B., Allwine, E., McManus, J.B., Harriss, R.C., Kolb, C.E., Lamb, B.K., 2003. The influence of atmospheric pressure on landfill methane emissions. Waste Management 23, 593–598. Edie (Environmental Data Interactive Exchange), 2008. Landfill Gas Becomes Mandatory in Ontario. (retrieved 08.07.08). Environment Canada, 2006a. National Inventory Report 1990–2004, Greenhouse Gas Sources and Sinks in Canada. (retrieved January, 08). Environment Canada Weather Office Environment Canada 2006b. Canadian Climate Normals or Averages 1971–2000. (retrieved 07.07.08). Environment Canada, 2009. Canada’s 2006 Greenhouse Gas Inventory. (retrieved 05.01.09). Gardner, W., Ximenese, F., Cowie, C., Marchant, J., Mann, S., Dods, K., 2003. Journal of Environmental Engineering ASCE 128 (30), 228–236. Goldstein, R., 2007. Personal Communication. EPA Landfill Methane Outreach Program. United States EPA, Washington, DC. Government of Nova Scotia, 2003. Assessing Environmental Improvements Resulting from Changes in Waste Management Practices in Nova Scotia from 1989–2001. (retrieved October, 05). Government of Quebec, 2002. Québec Action Plan for Waste Management, 1998–2008: Fact Sheet. (retrieved 25.10.05). Harries, C., Cross, C., Smith, R., 2001. Application of biochemical methane potential testing to the study of MSW decomposition in a municipal solid waste lysimeter. In: Proceedings Sardinia 2001, 8th International Waste Management and Landfill Symposium, October 1–5, vol. 1. CISA, Environmental Sanitary Engineering Centre, Italy, pp. 588–598. Hilger, H., Humer, M., 2003. Biotic landfills cover treatments for mitigating methane emissions. Environmental Monitoring and Assessment 84, 71–84. Huitric, R., Soni, R., 1997. Making the most of LFG projection models. In: Proceedings from SWANA’s 20th Annual LFG Symposium, Monterey California, USA. Intergovernmental Panel on Climate Change (IPCC), 1996. Good Practice Guidance and Uncertainty Management in National Greenhouse Gas Inventories. (retrieved 24.09.05). Intergovernmental Panel on Climate Change (IPCC), 2006. IPCC Guidelines for National Greenhouse Gas Inventories, vol. 5 (Chapters 2 and 3). (retrieved 20.08.08). Intergovernmental Panel on Climate Change (IPCC), 2007. Climate Change 2007 – The Physical Science Basis. Contribution of Working Group I to the Fourth Assessment Report of the IPCC. New York, Cambridge. (retrieved 07.10.08). Kim, M. 2003. The Study of Landfill Microbial Communities using Landfill Gas and Landfill Gas Condensate. Doctor of Philosophy, Drexel University. Lay, J., Li, Y., Noike, T., 1996. Effect of moisture content and chemical nature on methane fermentation characteristics of municipal solid wastes. Journal of Environmental Systems and Engineering 1, 101–108. Maurice, C., Lagerkvist, A., 1997. Seasonal variation of landfill gas emissions. In: Proceedings from Sardinia’95, Fifth International Landfill Symposium. CISA, S. Margherita di Paula, Calgiari, Italy, 2–6 October 1995. McDougall, J.R., Pyrah, I.C., 1999. Moisture effects in a biodegradation model for waste refuse. In: As presented at the 1999 Sardinia Conference in Italy. Civic Engineering, Napier University. Mehta, R., Barlaz, M., Yazdani, R., Augenstein, R., Bryars, M., Sinderson, L., 2002. Refuse decomposition in the presence and absence of leachate recirculation. Journal of Environmental Engineering 128 (3), 228–236. Mosher, B.W., Czepiel, P.M., Harriss, R.C., Shorter, J.H., Kolb, C.E., McManus, J.B., Allwine, E., Lamb, B.K., 1999. Methane emissions at nine landfill sites in the northeastern United States. Environmental Science and Technology 33 (12), 2088–2094.
Author's personal copy
S. Thompson et al. / Waste Management 29 (2009) 2085–2091 Ontario Ministry of the Environment, 2004. Ontario’s 60% Waste Diversion Goal – A Discussion Paper. Report: PIBS 4651e. Oonk, H., Boom, T., 1995. Landfill gas emission measurements using a mass-balance method. NOVEM Programme Energy Generation from Waste and Biomass (EWAB), TNO Report R95-203, Apeldoorn, Netherlands. Preen, P.J., Murphy, R.J., 2001. Evaluation of alternatives for extending the life of landfills. Environmental Engineering Policy (June), 213–223. Reilly, I., Prinn, R.G., Uarnisch, J., Fitzmaurice, J., Jacoby, H.D., Kickligher, D., Stone, P.H., Sokolov, A.P., Want, C., 1999. Multi-Gas Assessment of the Kyoto Protocol’. Report No.45, MIT Joint Program on the Science and Policy of Global Change, Boston, MA, January. Rodriguez, C., Hiligsmann, M., Lardinois, M., Destain, J., Radu, J.P., Charlier, R., Thonart, P., 2001. Cellulose enzymatic availability in solid waste. In: Eighth International Waste Management and Landfill Symposium, Sardinia. Sawyer, J., Thompson, S., 2007. Canadian Methane Emissions Model User Manual. Prepared by University of Manitoba for Environment Canada. Scharff, H., 2005. Landfill Gas Production and Emission on Former Landfills. Interreg IIIC, European Union. Scharff, H., Jacobs, J., 2006. Applying guidance for methane emission estimation for landfills. Waste Management 26 (4), 417–429. SCS Engineers, 1997. Comparative Analysis of Landfill Gas Utilization Technologies. Northeast Regional Biomass Program, Washington, DC. Senior, E., 1990. Microbiology of Landfill Sites. CRC Press, Inc., Boca Raton, FL. Spokas, K., Bogner, J., Chanton, J.P., Morcet, M., Aran, C., Graff, C., Moreau-Le Goluan, Y., Hebe, I., 2006. Methane mass balance at three landfill sites: what is the efficiency of capture by gas collection systems? Waste Management 26 (5), 516–525.
2091
Statistics Canada, 2002, 2004. Waste Management Industry Survey, Business and Government Sectors. Catalogue No. 16F0023XIE, Statistics Canada, Ottawa. Sweet, S.A., Grace-Martin, K., 2003, second ed. Data Analysis with SPSS: A first Course in Applied Statistics Pearson Education, Inc., Boston. Thompson, S., Tanapat, S., 2005. Waste management options for greenhouse gas reduction. Journal of Environmental Informatics 6 (1), 16–24. Thompson, S., Sawyer, J., Bonam, R., Smith, S., 2006. Recommendations for Improving the Canadian Methane Generation Model for Landfills. Report prepared for Environment Canada on Contract. University of Manitoba, Winnipeg, Environment Canada. Thompson, S., Nicol, S., Bonam, R., 2007a. Policies leading to zero waste: extended producer responsibility, bans on organics in landfills, and other proactive waste reduction policies and programs. Presentation to Pollution Prevention Workshop in Winnipeg, June 2007. Thompson, S., Sawyer, J., Bonam, R., Smith, S., 2007b. Methane Generation in Canada in 2005: Results of the National Landfill Survey. Report prepared for Environment Canada on contract. University of Manitoba, Winnipeg, Environment Canada. Thompson, Shirley, Sawyer, J., Bonam, R., Smith, S., 2008. Modeling landfill gas generation to determine targets and strategies to reduce greenhouse gases. The Journal of Solid Waste Technology and Management 34 (1). United States Environmental Protection Agency (US EPA), 2004. Quantification of Exposure: Development of the Emissions Inventory for the Inhalation Risk Assessment (Chapter 7). (retrieved 01.06.08). Visse, D. 2004. Food Waste Diversion Greenhouse Gas Analysis: Portland, Oregon. City of Portland, Office of Sustainable Development and Recycling Division.


![[PDF] Building Better Models with JMP Pro Free ... - Google Sites](https://m.moam.info/img/260x300/pdf-building-better-models-with-jmp-pro-free-googl_6477b333097c474e708bfe94.jpg)
![[PDF] Building Better Models with JMP Pro Audiobooks - Google Sites](https://m.moam.info/img/260x300/pdf-building-better-models-with-jmp-pro-audiobooks_6476f87b097c474b228b5797.jpg)