remote sensing Article
Building Earthquake Damage Information Extraction from a Single Post-Earthquake PolSAR Image Wei Zhai 1,2,3,4 , Huanfeng Shen 5 , Chunlin Huang 2,4, * and Wansheng Pei 6 1 2 3 4 5 6
*
Gansu Earthquake Administration, Lanzhou 730000, China;
[email protected] Key Laboratory of Remote Sensing of Gansu Province, Cold and Arid Regions Environmental and Engineering Research Institute, Chinese Academy of Sciences, Lanzhou 730000, China College of Resources and Environment, University of Chinese Academy of Sciences, Beijing 100049, China Heihe Remote Sensing Experimental Research Station, Cold and Arid Regions Environmental and Engineering Research Institute, Chinese Academy of Sciences, Lanzhou 730000, China School of Resource and Environmental Sciences, Wuhan University, Wuhan 430079, China;
[email protected] Cold and Arid Regions Environmental and Engineering Research Institute, Chinese Academy of Sciences, Lanzhou 730000, China;
[email protected] Correspondence:
[email protected]; Tel.: +86-0931-496-7975
Academic Editors: Zhenhong Li, Roberto Tomas, Zhong Lu and Prasad S. Thenkabail Received: 25 November 2015; Accepted: 16 February 2016; Published: 25 February 2016
Abstract: After an earthquake, rapidly and accurately obtaining building damage information can help to effectively guide the implementation of the emergency rescue and can reduce disaster losses and casualties. Using a single post-earthquake fully-polarimetric synthetic aperture radar (PolSAR) image to interpret building damage information not only involves a guaranteed data source but is also easy and can be rapidly implemented. This paper is focused on rapid building earthquake damage detection in urban areas using post-earthquake PolSAR data. In PolSAR images, the undamaged buildings parallel to satellite flight pass are different from the collapsed buildings, but the undamaged buildings divergent to satellite flight pass are very similar to collapsed buildings because of their volume scattering characteristics. In this paper, the method of polarization orientation angle (POA) compensation is employed to increase the scattering power of buildings divergent to satellite flight pass, and then Wishart supervised classification is implemented on the PolSAR data after POA compensation. In addition, the two parameters of normalized difference of the dihedral component (NDDC) and ρHHHV are proposed to improve the classification accuracy of the Wishart supervised classification, and both the undamaged buildings and collapsed buildings are determined. The study was carried out after the “4.14” Yushu earthquake in Yushu County, Qinghai province, China. The three damage levels are set for the urban area at the city block scale according to the values of the BBCR building damage index. The experimental results confirm that the scheme proposed in this paper can greatly improve the accuracy of the extraction of building damage information. Keywords: earthquake; buildings; damage assessment; PolSAR
1. Introduction In recent years, earthquake disasters have become more frequent around the world. The earthquake is one of the most dangerous natural disasters for human beings, and tens of billions of dollars in property loss are caused by earthquakes every year. Unfortunately, earthquakes cannot be predicted accurately at the current scientific level. Rapid and accurate damage assessment can help to reduce the disaster loss and can provide decision support for the rescue and reconstruction efforts. Buildings are
Remote Sens. 2016, 8, 171; doi:10.3390/rs8030171
www.mdpi.com/journal/remotesensing
Remote Sens. 2016, 8, 171
2 of 14
the places where people live, and most of the casualties and economic losses in an earthquake are caused by the damage to buildings [1]. Therefore, building damage assessment is one of the most important parts of earthquake damage assessment. The earthquake damage information obtained from a ground survey is the most accurate, but this process is inefficient and takes a long period of time. Remote sensing, which is characterized by wide coverage and speediness, is very suitable for areas with poor transport infrastructure and where there is a risk of secondary disasters. Optical remote sensing images allow easy interpretation, but they are susceptible to illumination variation [2]. Radar, with its strong penetrating ability, can operate day and night, independent of weather conditions. As a result, radar has become an important means of disaster assessment [3–6], but most of the studies of disaster assessment are based on multi-source [7,8] or multi-temporal data [9–12]. However, obtaining the matched pre-earthquake data is difficult in some situations, and the registration of the pre- and post-earthquake data is tricky and time-consuming. Therefore, it is quicker and more convenient to undertake earthquake damage assessment using only post-event single-temporal data. Balz [13], Dell’Acqua et al. [14], and Polli et al. [15] have all evaluated building earthquake damage using only post-earthquake single-polarization synthetic aperture radar (SAR) data. Nevertheless, PolSAR (fully-polarimetric SAR) data record the scattering amplitude and phase of the HH (horizontal/horizontal polarization), HV(horizontal/vertical polarization), VH(vertical/horizontal polarization), and VV(vertical/vertical polarization)polarizations four ways for ground objects, and can better assist with the understanding of scattering mechanisms [16] than single-polarization SAR imagery. As a result, building damage assessment using PolSAR imagery is more accurate and more reliable. Guo et al. [17] and Li et al. [18] introduced the parameter of ρ (circular polarization correlation coefficient) and proposed the H-α-ρ method to extract the spatial distribution of collapsed buildings in the Yushu urban area by using only a single post-earthquake SAR image. Subsequently, Zhao et al. [19] improved the H-α-ρmethod and replaced the parameter of ρ with the normalized circular-pol correlation coefficient (NCCC), and, at the same time, the homogeneity texture feature was employed to solve the problem of collapsed buildings and buildings divergent to satellite flight pass being mixed with each other. Shen et al. [20] extracted collapsed buildings based on feature template matching, using 13 polarimetric features. On account of the present research into building earthquake damage information extraction being rather limited, this work aims to undertake some new research in this area. A new scheme for earthquake damage assessment using only a single post-earthquake PolSAR image is proposed in this study. This work explores the potential of using polarimetric information to estimate earthquake damage for urban regions. In full PolSAR imagery, the scattering power of collapsed buildings characterized by volume scattering is weak, and the undamaged buildings are mainly characterized by double-bounce scattering, for which the scattering power is strong. However, the buildings divergent to satellite flight pass, which are not parallel to the flight pass, with significant cross-polarization backscattering, are similar to the collapsed buildings. This ambiguity between the building types commonly results in overestimation of collapsed buildings in damage assessment. The buildings divergent to satellite flight pass, rather than the buildings parallel to satellite flight pass, rotate the polarization basis and induce a polarization orientation angle (POA) shift from zero [21]. Therefore, we first implement POA compensation for the original PolSAR data in order to solve the scattering mechanism ambiguity between collapsed buildings and buildings divergent to satellite flight pass. Wishart supervised classification is then performed on the PolSAR data after POA compensation to extract the initial earthquake damage information. The parameters of the normalized difference of the dihedral component (NDDC) and the HH-HV correlation coefficient (ρHHHV ) are then introduced to extract the buildings divergent to satellite flight pass, which are added to the undamaged buildings generated from the Wishart supervised classification. The ρHHHV parameter is also used to improve the vegetation classification result of the Wishart supervised classification. When the undamaged buildings and collapsed buildings are acquired, the building collapse rate is quantized at the block
Remote Sens. 2016, 8, 171
3 of 14
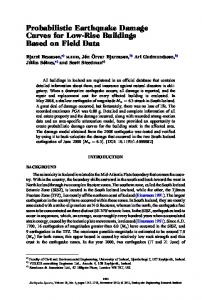
level by the building block collapse rate (BBCR). Finally, a map with three building damage levels for Sens. 2016, 8, 171 3 of 14 theRemote whole urban region is drawn according to the threshold value of the BBCR at the block scale. Methodology 2. 2. Methodology Damage AssessmentProcedures Procedures 2.1.2.1. TheThe Damage Assessment There fivekey keyprocedures procedures in in the process damage estimation framework proposed in There areare five processflow flowofofthe the damage estimation framework proposed this study, study, as as shown shown in is is in this in Figure Figure 1. 1. Firstly, Firstly,according accordingtotoSection Section2.2, 2.2,the themethod methodofofPOA POAcompensation compensation performed using the PolSAR data after preprocessing, and the new [T3] matrix after POA compensation performed using the PolSAR data after preprocessing, and the new [T3] matrix after POA compensation is obtained. is obtained. Original PolSAR data Preprocessing [S2] matrix
YFCD
[T3] matrix HHHV
POA shift matrix
Re( HHHV)< 1 && Im( HHHV)< 2
POA compensation
[T3] matrix
Dihedral component
YFCD
NDDC
NDDC>ε
Dihedral component
False
False
True
Wishart supervised classification Bare areas
Collapsed buildings Bare areas
Undamaged buildings
BB
Vegetation
Vegetation
The remaining data items are the collapsed buildings
Undamaged buildings
BBCR
The results of the earthquake damage assessment
Figure 1. The process flowdiagram diagramofofthe thedamage damage estimation estimation framework. “Re” and Figure 1. The process flow framework.“YFCD”, “YFCD”,“BB”, “BB”, “Re” and “Im” represent Yamaguchifour-component four-component decomposition, decomposition, the satellite “Im” represent thethe Yamaguchi thebuildings buildingsdivergent divergenttoto satellite flight pass, and real part and imaginary part the complexnumber, number,respectively. respectively.ε,ε,ε1, ε1,and andε2ε2are flight pass, and thethe real part and imaginary part ofof the complex are the threshold values. the threshold values.
Secondly, the Wishart supervised classification is performed on the PolSAR data after POA Secondly, the Wishart supervised classification is performed on the PolSAR data after POA compensation, and this procedure classifies the ground objects into the four classes of undamaged compensation, and this procedure classifies the ground objects into the four classes of undamaged buildings, collapsed buildings, vegetation, and bare areas. buildings, collapsed buildings, vegetation, and bare areas. Thirdly, Yamaguchi four-component decomposition is performed on the PolSAR data before and Thirdly, Yamaguchi four-component is performed the PolSARare data before and after POA compensation, respectively. At decomposition the same time, the two dihedraloncomponents respectively after POA compensation, respectively. At the same time, the two dihedral components are respectively extracted to compute the NDDC, as described in Section 2.4. Next, the ρHHHV parameter described in extracted the NDDC, as described in Section 2.4. Next, parameter HHHV Section to 2.4compute is computed. The buildings divergent to satellite flight the passρare then extracteddescribed using the in Section 2.4 is computed. The buildings divergent to satellite flight pass are then extracted using two parameters of the NDDC and ρHHHV. The data items of buildings divergent to satellite flight passthe two parameters of the NDDC and ρ . The data items of buildings divergent to satellite flight pass are added to the undamaged buildings generated from the Wishart supervised classification, and they HHHV arebecome added the to the undamaged total undamagedbuildings buildings.generated from the Wishart supervised classification, and they becomeAccording the total undamaged to the third buildings. step, the undamaged buildings are extracted. The collapsed buildings areAccording extracted tointhe thethird fourth step. The vegetation class generated fromThe thecollapsed Wishart buildings supervisedare step, the undamaged buildings are extracted. classification corrected meeting the condition of NDDC < ε. the TheWishart final output of the class of bare extracted in the isfourth step.by The vegetation class generated from supervised classification areas is the same as the classification result of the Wishart supervised classification. After the three
Remote Sens. 2016, 8, 171
4 of 14
is corrected by meeting the condition of NDDC < ε. The final output of the class of bare areas is the same as the classification result of the Wishart supervised classification. After the three classes of undamaged buildings, vegetation, and bare areas are determined, the remaining data items are the collapsed buildings. Finally, the building collapse rate of each block is derived from the BBCR index described in Section 2.6, and the damage levels of all the blocks are divided into three levels according to the threshold values of the BBCR index. The earthquake damage assessment with three damage levels is then mapped out for the whole urban region. The methodology and parameters are introduced in detail in the next section. 2.2. Polarization Orientation Angle (POA) Compensation For enhancing the contrast between buildings divergent to satellite flight pass and collapsed buildings, the scheme of POA compensation can be used to increase the double-bounce scattering power of buildings divergent to satellite flight pass. The buildings divergent to satellite flight pass patch can induce the POA shift θ, which can be estimated by Equation (1) based on the circular polarization method [21,22]:
θ“
$ & θ0 ,
i f θ0 ď
% θ0 ´ π , 2
i f θ0 ą
where θ0 “
π 4 π
(1)
4
1 rArg pxSRR S˚LL yq ` πs 4
(2)
According to Lee [21], the data compensation of the orientation angle of θ can be achieved by: Tθ “ R pθq TR pθqT
(3)
where the superscript T denotes the matrix transpose, and the rotation matrix R(θ) is given by: »
1 — R pθq “ – 0 0
0 cos2θ ´sin2θ
fi 0 ffi sin2θ fl cos2θ
(4)
2.3. Wishart Supervised Classification The scattering power of PolSAR imagery can be greatly increased using the method of POA compensation. Therefore, in order to extract the undamaged buildings as completely as possible, Wishart supervised classification based on the complex Wishart distribution of the polarimetric coherency matrix [23] is performed on the PolSAR data after POA compensation. The classification algorithm proposed in [24] for polarimetric SAR images is the recommended method for supervised classification. Details of the Wishart supervised classification algorithm can be found in [23]. The ground objects are classified into four categories using the Wishart supervised classification: undamaged buildings, collapsed buildings, vegetation, and bare areas. Among the classification results, the buildings divergent to satellite flight pass will be mixed in both the collapsed buildings and vegetation classes, so the two classes obtained from the Wishart supervised classification will be inaccurate. The undamaged buildings class still lack some of the buildings divergent to satellite flight pass whose scattering power is not strong enough. However, the bare areas class has a high reliability. Therefore, the results of the Wishart supervised classification are considered as the initial classification results for extracting the building damage information. The initial extraction results are then improved using the following two indicators.
Remote Sens. 2016, 8, 171
5 of 14
2.4. Building Divergent to Satellite Flight Extraction Because the results of the Wishart supervised classification are not very accurate, the two parameters of the NDDC and ρHHHV are proposed to correct the initial classification results. The buildings divergent to satellite flight pass are extracted using the two parameters of the NDDC and ρHHHV , which are introduced in the following. The indicator of the difference of the dihedral component (DDC) is defined as the difference between the dihedral component obtained from the Yamaguchi four-component decomposition [25,26] before and after POA compensation. It can be expressed as: the DDC equals the dihedral component after POA compensation minus the dihedral component before POA compensation. The DDC is normalized to a positive value range, which is named the normalized difference of the dihedral component, or the NDDC for short. The scattering power of the buildings divergent to satellite flight pass is greatly increased after the POA compensation. Meanwhile, the scattering intensity of the dihedral component generated from the Yamaguchi four-component decomposition is also increased. The NDDC can measure the change in the double-bounce scattering power after the POA compensation. The double-bounce scattering power of the buildings divergent to satellite flight pass changes a great deal after the POA compensation, while that of the targets with reflection symmetry changes little. That is, the NDDC values of the buildings divergent to satellite flight pass are high and those of the targets with reflection symmetry are low. Hence, the NDDC can be introduced in the process of earthquake damage assessment to find the buildings divergent to satellite flight pass, which can be used to correct the classification result of the undamaged buildings generated from the Wishart supervised classification. The scattering intensity of some buildings divergent to satellite flight pass is not increased to as strong as the buildings parallel to satellite flight pass using the method of POA compensation. Therefore, the class of undamaged buildings obtained from the Wishart supervised classification is not complete. The main missing undamaged buildings are the buildings divergent to satellite flight pass whose scattering intensity is not significantly increased. The data items with high NDDC values correspond to the buildings divergent to satellite flight pass, which can be added to the undamaged buildings. The threshold value εof the NDDC is set to distinguish the buildings divergent to satellite flight pass from the other ground objects: x P buildings divergent to satellite f light pass, i f NDDC pxq ą ε
(5)
The ρHHHV parameter is computed using the following equation: xS HH S HV ˚ y a ρ HHHV “ a xS HH S HH ˚ y xS HV S HV ˚ y
(6)
where the superscript * denotes the complex conjugate. In our experiments, we found that the distributions in the complex plane of the ρHHHV parameter for the buildings divergent to satellite flight pass and collapsed buildings are different. The ρHHHV parameter for the collapsed buildings is mainly distributed in the third quadrant of the complex plane, while the ρHHHV parameter for the buildings divergent to satellite flight pass is mainly distributed in the other areas of the complex plane. Therefore, the buildings divergent to satellite flight pass can be extracted using the ρHHHV parameter by the expression: x P buildings divergent to satellite f light pass, i f pRe pρ HHHV pxqq ă ε 1 & &Im pρ HHHV pxqq ă ε 2 q “ 0
(7)
where x is the data sample of the PolSAR imagery; “Re” and “Im” denote the real part and imaginary part of the complex number, respectively; and ε1 and ε2 are the two threshold values of the real part and imaginary part of ρHHHV , respectively.
Remote Sens. 2016, 8, 171
6 of 14
The ρHHHV parameter is computed using the PolSAR data without POA compensation, which can better distinguish collapsed buildings from buildings divergent to satellite flight pass than using the PolSAR data after POA compensation, based on experiments. In this work, the parameters of ρHHHV and the NDDC together determine the buildings divergent to satellite flight pass. The buildings divergent to satellite flight pass extracted using the NDDC include some collapsed buildings with the walls divergent to satellite flight, but the buildings divergent to satellite flight pass extracted by the ρHHHV parameter contain a few collapsed buildings with the walls divergent to satellite flight. Therefore, the data items simultaneously satisfying the two conditions of ρHHHV and the NDDC are determined as the buildings divergent to satellite flight pass, which can result in a higher extraction accuracy for the buildings divergent to satellite flight pass. Using the parameters of ρHHHV and the NDDC to extract the buildings divergent to satellite flight pass can be expressed as: x P buildings divergent to satellite f light pass, i f NDDC pxq ą ε & pRe pρ HHHV pxqq ă ε 1 & &Im pρ HHHV pxqq ă ε 2 q “ 0
(8)
The buildings divergent to satellite flight pass extracted by the parameters of ρHHHV and the NDDC, together with the undamaged buildings generated from the Wishart supervised classification, are the final output undamaged buildings. 2.5. Collapsed Building Extraction The vegetation class generated from the Wishart supervised classification still needs to be corrected. The NDDC values of vegetation items with reflection symmetry are low, and this property can be used to correct the classification result of the Wishart supervised classification for the vegetation class. Therefore, the data items of the vegetation generated from the Wishart supervised classification should simultaneously satisfy the condition of NDDC < ε, and can be determined as the final output of the vegetation class. The buildings divergent to satellite flight pass are determined according to Section 2.4, and the bare areas are obtained through the Wishart supervised classification. By excluding the data items of the above three classes, the remaining data items can be classified as the collapsed buildings. 2.6. Building Collapse Rate Calculation The building collapse rate is calculated at the block scale, and is defined as the ratio of the collapsed building samples to the total number of building samples in one block. The damage level of one block can be indexed by the building collapse rate of the block. The building collapse rate of blocks is introduced to handle the damage assessment at the block scale, and it is termed the building block collapse rate (BBCR). The blocks separated by roads are regarded as individual areas of similar built-up patch structure [19]. Each block is assigned a BBCR to assess the damage level of the block. The BBCR is expressed as: ř Cij i ř BBCR j “ ř (9) Uij ` Cij i
i
where BBCR j is the BBCR of the jth block; Cij indicates whether pixel i in the jth block belongs to a collapsed building or not, with values of 0 or 1; and Uij indicates whether pixel i in the jth block belongs to a undamaged building or not, with values of 0 or 1. 3. Experimental Results and Analysis 3.1. Experimental Data The study case is the “4.14” Yushu earthquake with magnitude 7.1 which occurred on 14th April, 2010. This earthquake severely affected the county of Yushu in Qinghai province of China. The location of the
Remote Sens. 2016, 8, 171
7 of 14
epicenter was 33.1˝ N and 96.6˝ E, as shown in Figure 2. The area is characterized by complicated terrain, poor transport infrastructure, and harsh climate. The vegetation of the Yushu urban region is sparse and low level, and the buildings are mainly rural residential buildings. More than 240,000 people were affected by the earthquake, and more than 2600 people died as a result of the earthquake. There were many collapsed buildings and more than 22 billion CNY of direct economic losses. The experiments were carried out on the post-event airborne PolSAR imagery to validate the effectiveness of the proposed approach for earthquake damage assessment. The PolSAR imagery was acquired one day after the earthquake by the Chinese airborne SAR mapping system (SARMapper), which was developed by a group led by the Chinese Academy of Surveying and Mapping (CASM). The system collects P-band data, and both the range resolution and azimuth resolution are approximately 1 m. Some specific information about the PolSAR data used in this work is listed in Table 1. The Pauli RGB image is shown in Figure 3, formed as a color composite of |HH ´ VV| (red), |HV| (green), and |HH + VV| (blue), with the size of 8192 ˆ 4384 pixels. The mountains surrounding Yushu County account for a large part of the imagery. In order to focus on analyzing the buildings of the urban area, an urban area mask was applied to discard the mountains and preserve the urban area as the region of interest. To allow a comparison with the existing damage assessment maps of the 4.14 Yushu earthquake [19,27,28], the geographic information system (GIS) data layer was depicted manually along the major roads and by reference to these damage assessment maps. The urban area was divided into 72 blocks by the GIS data layer containing 72 polygons, and the layout and characteristics of the buildings within the city blocks were similar. The ground-truth map shown in Figure 4 was drawn with reference to the above-mentioned damage assessment maps [19,27,28] and the high-resolution QuickBird image of Yushu County, and the damage levels were grouped into three levels for the 72 city blocks. Table 1. Information about the fully-polarimetric synthetic aperture radar (PolSAR) data used in this work. Date
Flight Direction
Illumination Direction
Incidence Angle
Band
Flight Altitude (m)
Spatial Resolution (m)
15 April 2010
From right to left
Bottom
50˝
P
10,079
1 (range); 1 (azimuth)
80°E
90°E
100°E
120°E
130°E
120°E
130°E
40°N
50°N
"4.14" Yushu Earthquake Ms7.1 Date: 14 April,2010 Depth: 33km Epicenter: 33.1°N, 96.6°E
40°N
50°N
±
110°E
Qinghai
20°N
30°N
Yushu County
20°N
30°N
O
0
990,000
80°E
1,980,000 Meters
90°E
100°E
110°E
Figure 2. Map of the location of Yushu earthquake.
Remote Sens. 2016, 8, 171 Remote Remote Sens. Sens. 2016, 2016, 8, 8, 171 171
8 of 14 88 of of 14 14
Figure 3. RGB color composite (|HH −− VV| (red), |HV| (green), and |HH (blue)) image Figure 3. Pauli Pauli RGB color color composite composite(|HH (|HH´ VV| |HH +++ VV| VV| Figure 3. Pauli RGB VV| (red), (red), |HV| |HV| (green), (green), and and |HH VV| (blue)) (blue)) image image of Yushu County. The areas marked by red and blue rectangles are the samples for collapsed of Yushu County. The areas marked by red and blue rectangles are the samples for collapsed of Yushu County. The areas marked by red and blue rectangles are the samples for collapsed buildings buildings and divergent to satellite flight pass, The center of buildings and buildings buildings satellite pass, respectively. respectively. center coordinates coordinates of the the and buildings divergent divergent to satelliteto flight pass,flight respectively. The centerThe coordinates of the image are image are 33°0′9′′N and 97°0′11′′E. image are 33°0′9′′N and 97°0′11′′E. ˝ 1 11 ˝ 1 11 33 0 9 N and 97 0 11 E.
Figure 4. Reference Reference map for for the earthquake damage assessment, with three damage levels: slight Figure Figure 4. 4. Reference map map for the the earthquake earthquake damage damage assessment, assessment, with with three three damage damage levels: levels: slight slight damage, moderate damage, and serious damage. If more than half of the buildings collapsed after damage, damage, moderate moderate damage, damage, and and serious serious damage. damage. If If more more than than half half of of the the buildings buildings collapsed collapsed after after the earthquake, the city block was considered as serious damage. The city block with less than the the earthquake, earthquake, the the city city block block was was considered considered as as serious serious damage. damage. The The city city block block with with less less than than one-third buildings collapsing was considered as slight damage. The city block with the damage level one-third buildings collapsing was considered as slight damage. The city block with the damage one-third buildings collapsing was considered as slight damage. The city block with the damage between slight damage and serious damage was considered as moderate damage. level level between between slight slight damage damage and and serious serious damage damage was was considered considered as as moderate moderate damage. damage.
3.2. The Results Results of the the Experiments 3.2. 3.2. The The Results of of the Experiments Experiments According to the the process flow flow of the the earthquake damage damage assessment shown shown in Figure Figure 1, the the POA According According to to the process process flow of of the earthquake earthquake damage assessment assessment shown in in Figure 1, 1, the POA POA shift was first estimated based on the circular polarization method, and the POA compensation described shift shift was was first first estimated estimated based based on on the the circular circular polarization polarization method, method, and and the the POA POA compensation compensation in Section 2.2Section was carried out for theout PolSAR data after data speckle noise filtering. The two dihedral described described in in Section 2.2 2.2 was was carried carried out for for the the PolSAR PolSAR data after after speckle speckle noise noise filtering. filtering. The The two two components before and after POA compensation were then extracted on the basis of Yamaguchi dihedral dihedral components components before before and and after after POA POA compensation compensation were were then then extracted extracted on on the the basis basis of of four-component decomposition. As can be seen from Figure 5, the dihedral component image brightness Yamaguchi Yamaguchi four-component four-component decomposition. decomposition. As As can can be be seen seen from from Figure Figure 5, 5, the the dihedral dihedral component component changed after the changed POA compensation, and there are greatand differences in somedifferences parts of the two images, image image brightness brightness changed after after the the POA POA compensation, compensation, and there there are are great great differences in in some some parts parts such as the upper right part and the bottom left part. These areas are mainly undamaged buildings of of the the two two images, images, such such as as the the upper upper right right part part and and the the bottom bottom left left part. part. These These areas areas are are mainly mainly divergent to satellite flight pass andsatellite collapsed buildings divergent to satellite flight pass. The NDDC undamaged undamaged buildings buildings divergent divergent to to satellite flight flight pass pass and and collapsed collapsed buildings buildings divergent divergent to to satellite satellite parameter described in Section 2.4described was calculated and is shown in Figure 6. According to the color flight flight pass. pass. The The NDDC NDDC parameter parameter described in in Section Section 2.4 2.4 was was calculated calculated and and is is shown shown in in Figure Figure 6. 6. bar in Figure 6, 190 can be easily chosen as the threshold value for distinguishing the buildings According According to to the the color color bar bar in in Figure Figure 6, 6, 190 190 can can be be easily easily chosen chosen as as the the threshold threshold value value for for divergent to satellite flight pass from the other ground objects, which are mainly reflection symmetric. distinguishing distinguishing the the buildings buildings divergent divergent to to satellite satellite flight flight pass pass from from the the other other ground ground objects, objects, which which are are The areas corresponding to NDDC > 190 are mainly buildings divergent to satellite flight pass. mainly mainly reflection reflection symmetric. symmetric. The The areas areas corresponding corresponding to to NDDC NDDC >> 190 190 are are mainly mainly buildings buildings divergent divergent Meanwhile, the PolSAR data after POA compensation were classified into undamaged buildings, to satellite pass. the data POA compensation were into to satellite flight flight pass. Meanwhile, Meanwhile, the PolSAR PolSAR data after after POA compensation were classified classified into collapsed buildings, vegetation, and bare areas using the Wishart supervised classification described undamaged buildings, collapsed buildings, vegetation, and bare areas using the Wishart supervised undamaged buildings, collapsed buildings, vegetation, and bare areas using the Wishart supervised
classification classification described described in in Section Section 2.3. 2.3. For For vegetation, vegetation, the the NDDC NDDC was was less less than than 190. 190. Therefore, Therefore, if if aa data data
Remote Sens. 2016, 8, 171
9 of 14
Remote Sens. 2016, 8, 171
9 of 14
Remote Sens. 2016, 8, 171
9 of 14
in Section 2.3. For vegetation, the NDDC was less than 190.classification, Therefore, ifand a data item was classified item was classified as vegetation by the Wishart supervised simultaneously satisfiedas vegetation by the Wishart supervised classification, and simultaneously satisfied NDDC < 190, it was item was< classified vegetation by the supervised classification, and simultaneously satisfied NDDC 190, it wasasfinally classified asWishart vegetation. finally classified vegetation. NDDC < 190, itas was finally classified as vegetation.
(a) (a)
(b) (b) Figure 5. Images of the dihedral component before and after POA compensation. (a) before POA Figure 5. Images of the dihedral component before and after POA compensation. (a) before POA compensation; (b)ofafter compensation. Figure 5. Images the POA dihedral component before and after POA compensation. (a) before POA compensation; (b) after POA compensation. compensation; (b) after POA compensation.
Figure 6. NDDC map. Figure 6. NDDC map. Figure 6. NDDC map.
TheThe ρHHHV to Section Section2.4 2.4using usingthe thePolSAR PolSARdata datawithout without ρHHHVparameter parameterwas was calculated calculated according according to The ρHHHV parameter was calculated according to Section 2.4from using theregions PolSAR POA compensation. 5000 samples were randomly selected the two regions ofwithout interest POA compensation. TheThe 5000 samples were randomly selected from the two ofdata interest (ROIs) POA compensation. The 5000 samples were randomly selected from the two regions of interest (ROIs) of buildings divergent to satellite flight pass and the two ROIs of collapsed buildings, of buildings divergent to satellite flight pass and the two ROIs of collapsed buildings, respectively, (ROIs) of buildings satellite flight pass and two ROIs respectively, and aredivergent shown intoFigure As can be 7, seen from Figure 7,ofthecollapsed collapsed building and are shown in Figure 7. As can be seen7.from Figure thethe collapsed building samplesbuildings, are mainly respectively, and are quadrant shown inofFigure 7. As can be seen from Figure 7,plane, the collapsed building samples in arethe mainly distributed in third quadrant of the the buildings complex andtothe buildings distributed third thethe complex plane, and divergent satellite flight samples are mainly distributed in the third quadrant of the complex plane, and the buildings divergent to satellite flight samples are mainly located in other parts of the complex plane. samples are mainly located in other parts of the complex plane. Therefore, the buildings divergent to divergent to satellite flight samples are mainly located in other parts of the complex plane.
Remote Sens. 2016, 8, 171 Remote Sens. 2016, 8, 171 Remote Sens. 2016, 8, 171
1010 of of 1414 10 of 14
Therefore, the buildings divergent to satellite flight pass class can be finally determined by the satellite flight pass class candivergent be finallyρ determined condition complex number condition that the complex number is notflight inby thethe third quadrant of the complex plane, and the Therefore, the buildings toHHHV satellite pass class canthat be finally determined byρthe HHHV is not in the third quadrant of the the NDDC is greater than The buildings NDDC is that greater than 190. The complex buildings divergent to satellite flight pass and190. the undamaged condition the complex number ρHHHV isplane, not inand the third quadrant of the complex plane, and the buildings generated from the Wishart supervised classification, which arethe mainly undamaged NDDC is than 190. The buildings divergent to satellite flight pass and the undamaged divergent to greater satellite flight pass and the undamaged buildings generated from Wishart supervised buildings generated parallel tofrom satellite flight pass, togetherclassification, form to thesatellite final classification result of thethe buildings theundamaged Wishart supervised which are pass, mainly undamaged classification, which are mainly buildings parallel flight together form undamaged buildings. buildings parallel to satellite flight pass,buildings. together form the final classification result of the final classification result of the undamaged undamaged buildings.
Figure ρHHHVofofthe thebuilding building divergent divergent to satellite samples. Figure 7. ρ7.HHHV satellite flight flightsamples samplesand andcollapsed collapsedbuilding building samples. The and blue dotsrepresent represent thecollapsed collapsed building samples the divergent to to Figure 7.dots ρHHHV of thedots building divergent to satellitebuilding flight samples andand collapsed building samples. The redred dots and blue the samples and thebuilding building divergent satellite flight samples, respectively. The red dots and bluerespectively. dots represent the collapsed building samples and the building divergent to satellite flight samples, satellite flight samples, respectively.
The bare areas class was determined by the classification result of the Wishart supervised The bare areas class was determined by the classification result of the Wishart supervised classification. collapsed buildings were considered to be the remaining partsWishart after removing the The bare The areas class was determined by the classification result of the supervised classification. The collapsed buildings were considered to be the remaining parts after removing three classes The of vegetation, undamaged bare The parts distribution map of the the classification. collapsed buildings werebuildings, consideredand to be theareas. remaining after removing the three classes of vegetation, undamaged buildings, and bare areas. The distribution map of the non-buildings the three kinds of buildings is shown Figure 8. The building damagemap levelofindex three classes ofand vegetation, undamaged buildings, andinbare areas. The distribution the non-buildings and the three kindsusing of buildings is shown shown described in Figure in 8.The Thebuilding building damage level index of each block was the BBCRismethod Section 2.6, asdamage shown level in Figure 9. non-buildings andimplemented the three kinds of buildings in Figure 8. index of of each block was implemented using the BBCR method described in Section 2.6, as shown in Figure A each greater BBCR corresponds tothe a more seriously Three damage levels were set block wasvalue implemented using BBCR method damaged describedblock. in Section 2.6, as shown in Figure 9. 9. A greater BBCR value corresponds more damaged block. Three damage levels were forgreater the building collapse degree of to the When thedamaged BBCR was less than 0.3, the damage level was A BBCR value corresponds toaablocks. more seriously seriously block. Three damage levels were setset forfor the building collapse degree of the blocks. When the BBCR was less than 0.3, the damage level was set the as slight damage. A BBCR ofof greater than 0.5 wasthe set BBCR as the serious level, and a BBCR building collapse degree the blocks. When was lessdamage than 0.3, the damage levelvalue was setset as slight damage. A BBCR of greater than 0.5 was set as the serious damage level, and a BBCR value of between 0.3 and 0.5 was considered be 0.5 moderate The results oflevel, the damage assessment as slight damage. A BBCR of greater to than was setdamage. as the serious damage and a BBCR value of of between 0.3in and was considered to damage. Theresults results thedamage damage assessment arebetween shown Figure where the numbered blocks are the misclassified blocks, and the assessment color of the 0.3 and0.5 0.510, was considered to be be moderate moderate damage. The ofofthe areare shown indenotes Figure 10, where the blocks are the the misclassified blocks, and color numbers the correct level. For example, the no. 8 blockblocks, should actually be slightly shown in Figure 10, wheredamage thenumbered numbered blocks are misclassified and thethe color of of thethe damaged (green), butcorrect is misclassified moderate damagethe (blue). numbers denotes the damage level. For example, theno. no.88block blockshould shouldactually actually slightly numbers denotes the correct damage as level. For example, bebe slightly damaged (green),but butisismisclassified misclassified as damaged (green), as moderate moderatedamage damage(blue). (blue).
Figure 8. Distribution map of the non-buildings and the three kinds of buildings at the block scale. The NB, PB, BB and CB represent the non-buildings, parallel to satellite flight pass, the Figure Distribution map ofthe the non-buildings non-buildings and the three ofofbuildings at at the block scale. Figure 8. 8. Distribution map of andthe thebuildings threekinds kinds buildings the block scale. buildings divergent to satellite flight pass and the collapsed buildings, respectively. The NB, PB, BB and CB represent the non-buildings, the buildings parallel to satellite flight pass, the The NB, PB, BB and CB represent the non-buildings, the buildings parallel to satellite flight pass, the buildings divergenttotosatellite satelliteflight flightpass passand and the the collapsed collapsed buildings, buildings divergent buildings,respectively. respectively.
Sens. 2016, 8, 171 RemoteRemote Sens. 2016, 8, 171
11 of 14 11 of 14 11 of 14
Remote Sens. 2016, 8, 171
Figure 9. BBCR map for each block.
Figure for each eachblock. block. Figure9.9.BBCR BBCR map map for
Figure 10. The damage assessment results. The numbered andthe thecolor colorofof the Figure 10. The damage assessment results. The numberedblocks blocks are are misclassified, misclassified, and Figure 10. The damage assessment results. The numbered blocks are misclassified, and the color of numbers denotesdenotes the color theof correct damage level. the numbers theof color the correct damage level. the numbers denotes the color of the correct damage level.
3.3. Analysis Discussion 3.3. Analysis and and Discussion
3.3. Analysis and Discussion
The whole procedure the productionof of aa damage damage assessment map hashas taken five five to sixtohours, The whole procedure of of the production assessment map taken six hours, whole of the production of a damage assessment map after has taken five to six hours, whichThe can meetprocedure rapid acquisition for buildings damage information an earthquake. The whichwhich can meet rapid acquisition for buildings damage information after an earthquake. The damage meet rapid acquisition buildings damage information after an earthquake. The damagecan assessment accuracies of the for proposed method and the method only using the PolSAR data assessment ofaccuracies the proposed method and the method only using the PolSAR data without damageaccuracies assessment the proposed method and the method the PolSAR without POA compensation forof the Wishart supervised classification are only listedusing in Table 2. As candata be POAseen compensation for the Wishart supervised classification are listed in Table 2. As can be seen without POA compensation for the Wishart supervised classification are listed in Table 2. As can be in in Table 2, the method proposed in this study significantly improves the damage assessment seen in method Table 2, the method proposed in this study significantly improves the damage assessment Tableaccuracy. 2, the proposed in this study significantly improves the damage assessment accuracy. In addition, compared with the method proposed by Zhao et al. [19], the proposed method accuracy. In addition, compared withassessment theproposed methodaccuracy. proposed byetthe Zhao et al. [19], the proposed method In addition, compared with method by Zhao al.seriously [19], thedamaged proposed method again greatly improves thethe damage For blocks, thereagain again greatly improves the damage assessment accuracy. For the seriously damaged blocks, there are improves actually 25the blocks in theassessment ground-truthaccuracy. map, but there are seriously 31 blocks classified the Wishart greatly damage For the damagedbyblocks, there are are actually 25 blocks in the ground-truth map, but there are 31 blocks classified by the Wishart supervised classification using the PolSAR data without POA compensation, while there are 26 blocks actually 25 blocks in the ground-truth map, but there are 31 blocks classified by the Wishart supervised supervisedby classification using the PolSAR data without POAproposed compensation, there are 26 blocks generated Therefore, method thiswhile study reduces the by classification usingthe theproposed PolSAR method. data without POAthe compensation, whileinthere are 26also blocks generated generated by the proposed method. Therefore, the method proposed in this study also reduces the over-assessment of the building collapse rate, which could help to save human, physical, and the proposed method.ofTherefore, the collapse method rate, proposed incould this study also reduces thephysical, over-assessment over-assessment the building which help to save human, and financial resources for the emergency rescue after an earthquake. of thefinancial buildingresources collapsefor rate, couldrescue help after to save human, physical, and financial resources for the thewhich emergency an earthquake. emergency rescue after an earthquake. Table 2. Comparison of the damage assessment accuracy of the two methods. Table 2. Comparison of the damage assessment accuracy of the two methods.
Proposed Supervised Table 2. Comparison The of the damageMethod assessment Wishart accuracy of the twoClassification methods.
The Proposed Method (Experiment) Wishart Supervised Classification SLD MOD SED (Experiment) SLD MOD SED SLDProposed MODMethod SED(No.Wishart MOD Classification SED ofSLD Blocks) The Supervised SLD 10 4 0 (No. of Blocks) 9 3 2 SLD 10 4 3 (Reference) MOD 1 30 20 (Experiment) 39 22 82 (Reference) MOD 30 2 22 8 SED 01 1 24 03 4 21 SLD MOD SED SLD MOD SED SED 0 1 24 0 21 OA: 88.89% OA:4 72.22% (No. of Blocks) OA: 72.22% OA: 88.89% OA, SLD, MOD, and SED represent overall accuracy, slight damage, moderate damage, and serious damage, OA, SLD, MOD, and SED represent10overall accuracy, slight damage, and serious damage, SLD 4 0 9 moderate damage, 3 2 respectively. 1 30 2 3 22 8 (Reference) MOD respectively.
SED
0
1 OA: 88.89%
24
0
4
21
OA: 72.22%
OA, SLD, MOD, and SED represent overall accuracy, slight damage, moderate damage, and serious damage, respectively.
Remote Sens. 2016, 8, 171
12 of 14
For the results of the method proposed in this study with the Yushu earthquake data, there are eight blocks misclassified. Among them, the damage levels of both block no. 1 and block no. 4 are underestimated, while the damage levels of blocks no. 2 and no. 3 and blocks nos. 5 to 8 are overestimated. These blocks are mainly low-rise and small rural residential buildings with earth/wood structure or masonry structure. The remaining walls of the collapsed buildings present dihedral scattering characteristics and are easily misclassified as undamaged buildings. Thus, some remaining parts of the damaged buildings parallel to satellite flight pass and the damaged buildings divergent to satellite flight pass may be misclassified as undamaged buildings, which is the main reason for the underestimation of the block damage level. The buildings divergent to satellite flight pass cannot be completely extracted with just the two parameters of the NDDC and ρHHHV , so some ground objects with comparatively weak scattering power and characterized by volume scattering are still classified as collapsed buildings. This results in the overestimation of the building collapse rate at the block scale. 4. Conclusions Collapsed buildings caused by an earthquake are one of the main causes of casualties, so rapid acquisition of the collapsed building information after the earthquake can play an extremely important role in saving lives. The use of only a single post-earthquake PolSAR image to extract the collapse information can meet the needs of rapid and accurate disaster information acquisition, and can assist with a rapid and effective emergency rescue operation. In this study of earthquake damage assessment, the two parameters of the NDDC and ρHHHV were used to improve the classification results of Wishart supervised classification performed on the PolSAR data after POA compensation, with the aim of obtaining non-buildings, undamaged buildings (including the buildings parallel to satellite flight pass and the buildings divergent to satellite flight pass), and collapsed buildings. This feasibility study was performed on the airborne PolSAR imagery acquired one day after the Yushu earthquake. The buildings divergent to satellite flight pass were extracted based on the conditions of NDDC > 190 and ρHHHV not being in the third quadrant of the complex plane, and were included in the undamaged buildings. These operations improved the accuracy of the undamaged building extraction. Using the condition of NDDC < 190 to restrict the vegetation generated from the Wishart supervised classification improved the non-building extraction accuracy and reduced the numbers of collapsed buildings divergent to satellite flight pass mixed with the vegetation class. At the same time, the above operations excluded the non-buildings and undamaged buildings as much as possible, and also improved the extraction accuracy of the collapsed buildings. Finally, the earthquake damage assessment map of the Yushu urban region with three damage levels at the block scale was obtained according to the value of the BBCR index for each block. The damage assessment at the block scale can not only be flexibly applied to multiple-resolution radar images and can avoid some of the errors of damage assessment at the single-building scale, but could also be more effective in assisting with making comprehensive arrangements in the process of emergency rescue. All in all, the method proposed in this study can greatly improve the accuracy of earthquake damage assessment. Nevertheless, some undamaged buildings divergent to satellite flight still cannot be extracted, and some remaining parts of collapsed buildings are easily misidentified as undamaged buildings, which is the main reason for the errors in the building earthquake damage information extraction. In our future work, state-of-the-art filtering methods [29] and multi-classifier fusion [30,31] will be considered to improve the current results. Acknowledgments: This work was supported by the Program for Changjiang Scholars and Innovative Research Team in University (IRT1278); the Hundred Talent Program of the Chinese Academy of Sciences (29Y127D01); the Cross-Disciplinary Collaborative Teams Program for Science, Technology and Innovation of the Chinese Academy of Sciences; the Earthquake Science and Technology Development Fund Program of Lanzhou Earthquake Research Institute, the China Earthquake Administration (2015M02); the Object-Oriented High Trusted SAR Processing System of the National 863 Subject Program; and the Airborne Multiband Polarimetric Interferometric SAR Mapping System of the National Major Surveying and Mapping Science and Technology Special Program. We would also like to thank the anonymous reviewers for their advice on improving the quality of this paper.
Remote Sens. 2016, 8, 171
13 of 14
Author Contributions: Wei Zhai drafted the manuscript and was responsible for the research design, writing the source code, data analysis, and interpretation of the results. HuanfengShen designed the structures of the paper and guided the experiments. Chunlin Huang edited and reviewed the manuscript. Wansheng Pei collected literatures. Conflicts of Interest: The authors declare no conflict of interest.
References 1. 2. 3. 4. 5. 6. 7. 8. 9.
10. 11. 12.
13. 14.
15.
16. 17. 18. 19. 20. 21.
Matsuoka, M.; Yamazaki, F. Use of satellite SAR intensity imagery for detecting building areas damaged due to earthquakes. Earthq. Spectra 2004, 20, 975–994. [CrossRef] Zhai, W.; Shen, H.; Huang, C.; Pei, W. Fusion of polarimetric and texture information for urban building extraction from fully polarimetric SAR imagery. Remote Sens. Lett. 2016, 7, 31–40. [CrossRef] Matsuoka, M.; Nojima, N. Building damage estimation by integration of seismic intensity information and satellite L-band SAR imagery. Remote Sens. 2010, 2, 2111–2126. [CrossRef] Shinozuka, M.; Ghanem, R.; Houshmand, B.; Mansouri, B. Damage detection in urban areas by SAR imagery. J. Eng. Mech. 2000, 126, 769–777. [CrossRef] Miura, H.; Midorikawa, S.; Matsuoka, M. Building damage assessment using high-resolution satellite SAR images of the 2010 Haiti Earthquake. Earthq. Spectra 2015. [CrossRef] Trianni, G.; Gamba, P. Damage detection from SAR imagery: Application to the 2003 Algeria and 2007 Peru earthquakes. Int. J. Navig. Observ. 2008. [CrossRef] Chini, M.; Pierdicca, N.; Emery, W.J. Exploiting SAR and VHR optical images to quantify damage caused by the 2003 Bam earthquake. IEEE Trans. Geosci. Remote Sens. 2009, 47, 145–152. [CrossRef] Brunner, D.; Lemoine, G.; Bruzzone, L. Earthquake damage assessment of buildings using VHR optical and SAR imagery. IEEE Trans. Geosci. Remote Sens. 2010, 48, 2403–2420. [CrossRef] Ciampalini, A.; Bardi, F.; Bianchini, S.; Frodella, W.; Ventisette, C.D.; Moretti, S.; Casagli, N. Analysis of building deformation in landslide area using multisensor PSInSAR™ technique. Int. J. Appl. Earth Obs. 2014, 33, 166–180. [CrossRef] Gamba, P.; Dell’Acqua, F.; Trianni, G. Rapid damage detection in the Bam area using multitemporal SAR and exploiting ancillary data. IEEE Trans. Geosci. Remote Sens. 2007, 45, 1582–1589. [CrossRef] Sato, M.; Chen, S.W.; Satake, M. Polarimetric SAR analysis of tsunami damage following the March 11, 2011 East Japan earthquake. Proc. IEEE 2012, 100, 2861–2875. [CrossRef] Watanabe, M.; Motohka, T.; Miyagi, Y.; Yonezawa, C.; Shimada, M. Analysis of urban areas affected by the 2011 off the Pacific Coast of Tohoku earthquake and tsunami with L-band SAR full-polarimetric mode. IEEE Geosci. Remote Sens. Lett. 2012, 9, 472–476. [CrossRef] Balz, T.; Liao, M. Building-damage detection using post-seismic high-resolution SAR satellite data. Int. J. Remote Sens. 2010, 31, 3369–3391. [CrossRef] Dell’Acqua, F.; Gamba, P.; Polli, D.A. Earthquake damage assessment from post-event VHR radar data: From Sichuan, 2008 to Haiti, 2010. In Proceedings of the IEEE Joint Urban Remote Sensing Event (JURSE), Munich, Germany, 11–13 April 2011; pp. 201–204. Polli, D.; Dell’Acqua, F.; Gamba, P.; Lisini, G. Earthquake damage assessment from post-event only radar satellite data. In Proceedings of the Eighth International Workshop on Remote Sensing for Disaster Response, Tokyo, Japan, 30 September–1 October 2010. Chen, S.W.; Sato, M. Tsunami damage investigation of built-up areas using multitemporal spaceborne full polarimetric SAR images. IEEE Trans. Geosci. Remote Sens. 2013, 51, 1985–1997. [CrossRef] Guo, H.; Liu, L.; Zhang, L.; Fan, X.; Li, X.; Zhang, L. Earth Observation for Earthquake Disaster Monitoring and Assessment; INTECH Open Access Publisher: Rijeka, Croatia, 2012. Li, X.; Guo, H.; Zhang, L.; Xiao, C.; Lei, L. A new approach to collapsed building extraction using RADARSAT-2 polarimetric SAR imagery. IEEE Geosci. Remote Sens. Lett. 2012, 9, 677–681. Zhao, L.; Yang, J.; Li, P.; Zhang, L.; Shi, L.; Lang, F. Damage assessment in urban areas using post-earthquake airborne PolSAR imagery. Int. J. Remote Sens. 2013, 34, 8952–8966. [CrossRef] Shen, J.C.; Xu, X.; Dong, H.; Gui, L.; Song, C. Collapsed building extraction from single full polarimetric SAR image after earthquake. Sci. Technol. Eng. 2015, 15, 86–91. Lee, J.S.; Schuler, D.L.; Ainsworth, T.L. Polarimetric SAR data compensation for terrain azimuth slope variation. IEEE Trans. Geosci. Remote Sens. 2000, 38, 2153–2163.
Remote Sens. 2016, 8, 171
22.
23. 24.
25. 26. 27.
28. 29. 30. 31.
14 of 14
Kimura, H.; Papathanassiou, K.P.; Hajns, I. Polarization orientation effects in urban areas on SAR data. In Proceedings of the IEEE International Geoscience and Remote Sensing Symposium, Seoul, Korea, 25–29 July 2005; pp. 4863–4867. Lee, J.S.; Grunes, M.R.; Kwok, R. Classification of multi-look polarimetric SAR imagery based on complex Wishart distribution. Int. J. Remote Sens. 1994, 15, 2299–2311. [CrossRef] Rodrigues, A.; Corr, D.G.; Pottier, E.; Ferro-Famil, L. Land cover classification using polarimetric SAR data. In Proceedings of the Workshop on POLinSAR—Applications of SAR Polarimetry and Polarimetric Interferometry, Frascati, Italy, 14–16 January 2003. Yamaguchi, Y.; Moriyama, T.; Ishido, M.; Yamada, H. Four-component scattering model for polarimetric SAR image decomposition. IEEE Trans. Geosci. Remote Sens. 2005, 43, 1699–1706. [CrossRef] Yamaguchi, Y.; Yajima, Y.; Yamada, H. A four-component decomposition of POLSAR images based on the coherency matrix. IEEE Geosci. Remote Sens. Lett. 2006, 3, 292–296. [CrossRef] China Earthquake Administration. Preliminary Remote Sensing Results of Qinghai Yushu Earthquake Emergency. Available online: http://www.cea.gov.cn/manage/html/8a8587881632fa5c0116674a018300cf/_ content/10_04/17/1271485532211.html (accessed on 20 November 2015). Guo, H.D.; Zhang, B.; Lei, L.P.; Zhang, L.; Chen, Y. Spatial distribution and inducement of collapsed buildings in Yushu earthquake based on remote sensing analysis. Sci. China Earth Sci. 2010, 53, 794–796. [CrossRef] Ma, X.; Shen, H.; Zhang, L.; Yang, J.; Zhang, H. Adaptive anisotropic diffusion method for polarimetric SAR speckle filtering. IEEE J. Sel. Topics Appl. Earth Observ. Remote Sens. 2015, 8, 1041–1050. [CrossRef] Ma, X.; Shen, H.; Yang, J.; Zhang, L.; Li, P. Polarimetric-spatial classification of SAR images based on the fusion of multiple classifiers. IEEE J. Sel. Topics Appl. Earth Observ. Remote Sens. 2014, 7, 961–971. Samat, A.; Du, P.; Baig, M.H.A.; Sumit, C.; Liang, C. Ensemble learning with multiple classifiers and polarimetric features for polarized SAR image classification. Photogramm. Eng. Remote Sens. 2014, 80, 239–251. [CrossRef] © 2016 by the authors; licensee MDPI, Basel, Switzerland. This article is an open access article distributed under the terms and conditions of the Creative Commons by Attribution (CC-BY) license (http://creativecommons.org/licenses/by/4.0/).