Pak. J. Biotechnol. Vol. 13 (special issue on Innovations in information Embedded and Communication Systems) Pp. 174 - 177 (2016)
BUNDLE BLOCK DETECTION USING DIFFERENTIAL EVOLUTION AND LEVENBERG MARQUARDT NEURAL NETWORK Padmavathi Kora Department of E.C.E G.R.I.E.T, Hyderabad, Andhra Pradesh, Email:
[email protected] ABSTRACT Globally heart diseases are the most prevalent cause for human mortality. Every year, 9.4 million deaths are attributed to heart diseases (cardiac arrhythmia) including 51% of deaths due to strokes and 45% deaths due to coronary heart diseases. Hence identification of these heart diseases in the early stages becomes important for the prevention of cardiac re- lated deaths. Although the existing conventional ECG analysis methods like, RR interval, Wavelet transform (WT) with classification techniques, such as, Support Vector machine (SVM), K-Nearest Neighbor (KNN) and Levenberg Marquardt Neural Network (LMNN) are used for detection of cardiac arrhythmia, the fea- ture extraction using these methods generally yield a large number of features, of which many might be insignificant. In this paper Differential Evolution (DE) can be efficiently used to detect the changes in the ECG using optimized features from the ECG beats. For the detection of normal and BBB beats, these DE feature values are given as the input for the LMNN classifier. The data was collected from MIT-BIH arrhythmia database. Index Terms—Bundle Block, Differential Evolution, LMNN classifier, MIT-BIH Arrhythmia database.
I. Introduction Electro-Cardiogram is used to access the electrical activ ity of a human heart [6]. Normally, heart beats in a regular manner. The heartbeat originates in the upper chambers of the heart area called the Sino Atrial (SA) node. The impulse then travel in to the AtrioVentricular (AV) node. Then AV node carries the impulse through the Bundle of His and then splits into two the bundle branches. The bundle branches carry the impulse to the Purkinje fibers located in the ventricles, and make them to contract. BBB is developed when there is block along the path that electrical pulses travel to make the heart to beat. Since the electrical pulses cannot travel through the preferred path way across the BBB, instead it may travel through muscles that slows down the electrical movement and changes the directional path of the pulses. A condition in which there is a delay in the in the heart lower chambers may be observed through the changes in the ECG. ECG is the cost effective tool for analyzing the cardiac abnormalities. The diagnosis of the heart ailments by the doctors is done following a standard changes. In this project our aim is to automate the above procedure so that it leads to correct diagnosis. This work consists of three major steps for the detection of heart diseases, namely, Signal preprocessing, Feature optimazation and Classification. In the preprocessing phase, data can be collected from real subjects but in this thesis it is collected from online MIT-BIH database. In this step the obtained ECG signals are filtered to remove noise and then each ECG file is segmented into beats. In the second step, beat features are optimized using DE techniques. In general, the extracted features using traditional methods contain some redundant and non-discriminative features, which lead to computational burden and the performance loss. Hence the
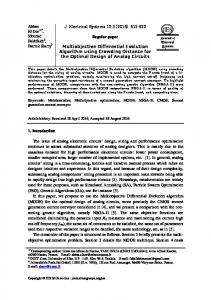
above techniques do not give satisfactory detection accuracy. Our goal is to predict the optimum features to overcome this problem for a chosen classification technique. Hence in the second step, optimization techniques are added to find the smallest set of features that maximize the classification performance. The final step is the classification of the signal into three different cardiac conditions. Different feature extraction techniques such as [11,12,13,14, 15] are used for the ECG arrhythmia classification. The waveform changes in the different types of ECG beats was shown in the Fig. 1, 2 and 3. Here in this paper DE technique used as the feature extraction (optimization) technique.
Fig. 1. Normal beat
Fig. 2. Left Bundle Branch Block
174
Pak. J. Biotechnol. Vol. 13 (special issue on Innovations in information Embedded and Communication Systems) Pp. 174 - 177 (2016)
from the MIT BIH Arrhythmia Database [1]. Which consists of 5 normal, 3 LBBB and 3 RBBB patients data at 360Hz Sampling rate of one hour duration as shown in Table I. TABLE I MIT-BIH Record Numbers
Record 100 101 103 106 109 111 118 123 124 207
Fig. 3. Right Bundle Branch Block
In recent years many models are developed based on the evolutionary behaviors of living beings and have been applied for solving the sensible real world issues. Among them, DE may be a population based optimization technique. DE is used extensively as a model to solve many engineering applications. In Recent years, DE has been applied with success to some engineering concepts like, harmonic estimation, optimum management,reduction machine learning and transmission loss and so on. The proposed DE scheme has been compared Particle Swarm Optimization (PSO) [7,8,9] which is a popular algorithm for optimization of ECG features with respect to the following performance measures like convergence speed, and the accuracy in the final output. The ECG classification flow diagram is shown in the Fig. 4.
NB 2237 1858 2080 1505 0 0 0 1513 0 0
LBBB 0 0 0 0 2490 2121 0 0 0 1457
RBBB 0 0 0 0 0 0 2164 0 1529 85
B. Noise Removal Sgolay filtering was used to remove the baseline wander present in the signal as shown Fig. 5
Fig. 5. ECG Baseline Wander removal, Up signal:Original sinal,Down signal:Baseline Wander removed signal
C. R peak detection and Beat segmentation of ECG Distance between two R peaks is called RR interval. 2/3 of the RR interval samples to the right of R peak and 1/3 of the RR interval samples to the left of R peak were considered as one beat as in Fig. 7. Each beat after segmentation was re sampled to 200 samples.
Fig. 4. ECG classification flow diagram
II. Pre Processing A. Data Collection The data for the classification was taken
175
Pak. J. Biotechnol. Vol. 13 (special issue on Innovations in information Embedded and Communication Systems) Pp. 174 - 177 (2016)
recombination and produces the trial vector. Finally, the trial vector is selected for the next emerging generation if it yields a reduction in the value of the objective function as shown in flow chart of DE in Figure 8.This last operator is referred to as a selection. For a given specific problem to solve, the input to the DE is a set of potential solutions to that problem, encoded in some manner. And a mathematical function called a fitness function that permits each candidate to be quantitatively evaluated. The main objective of Differential feature selection stage is to reduce the dimensionality of the problem before the supervised neural network classification process. Among the many wrapper algorithms used, DE, which solves optimization problems using the methods of evolution, has proved as a promising one. DE evaluates each individuals fitness as well as the quality of the solution. DE reduces the size of population by mimicking the evolution process of living beings. These reduced feature are given as input for the Neural Network so that its convergence speed and final accuracy can be increased. The re-sampled each ECG beat consists of 200 samples/ beat. Instead of using morphological feature extra-ction techniques, in this paper DE is used as the feature extraction technique. By using DE the ECG beat features are optimized to 20 features.
Fig. 6. ECG R peak detection
Fig. 7. ECG beat segmentation
III. Differential Evolution The Genetic algorithm [10] must search large space in order to obtain global minimum. It must take large initial random population and has to iterate through number of generations for fast convergence. So the disadvantage of Genetic algorithm is it requires lot of computational time. Differential Evolution includes the following features: 1. It can find global minimum without trapping into local inimum. 2. It has fast convergence. 3. It requires minimum parameters to control. 4. It can handle parallel computation. As given in the flow-chart of Figure 8, in DE a population of possible solutions within an n-di mensional space, a fixed number of vectors are randomly generated, then emerged over time to explore the entire search space and to locate the minimum of the (objective function) is called a generation. The new vectors are generated by the some mathematical combination of vectors randomly taken from the current population (muttion). Then the outcoming vectors are then mixed with predefined target vector. This operation is called
Fig. 8. DE flowchart
The DE gives optimized features(best features) for the classification. ECG beat features before optimization=[1 2 3 ......200]; Optimized features using DE = [41 14 198 17 189 139 22 81 177 1 171 82 134 40 49 38 80 86 129 138]; IV. Classification Results DE and PSO Features are classified using LM NN classifier and the results are shown in the Table II. In the training multi layer NN was applied, and checked the network performance and decide
176
Pak. J. Biotechnol. Vol. 13 (special issue on Innovations in information Embedded and Communication Systems) Pp. 174 - 177 (2016)
if any changes to be made to the training process, or the data sets, the network architecture. First check the training record, ’trainlm’ Matlab function as shown in Fig. 9]. TABLE II Classification results Classifier Sensitivity Specificity Accuracy PSO+SCG 83.9% 61.2% 77.9% 93.1% 60.8% 84.7% PSO+LM NN 86.4% 100% 94.07% DE+SCG NN 98% 99.1% DE+SCG NN 96.97%
[3] Back, T., Evolutionary algorithms in theory and practice: Evolution strategies, evol. programming. Proc. Genetic Algorithms, London, U.K.: Oxford Univ. Press (1996). [4] Hsin, H.C., C. C. Li, M. Sun and R. J. Sclabassi, An adaptive training algorithm for back propagation neural,networks. IEEE Trans. Syst., Man, Cybern. 25(3): 512-514 (1995). [5] Eberhart, R.C. and J. Kennedy, A new optimizer using particle swarm theory. Proc. ISMMH S. Pp. 39-43 (995). [6] Schamroth, L., An introduction to electrocardiography, Academic Medicine 39(10): 977 (1964). [7] Padmavathi Kora and K. Sri Rama Krishna, Hybrid Firefly and Particle Swarm Optimization algo -rithm for the detection of Bundle Branch Block. International Journal of Cardiovascular Academy 1(2): 44-48 (2016). [8] Soleimani, Hamed and Govindan Kannan. A Hybrid Particle Swarm Optimization and Genetic Algorithm for Closed-Loop Supply Chain Net work Design in large-scale networks. Applied Mathe -matical Modeling 39(14) 3990-4012 (2014). [9] Padmavathi Kora and K. Sri Rama Krishna, Hybrid Bacterial Foraging and Particle Swarm Opti
-mization for Detecting Bundle Branch Block.
Kora and Kalva SpringerPlus 4(81):1-19 (2015). [10] Padmavathi Kora and K. Sri Rama Krishna, Bundle Block Detetion using Genetic Neural Networks. Advances in Intelligent Systems and Computing 434: 309-317 (2016). [11] Padmavathi Kora and K. Sri Rama Krishna, Classification Bundle Block Detection Using Magnitude Squared Coherence. ARPN Journal of Engineering and Applied Sciences ARPN, 10(14): 5984-5989 (2015). [12] Padmavathi Kora and K. Sri Rama Krishna, Myocardial Infarction detection using DSKC 67 13. International Journal of Applied Engineering Research 10(1): 2137-2148 (2015). [13] Padmavathi Kora and K. Sri Rama Krishna, Classification of ECG signal during Atrial Fibrillation using Autoregressive modeling. International Conference on Information and Communication Technologies (ICICT2014) 46: 53 - 59 ( 2015). [14] Padmavathi Kora and K.Sri Rama Krishna, Myocardial Infarction detection using Magnitude Squ - ared Coherence and Support Vector Machine. International Conference on Medical Imaging, mHealth and Emerging Communi-cation Systems (MedCom), IEEE, Pp. 382-385 (2014). [15] Padmavathi Kora and K. Sri Rama Krishna, Detection of Atrial Fibrillation using Autoregressive modeling.International Journal of Electrical and Computer Engineering (IJECE) 5(1): 64-70 (2015).
Fig. 9. Neural network training with training
V. Conclusion The morphology of ECG changes due to the abnormalities in the heart. The data has been collected from the Physionet arrhythmia data base consisting 48 half channel ambulatory ECG recordings obtained from 47 individuals. From the arrhythmia data base 3 LBBB and 3 RBBB files of duration of 30 minutes at 360 Hz sampling rate have been used. The proposed DE is compared to PSO algorithm. The classification accuracy by the DE with LMNN was 99.1% for the detection of BBB. The proposed results have shown that the DE method can extract more relevant features than the other methods in the literature with highest classification accuracy for the detection of BBB. References [1] R. Mark and G. Moody, MIT-BIH Arrhythmia
Database, May. 1997. [Online]. Available http://ecg.mit.edu/dbinfo.html. [2] Melgani,F. and Y.Bazi, Classification of Electrocardiogram Signals With Support Vector Machines and Particle Swarm Optimization. IEEE Transactions on I nformation Technology in Biomedicine 12(5): 667-677 (2008)
177