remote sensing Article
Capturing the Diversity of Deprived Areas with Image-Based Features: The Case of Mumbai Monika Kuffer 1, *, Karin Pfeffer 2 , Richard Sliuzas 1 , Isa Baud 2 and Martin van Maarseveen 1 1 2
*
Faculty of Geo-Information Science and Earth Observation (ITC), University of Twente, P.O. Box 217, 7500 AE Enschede, The Netherlands;
[email protected] (R.S.);
[email protected] (M.v.M.) Faculty of Social and Behavioural Sciences, University of Amsterdam, P.O. Box 15629, 1001 NC Amsterdam, The Netherlands;
[email protected] (K.P.);
[email protected] (I.B.) Correspondence:
[email protected]; Tel.: +31-534-874 (ext. 301)
Academic Editors: Bailang Yu and Prasad S. Thenkabail Received: 1 February 2017; Accepted: 13 April 2017; Published: 19 April 2017
Abstract: Many cities in the Global South are facing rapid population and slum growth, but lack detailed information to target these issues. Frequently, municipal datasets on such areas do not keep up with such dynamics, with data that are incomplete, inconsistent, and outdated. Aggregated census-based statistics refer to large and heterogeneous areas, hiding internal spatial differences. In recent years, several remote sensing studies developed methods for mapping slums; however, few studies focused on their diversity. To address this shortcoming, this study analyzes the capacity of very high resolution (VHR) imagery and image processing methods to map locally specific types of deprived areas, applied to the city of Mumbai, India. We analyze spatial, spectral, and textural characteristics of deprived areas, using a WorldView-2 imagery combined with auxiliary spatial data, a random forest classifier, and logistic regression modeling. In addition, image segmentation is used to aggregate results to homogenous urban patches (HUPs). The resulting typology of deprived areas obtains a classification accuracy of 79% for four deprived types and one formal built-up class. The research successfully demonstrates how image-based proxies from VHR imagery can help extract spatial information on the diversity and cross-boundary clusters of deprivation to inform strategic urban management. Keywords: deprivation; slum; informal settlement; urban remote sensing; logistic regression; random forest classifier; Mumbai
1. Introduction Official maps often omit the existence of deprived areas [1] or declare them to be homogeneous [2,3]. However, deprived areas generally differ in their histories, their morphologies, services, socioeconomic, conditions and tenure (ranging from pavement dwellers and large slum areas to deprived resettlement colonies). Finding reliable information on deprived areas is a complex problem, as illustrated by population estimates in the large Mumbai slum Dharavi, which, according to [4], range from 300,000 to 900,000 inhabitants. Furthermore, deprivation mapping is often carried out at the administrative ward level (c.f. [5,6]), hiding spatial differences within wards and clustering across ward boundaries. This is a particular problem if wards are rather large, as is the case of the health wards in Mumbai (of which there were 88 at the time of the 2001 Census, with an average population of 136,000). In the 2011 Census data, the metropolitan area of Mumbai is divided into 24 administrative wards, with populations ranging from 127,290 (city [7]) to 941,366 people (suburban [8]). Linking and integrating spatially detailed information on slums to such large and aggregated spatial units is a problem [9], thus even when data on slums are available they are often not used as useful spatial relationships cannot be built. Remote Sens. 2017, 9, 384; doi:10.3390/rs9040384
www.mdpi.com/journal/remotesensing
Remote Sens. 2017, 9, 384
2 of 23
Very high resolution (VHR) remote sensing imagery has become a valuable information source regarding urban morphologies [10–13], “providing spatially disaggregated data in a more timely fashion for urban planning processes” [14] (p. 2) compared to traditional ground-based surveys [15]. The utility of VHR imagery covering large areas is particularly relevant for complex megacities with rapid changes. With respect to the megacity of Mumbai, several studies have shown the potential of VHR imagery to map urban land uses (e.g., [16]), and particularly deprived areas (e.g., [4,15,17–19]) that house a large share of the population. Nevertheless, to date, little research has quantified their specific morphological characteristics. A first attempt by [4], measuring morphological characteristics of slums in Mumbai, showed them to have similar characteristics in terms of high densities, building size, and height, but stressed their heterogeneous morphological characteristics. However, they did not focus on typologies of deprivation. A recent review of slum mapping via remote sensing [20] revealed a range of methods and image features, e.g., object-based image analysis (OBIA), grey-level co-occurrence matrix (GLCM), and spatial metrics, where [21,22] showed the effectiveness of index-based approaches to reduce feature dimensionality for urban mapping. OBIA allows the extraction of roof objects as well as the extraction of homogeneous settlements depending on the way the scale parameters are set [23]. Homogenous settlements are also referred to as homogenous urban patches (HUP), following [24]. However, the capacity to automatically extract roof objects depends on the image resolution and urban morphology, which is challenging in many Asian cities, where often large areas of relatively small buildings display high clustering [20,25]. Several remote sensing studies have extracted slum settlements (or slum HUPs) (e.g., [17,23]). These studies used typical morphological characteristics of deprived areas (i.e., small building sizes, high densities, and organic layout pattern), allowing their mapping via image features (spectral, texture, or spatial metrics). Spectral information assists in differentiating typical roofing materials between deprived and other built-up areas. However, the use of different roofing materials, ranging from plastic, wood and metal to concrete and asbestos, makes mapping relying on spectral information alone problematic. An alternative is employing the GLCM, which calculates several textural measures within a user-defined window size and shift [26]. Previous studies employing GLCM-derived texture measures for mapping deprived areas include contrast [23,27], entropy [28,29], and variance [17,30]. Spatial metrics are increasingly used to analyze and quantify the urban morphology (e.g., [15,31,32]), where [23] showed the utility of combining both texture and spatial metrics for extracting slums in Pune (India), but also illustrated uncertainties in slum identification [33]. However, they did consider slums a ‘homogeneous zone’, while uncertainties might also be caused by different types of deprived areas. Therefore, the aim of this paper is to analyze the capacity of VHR imagery and image processing methods to map locally specific types of deprived areas in Mumbai, which can help in analyzing their diversity and clustering. The structure of the paper is as follows. Section 2 develops a framework for analyzing the diversity of deprived areas in VHR images. Section 3 describes the methodology to create a typology of deprived areas. In Section 4, a random forest classifier and logistic regression (LR) model are employed using VHR imagery to model deprived areas. The output provides significant image features of the LR model and an accuracy assessment. In Section 5, we discuss the main findings and the application relevance followed by conclusions on the scope, capacities and limitations for extracting such typologies from VHR imagery. 2. The Diversity of Deprived Areas Literature on the diversity of deprived areas was utilized to conceptualize determinants that drive variations in their morphology, as well as variations in categorizing their morphology. Such conceptual information is key to establishing a typology of deprived areas for a particular geographic context, in this case the city of Mumbai.
Remote Sens. 2017, 9, 384
3 of 23
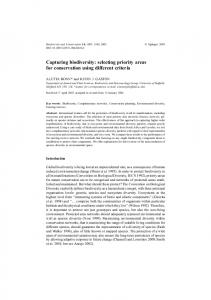
2.1. Conceptualizing Deprivation Unlike classical concepts of poverty that focus on income and consumption, the term “deprivation” is often used in understanding poverty as a multi-dimensional phenomenon, applied for example in the index of multiple deprivation [34]. Deprived areas, similar to ‘slums’ or ‘informal settlements’, refer to areas with sub-standard housing conditions and poor physical and environmental conditions offering housing to predominantly poor people [23]. They may also include areas that have been formally developed (e.g., resettlement colonies) but have slum-like living conditions [5]. Inhabitants of such areas are commonly deprived of access to basic services and live in overcrowded and unsafe environments. The official definitions of deprived areas and the terminology used to refer to such areas vary by country, but also within countries or even localities, where various definitions and interests are commonly found [35]. Official slum definitions can be very political. The Indian census has three types of slums: ’notified’ (by the government under any Act), ‘recognized’ (areas not formally notified but recognized by the government), and ‘identified’ (areas of at least 300 people or 60–70 households that live in congested and unhygienic environments, lack basic services, and need to be visited and registered by a Charge Officer) [36]. Notified and non-notified slums differ in the level of service provision, as for notified slums the local government has the obligation of basic service provision and upgrading [37]. Because of this, in India, often a large proportion of deprived areas are excluded from basic service provision and upgrading as they lack notification (e.g., pavement dwellers), or city governments have simply stopped notification processes [38]. According to the census of 2001 and 2011, the urban slum population in India decreased from 26.3% [39] to 17.4% [36], suggesting the success of policy initiatives such as Basic Services for the Urban Poor (part of the Jawaharlal Nehru National Urban Renewal Mission; [40]). However, the real extent of deprived areas might be concealed by such statistics as they exclude several types of deprived areas (e.g., pavement dwellers and resettlement colonies) [36,38]. Administrative boundaries of wards have also often changed, and, furthermore, the average deprivation per ward (e.g., via a deprivation index [6]) may mask slum areas. Slums, and deprived areas in general, are “more heterogeneous than is often assumed” [38] (p. 60). UN-Habitat [41] analyzed the vast diversity of slum types for 30 cities in the Global South and North. We categorize their typology into a concept of deprived areas around three main determinants (Figure 1). As shown in Figure 1, first, deprived areas differ in terms of object types, for example, housing types range from pavement dwellings (using locally available material) to multi-story housing or the occupation of dilapidated (historic) buildings. Second, land and site characteristics such as reserves on public land (e.g., along roads or railways), small encroachments between formal areas or illegal subdivisions on agricultural land, which can have very regular patterns, result in different types of deprived areas differing in location, size, densities and access to services. Third, temporal dynamics and the history of areas determine the typology (e.g., chawls in Mumbai developed mainly in the early 20th century as 3–5-story housing for textile and other industrial workers). Patterns of settlements differ when areas are developed by collective and organized occupation, such as the organized land invasion in Latin America (e.g., in Lima, where several thousand people invaded land within one day [42]), compared to areas incrementally developed by individual households. Having conceptualized the determinants that produce the diversity of deprived areas, we explore how this diversity was recognized in previous remote sensing studies (Table 1). Table 1 provides examples of studies in the field of remote sensing, differentiating types of deprived areas, which we extracted from a literature search (using Science Direct, Web of Science, and Scopus). All these initiatives departed from the idea of deprived areas being homogenous, stressing that such areas differ among themselves as well as differ from formal urban areas. The identified typologies range from two to seven categories and reflect the complexity and diversity of such areas across the globe. In some cities, the land/site characteristics have a strong determining influence, as noted for Cairo, where differences between developments on former agricultural land are structured by the farm boundaries,
Remote Sens. Sens. 2017, Remote 2017, 9, 9, 384 384
44 of of 22 23
farm boundaries, while those on desert land have a less orderly morphology. Several typologies also while those on or desert land have a less orderlyinformal morphology. Severalareas typologies also include low-cost fuzzy or include fuzzy transition classes between and formal (i.e., semi-formal transition classes between informal and formal areas (i.e., semi-formal low-cost housing, hybrid, or housing, hybrid, or ex-formal on public or private land) or formal but deprived areas (i.e., basic ex-formalBy oncontrast, public or[43] private land) or formal butareas deprived (i.e., basic formal). By contrast, [43] formal). showed that informal mightareas not be deprived (i.e., affluent informal showed that and informal might not targets be deprived (i.e., affluent informal settlements), and on might settlements), mightareas not be relevant for pro-poor policies. Thus, having spatial data the not be relevant targets for pro-poor policies. Thus, having spatial data on the combinations of such combinations of such characteristics would allow for a better understanding of the spatial diversity characteristics allow offer for a better of the spatial of deprivation and of deprivation would and would specificunderstanding information useful for the diversity development of upgrading would offer specific information useful for the development of upgrading programs. programs.
Figure 1. Determinants Determinantsofofthe thetypology typology deprived areas (conceptualized based onUN-Habitat, the UN-Habitat, Figure 1. of of deprived areas (conceptualized based on the 2003). 2003).
2.2. Deprived Areas in Mumbai: A Typology 2.2. Deprived Areas in Mumbai: A Typology Deprived areas in Mumbai are diverse in terms of their physical characteristics [2,41], which Deprived areas in Mumbai are diverse in terms of density, their physical characteristics [2,41], (Figure which we we conceptualize utilizing the dimensions geometry, pattern, and environment 2). conceptualize utilizing the dimensions geometry, density, pattern, and environment (Figure 2). In an In an earlier study [14], we developed a typology of deprived areas for Mumbai using VHR imagery. earlier study [14], we developed a typology deprived areas for fieldwork Mumbai using VHR imagery. That That typology included five types (Table 1),of established through surveys and discussions typology included five types (Table 1), established through fieldwork surveys and discussions with with local experts. Their morphological characteristics can be associated with information extracted local Their morphological characteristics be associated with information extracted from from experts. spectral image analysis, texture analysis, andcan spatial metrics. This research utilizes this typology spectral image analysis, texture analysis, and spatial metrics. This research utilizes this typology for for mapping deprivation, but since the transition between the types ‘deprived areas with larger mapping deprivation, but since the transition between the types ‘deprived areas with larger buildings/chawls’ and ‘basic formal areas’ is ambiguous, these two types are combined. This results buildings/chawls’ andone ‘basic formal is (Figure ambiguous, thesespecific two types are combined. This results in four deprived and formal typeareas’ of area 2) whose dimensions are translated into in four deprived and one formal type of area (Figure 2) whose specific dimensions are translated into image features, allowing them to be mapped. image features, allowing them to be mapped.
Remote Sens. 2017, 9, 384
5 of 23
Table 1. Typologies of deprived/informal/slum areas and their categories, modified from [20] and their determinants (O = object types, L = land/site characteristics, T = temporal dynamics) (check marks: x = dominant) (x) = weak. Determinants No. 2
2
Categories
O
L
T
• •
Semi-formal low-cost housing Slums
Quezon City (Philippines) [44]
x
x
•
Type I: small to medium-sized buildings, narrow/irregular streets Type II: very small buildings and high building density, unidentifiable roads
Caracas (Venezuela), Kabul, Kandahar (Afghanistan), La Paz (Bolivia) [10]
x
x
Classical informal settlements: irregular layout, small roofs, and high density Atypical informal settlements: some regular patterns, less compact, even-sized roofs
Nairobi (Kenya) [45]
x
x
x
x
(x)
(x)
x
x
•
• 2
Location and Author(s)
•
3
• • •
Informal A (squatter settlements), Informal B (precarious encroachments) Basic formal areas (often resettlement colonies)
Delhi (India) [15]
3
• • •
Semi-formal on agricultural land Squatting in desert land Hybrid or ex-formal on public or private land
Cairo and Alexandria (Egypt) (distinguished further into 12 subtypes) [46]
3
• • •
Affluent informal settlements Moderate informal settlements Disadvantaged informal settlements
African cities [43]
x
x
3
• • •
Informal settlements on former agricultural land Informal areas on former desert state land Deteriorated historic core
Cairo (Egypt) [47]
x
x
x
4
• • • •
Resettlement colonies Unauthorized colonies JJ-colonies (Jhuggi Jhompri) Urban villages
Delhi (India) [48]
x
x
x
4
• • • •
Very low-income settlements Low-income settlements Temporary settlements Notified and recognized slums
Bangalore (India) [49]
x
x
x
• •
Dar es Salaam (Tanzania) by [50]
x
x
•
Informal settlements with regular grid Transport infrastructure pattern adopted informal settlement Informal settlements with concentric circular pattern around the utilities or urban features Terrain topography adopted informal settlements
5
• • • • •
Slum pockets Slum areas with small buildings Slum areas with mix small/large buildings Slum areas with larger buildings/chawls Basic formal areas
Mumbai (India) [14]
x
x
7
• • • • • • •
Grid outline of regular slums Grid outline of irregular slums Slums adapted to the terrain topography Slums with a central corridor Radial-shaped slums Slums with platform occupation (terraces) Slums occupying the hill flat heads
East London (South Africa), Salvador de Bahia (Brazil) and Lima (Peru) [51]
4
•
x
(x)
Remote Sens. Sens. 2017, Remote 2017, 9, 9, 384 384
TYPE 1 TYPE 1
66 of of 22 23
TYPE 2 TYPE 2
Slum Slum pocket * pocket *
Slum area, small Slum area, small buildings (slum small *)
TYPE 3 TYPE 3
TYPE 4 TYPE 4
TYPE 5 TYPE 5
Slum area, mix small/larger Basic formal and chawl Formal areas Slum area, mix small/larger Basic formal and chawl Formal areas (formal *) buildings (slum mix *) (basic/chawl *) (formal *)
buildings (slum small *) buildings (slum mix *) (basic/chawl *) Geometry: Small roofs Geometry: Small roofs Geometry: Small–medium roofs Geometry: Medium roofs Geometry: Large roofs Geometry: Small roofs Geometry: Small roofs Geometry: Small–medium Geometry: Medium roofs Geometry: Large roofs Density: High Density: High Density: Mix Density: High-medium Density: Medium - low Density: High Density: High roofs Density: High-medium Density: Medium - low Pattern: Organic Pattern: Organic Pattern: Diverse Pattern: Some structure Pattern: Well structured Pattern: Organic Pattern: Organic Density: Mix Pattern: Some structure Pattern: Well structured Environment: Pockets alongalong Environment: Large areas Some areas in more Environment: Environment: Environment: Pockets Environment: Large areas Environment: Pattern: Diverse Environment: Little Little Environment: Higher Higher roads or within formal areasareas withwith diverse uses elevated terrainSome areas in vegetation vegetation roads or within formal diverse uses Environment: vegetation within within areas areas vegetation cover cover more elevated terrain
Figure 2. Typology of deprived areas and their dimensions (ground photo in 2009) (* label used). Figure 2. Typology of deprived areas and their dimensions (ground photo in 2009) (* label used).
Our typology (Figure 2) ranges from slum pockets/encroachments (e.g., pavement dwellings) typology (Figure 2) ranges slumaspockets/encroachments dwellings) alongOur physical infrastructure (Figurefrom 3) such highways, pipelines, or(e.g., the pavement airport area to more along physical infrastructure (Figure 3) such as highways, or the airport areaand to more regular and well-maintained areas with houses of severalpipelines, floors with proper paths open regular spaces and well-maintained areas with houses of several floors with proper paths and open spaces between between the houses. Type 1, slum pockets, are often temporary areas along the transport network or the houses. Typeformal 1, slum pockets, are often temporary along very the transport network ora‘islands’ ‘islands’ within areas, displaying poor housingareas structures, high densities, and lack of within formal areas, displaying poor housing structures, very high densities, and a lack of access to basic service provision. The second type concerns long-established and often access large to basic service secondsmall type concerns long-established often them. large settlements settlements withprovision. very highThe densities, houses, and narrow lanes and between Such areas with very high houses, and lanes between them. drainage Such areas commonly lack commonly lackdensities, access to small basic services suchnarrow as piped water or a closed system. The third access to basic services such as piped water or a closed drainage system. The third type (Figure 4) type (Figure 4) has mixed housing sizes including slightly larger houses of 1–2 floors, though often has mixed housing sizes including slightly larger houses of 1–2 floors, though often in irregular in irregular arrangements with somewhat larger paths between the houses, still leaving very little arrangements somewhat largerhigh paths between thefew houses, leaving veryand littlespaces space are between space betweenwith the houses. Despite densities and openstill spaces, houses often the houses. Despite high densities and few open spaces, houses and spaces are often rather clean and rather clean and well-maintained. Frequently, some basic infrastructure is present. The fourth type well-maintained. Frequently, some infrastructure fourth consists of aorgradual consists of a gradual transition of basic deprived informal istopresent. formal The areas withtype medium-sized larger transition of deprived informal to formal areas with medium-sized or larger buildings (e.g., chawls buildings (e.g., chawls built for textile workers), and settlements with wider paths and streets as well built forbut textile workers), and settlements with wider paths and streets well as open but to limited as open limited green spaces (e.g., resettlement colonies). These areasas mostly have access basic green spaces (e.g., resettlement colonies). These areas mostly have access to basic infrastructure. infrastructure. Besides the of of deprived areas, formal areasareas are classified separately to analyze Besides thefour fourtypes types deprived areas, formal are classified separately to whether analyze deprived areas differ from this type. Formal built-up areas are rather heterogeneous, but display whether deprived areas differ from this type. Formal built-up areas are rather heterogeneous, but a relatively regular building larger building sizes, more vegetation cover, and commonly display a relatively regularlayout, building layout, larger building sizes, more vegetation cover, have and lower built-up densities. four deprived be deprived relatively well from formal commonly have lower The built-up densities.types The can four typesdistinguished can be relatively well areas via the GLCM variance [17].via the GLCM variance [17]. distinguished from formal areas
Figure 3. Deprived area in Mumbai along a road (ground photo in 2009). Figure 3. Deprived area in Mumbai along a road (ground photo in 2009).
Remote Sens. 2017, 9, 384
7 of 23
Remote Sens. 2017, 9, 384
7 of 22
Figure 4. Deprived area in Mumbai climbing up a steep slope (ground photo in 2009). Figure 4. Deprived area in Mumbai climbing up a steep slope (ground photo in 2009).
3. Materials and Methods 3. Materials and Methods The main approach used in this study to map the diversity of physical deprivation (Figure 2) at The main approach used in this study to map the diversity of physical deprivation (Figure 2) at the spatial level of HUPs combines VHR imageries with available spatial data. The spatial the spatial level of HUPs combines VHR imageries with available spatial data. The spatial aggregation aggregation to HUPs is done via image segmentation, creating homogenous areas. For producing a to HUPs is done via image segmentation, creating homogenous areas. For producing a typology of typology of deprivation, both a random forest classifier and LR modeling are employed. Details on deprivation, both a random forest classifier and LR modeling are employed. Details on the study the study context, data, and methods are described in the following sub-sections. context, data, and methods are described in the following sub-sections. 3.1. Study and Available Available Dataset Dataset 3.1. Study Area Area Context Context and The study studyarea areaisisthe the city of Mumbai, India, which a present population of12.4 about 12.4 The city of Mumbai, India, which has ahas present population of about million, million, with about 41.8% living in slums [52]. For this research, eight scenes of WorldView-2 images with about 41.8% living in slums [52]. For this research, eight scenes of WorldView-2 images (PAN: (PAN: MS: 2 m) acquired in 2009 have been provided by DigitalGlobe, covering area 2. 0.5 and0.5 MS:and 2 m) acquired in 2009 have been provided by DigitalGlobe, covering an area of an 81.34 kmof 2 81.34 km . The scenes are combined into one image mosaic covering a part of the city of Mumbai The scenes are combined into one image mosaic covering a part of the city of Mumbai (Figure 5). (Figure 5). image data, several GIS layers from OpenStreetMap (downloaded in 2010 after we had Besides Besides image data, layers fromand OpenStreetMap (downloaded in 2010 after in we2016: had received the images) (e.g.,several water GIS bodies, roads) the SRTM DEM via USGS (downloaded received the images) (e.g., water bodies, roads) and the SRTM DEM via USGS (downloaded in 2016: version: 1 arc-second) are used. Moreover, the index of multiple deprivation (IMD) based on various version: 1from arc-second) are used. Moreover, the index (IMD) baseddeprivation on various statistics the Indian census of 2001 (Figure 5) of is multiple availabledeprivation [6]. It maps multiple statistics from the Indian census 2001of(Figure is available multiple deprivation experienced within Mumbai at theoflevel health 5) wards. For the[6]. cityItofmaps Mumbai, the IMD ranges experienced within Mumbai at the level of health wards. For the city of Mumbai, the IMD from 0.22 for the least deprived ward up to 0.44 for the most deprived ward (range 0–1). Aranges ward from 0.22 for the least deprived ward up to 0.44 for the most deprived ward (range 0–1). A ward with a hypothetical value 0 would imply a fully planned upper-middle class area, without deprived with a hypothetical value 0 would imply a fully planned upper-middle class area, without deprived households, while a ward with a value of 1 would mean that all households in the entire ward are households, while a ward with a value of 1 would mean that all households in the entire ward are deprived in all aspects (i.e., have no access to sanitation, water, electricity, education, bank accounts, deprived in all aspects (i.e., have no access to sanitation, water, electricity, education, bank accounts, or scooters; live in overcrowded dwellings; are unemployed; and are all members of a scheduled or scooters; live in overcrowded dwellings; are unemployed; and are all members of a scheduled caste) [6]. The temporal inconsistency of the index and imagery is discussed in Section 3.4.3. Although caste) [6]. The temporal inconsistency of the index and imagery is discussed in Section 3.4.3. only 17 out of 88 health wards are covered by the images, the area has a good mix of the full range of Although only 17 out of 88 health wards are covered by the images, the area has a good mix of the the IMD (Figure 5). full range of the IMD (Figure 5). For developing the LR model, aimed at mapping the typology of deprivation, 94 ground-truth For developing the LR model, aimed at mapping the typology of deprivation, 94 ground-truth points (training sample) are available from fieldwork undertaken in 2011 and 2013. For accuracy points (training sample) are available from fieldwork undertaken in 2011 and 2013. For accuracy assessment, an additional 170 ground-truth points were collected within three subunits through assessment, an additional 170 ground-truth points were collected within three subunits through fieldwork in 2015 for another study [53], which we could use for this study as reference (test sample). fieldwork in 2015 for another study [53], which we could use for this study as reference (test sample). The two ground-truth sets are not combined because the training set covers the entire study area, The two ground-truth sets are not combined because the training set covers the entire study area, while the test set focuses on three subunits. All ground-truth data were collected as point data and while the test set focuses on three subunits. All ground-truth data were collected as point data and recorded the dominant built-up type in the immediate surroundings. To overcome problems with recorded the dominant built-up type in the immediate surroundings. To overcome problems with temporal inconsistency between image and ground-truth (test) data, a visual inspection of the points temporal inconsistency between image and ground-truth (test) data, a visual inspection of the points was performed, comparing the imagery from 2009 with Google Earth images from 2015; as a result, was performed, comparing the imagery from 2009 with Google Earth images from 2015; as a result, four points were removed for having obvious land cover/use changes. The random selection of points four points were removed for having obvious land cover/use changes. The random selection of within deprived areas led to an unequal distribution of points across the types of deprived areas. points within deprived areas led to an unequal distribution of points across the types of deprived As a result, the types ‘slum small’ and ‘formal’ are overrepresented. areas. As a result, the types ‘slum small’ and ‘formal’ are overrepresented.
Remote Sens. 2017, 9, 384 Remote Sens. 2017, 9, 384 Remote Sens. 2017, 9, 384
8 of 22 8 of 23 8 of 22
classified byby levels of deprivation (left;(left; highhigh values indicate high Figure 5. Health Healthwards wardsofofMumbai, Mumbai, classified levels of deprivation values indicate Figure 5. Health wards of Mumbai, classified by levels of deprivation (left; high values indicate high deprivation; Source: [6]) [6]) and and image mosaic covering a central high deprivation; Source: image mosaic covering a centralpart partofofMumbai Mumbai (right; (right; Source: deprivation; DigitalGlobe).Source: [6]) and image mosaic covering a central part of Mumbai (right; Source: DigitalGlobe).
3.2. Methodology—Mapping the Diversity of Deprived Areas Areas 3.2. Methodology—Mapping the Diversity of Deprived Areas The methodology methodologytotomap map diversity of deprived consists of (1) extracting image The thethe diversity of deprived areas areas consists of (1) extracting image features, The methodology to map the diversity of deprived areas consists of (1) extracting image features, (2) analyzing the significance of image feature, and (3) extracting different types of (2) analyzing the significance of image feature, and (3) extracting different types of deprived areas, features, (2) analyzing the significance of image feature, and (3) extracting different types of deprived areas, presented in Figure 6. presented in Figure 6. deprived areas, presented in Figure 6.
Figure 6. 6. Methodology—mapping diversity of of deprived deprived areas areas in in Mumbai. Mumbai. Figure Methodology—mapping diversity Figure 6. Methodology—mapping diversity of deprived areas in Mumbai.
First, to extract image features, the basic land cover/use classes (built-up (deprived and formal), First, to to extract extract image image features, features, the basic cover/use classes classes (built-up (deprived (deprived and and formal), formal), First, basic land land vegetation, water, soil, road, and the shadow) are cover/use mapped using a(built-up RF classifier, employing our vegetation, water, soil, road, and shadow) are mapped using a RF classifier, employing our parameter vegetation, water, soil, road, and shadow) are mapped using a RF classifier, employing our parameter setting of a previous study on Mumbai [17]. The NDVI (normalized difference vegetation setting of asetting previousastudy on Mumbai The[17]. NDVI difference vegetation index), parameter previous study on [17]. Mumbai The(normalized NDVI (normalized difference vegetation index), edges and of GLCM texture measures (variance, contrast, homogeneity, entropy, dissimilarity, edges and GLCM texturetexture measures (variance, contrast, homogeneity, entropy, dissimilarity, and index), edges and GLCM measures (variance, contrast, homogeneity, dissimilarity, and second-moment mean) are extracted using the WorldView images. Forentropy, the extraction of the and second-moment mean) are extracted using the WorldView images. For the extraction of the
Remote Sens. 2017, 9, 384
9 of 23
second-moment mean) are extracted using the WorldView images. For the extraction of the GLCM we used a window size of 21 × 21 pixels, which was optimized in a previous study on the same image [17]. The result of the land cover/use classification showing the built-up classes (deprived and formal) having an overall pixel-based accuracy of 90% with a Kappa of 0.87 (for details see [17]), are used to calculate several spatial metrics with the potential to describe aggregation (AI), shape (FRAC, SHAPE), density (PD), and homogeneity (SHDI and SHE) conditions in deprived areas. The rationale for the selection of features to map deprivation is provided in Section 3.3. The selected set of metrics [54] consists of:
•
Aggregation index AI = (
•
gii )(100) max → gii
Fractal dimension 2 ln(0.25pij ) ln aij
(2)
ni (10000)(100) A
(3)
FRAC =
•
Patch density PD =
•
Shape index SHAPE =
•
(1)
pij minpij
(4)
Shannon’s diversity index m
∑ ( Pi ∗ ln Pi )
(5)
−∑im=1 ( P i ∗lnPi ) ln m
(6)
SHDI =
i =1
•
Shannon’s evenness index SHEI =
where AI: gii = number of like adjacencies, max→gii = maximum number of like adjacencies; FRAC: pij = perimeter (m) of patch ij, aij = area (m2 ) of patch ij; PD: m = number of patch types, A = total landscape area (m2 ); SHAPE: pij = perimeter of patch ij, min pij = minimum perimeter of patch ij; SHDI/SHEI: Pi = proportion of the landscape of class I, and m = number of classes. In this study, HUPs are the main spatial analysis unit for aggregating pixel-based information. They are areas of both homogenous textural and spectral characteristics, e.g., representing formal areas or deprived neighborhood types. HUPs, as defined by Liu, Clarke and Herold [24], (1) have homogenous texture; (2) consist of several land-cover types; (3) have matching physical boundaries; and (4) do not contain single objects and are sufficiently large. Thus HUPs are extracted via image segmentation using multi-resolution image segmentation employing the road network as thematic layer (to refine boundaries), with a scale parameter of 200, following our previous study in Mumbai [17]. However, the OSM road data have limitations in terms of consistent coverage in countries of the Global South [9]. In Mumbai, such inconsistencies exist in particular in slums. As a consequence, we did not use footpaths, which are only available for some slum areas (e.g., Dharavi). Second, the significance of the derived image features is analyzed. Therefore, all image features (e.g., based on spatial metrics, GLCM) are aggregated at HUPs and the training set of 94 ground-truth points is used to derive significant features that differentiate types of deprived areas (details are given in Section 3.4.1). Third, to extract the typology of deprivation, multiple regression modeling is used and the accuracy is assessed by a set of 166 test samples (details are given in Section 3.4.2).
Remote Sens. 2017, 9, 384
10 of 23
3.3. Extraction of Features to Map the Diversity of Deprivation Based on the four morphological dimensions of deprived areas in Mumbai, i.e., environment, density, geometry, and texture pattern (building on the earlier work of [4,15,22,25,55–57]), image features are created with the potential to capture the diversity of such areas (Figure 2). This list of image features (Figure 7) is generated based on distinguishing features reported in slum mapping studies (e.g., [4,10,22,23,56,58–60]), as well as by considering the local characteristics of deprived areas in Mumbai. Earlier studies [15,25] showed that deprived areas display diversity in terms of environmental (environ) features such as location on steep slope. Furthermore, land cover/use characteristics often vary among deprived areas; e.g., large and very densely built-up areas have little land cover/use heterogeneity (measured e.g., by SHDI and SHEI) while small slum pockets are often surrounded by vegetation or other land cover/use types. The patterns of deprived and formal areas show distinct differences, meaning that deprived areas commonly have more organic layouts and formal areas more regular ones. Yet, texture pattern differences exist among deprived areas, which can be measured by GLCM features. The geometry features explore object shape variations and arrangements (e.g., via AI, SHAPE, FRAC) [61]. Building layouts in deprived areas are often less complex and object sizes are small compared to formal areas. However, these features show variations, e.g., very small objects in areas of slum pockets compared to larger buildings in chawls or resettlement colonies, which can be very densely built-up. Thus density features also show variations among deprived areas, e.g., lower densities in areas of the type ‘slum mix’ compared to ‘slum small’. For a large number of features (e.g., GLCM, edge features) the panchromatic band of WorldView-2 imagery is used, while for some density, geometry and environment features, the results are derived from the random forest classification (land cover/use) of the WorldView-2 images (e.g., shadow, built-up). For calculating some of the geometry and environment features, spatial metrics is used. For line density, road network data from OSM are used, while topography features are derived from the SRTM DEM. The features are either calculated using a 21 × 21 window (e.g., GLCM) or are directly captured per HUP (e.g., slope). However, the features extracted via a window are also aggregated to HUPs using the mean feature values (each HUP receives 34 features values). To allow comparability of the features, they are normalized employing the method ‘0–1 scaling’. Remote Sens. 2017, 9, 384 23 of 23
Figure 7. Morphological dimensions of deprived areas and employed image features.
Remote Sens. 2017, 9, 384
11 of 23
3.4. Modeling the Typology of Deprivation To model the diversity of deprivation, two major steps are necessary (details are provided in Sections 3.4.1 and 3.4.2): first, the significant features are extracted; and second, they are used within a regression model to classify the HUPs. This is done in a stepwise process (Table 2) using the normalized features per HUP (Figure 7) to model the typology of deprivation. Thus first, a binary backward LR model (modeling the class probability), second, a multinomial LR model (assessing the separability of deprived types), and third, four binary LR models (extracting the probability values of HUPs belonging to one of the four deprived types) are set up. For all models, features at the 95% confidence interval are considered significant (p < 0.05); features below this level are considered not significant and are therefore not included. For building the LR models, the first set of ground truth (training) data is used. The result is a fuzzy classification; each HUP obtains probability values of all built-up types. However, for the final classification the class with the highest probability is selected. The steps to arrive at this final typology are detailed in the following sub-sections. Table 2. Overview of different logistic regression (LG) models. LR Models
Type
Classes
No. Classes
Input
Output LR model differentiating formal and deprived
1st model
Binary LG
Formal and deprived
2
All significant features
2nd model
Multiple LG
Slum pocket, slum small, slum mix, basic/chawl, formal
5
All significant features
List of features modeling deprived types
3rd model
Binary LG
Slum pocket, slum small, slum mix, basic/chawl, formal
2 (in 4 models)
All features of 2nd model
LR model classifying the typology of deprivation
3.4.1. Significance of Image Features Before employing the features within a regression analysis, their multi-collinearity is analyzed using the VIF (variable inflation factor) value, where values should be below 10 to avoid serious problems of multi-collinearity [62]. The commonly used VIF threshold value of 10 is used [62,63] (other sources suggest a value of 5 [64]). Considering that morphological features have a general tendency to correlate, the maximal threshold is selected. Thus only very highly correlating features are identified and excluded. Besides analyzing multi-collinearity, the means of all features of the built-up types (deprived and formal) are plotted. This allows us to analyze whether features show differences for the deprived types. Both the ability to differentiate between deprived types and multi-collinearity are used to arrive at a pre-selection of features to be entered into the regression model. This step is necessary as the number of training data points would not support the use of a very large set of variables (features). For the first model, a binary LR model, all deprived types are merged and tested to see whether deprived and formal HUPs can be easily differentiated. The model eliminates all non-significant features, thereby simplifying the calculation of the HUP probability. In addition, it provides classification accuracy and probability values of class memberships (Equation (7)), allowing us to classify all HUPs (also HUPs where no ground truth data is available). P(y) =
1 1 + e−(b0 +b1 x1i +b2 x2i +...+bn xni )
(7)
where P(y) is the probability of y occurring, e: natural logarithm base, b0 : interception at y-axis and b1 : line gradient. The result provides the classification of all formal HUPs. To avoid formal areas with larger vegetation cover being classified as vegetation HUPs, the classification rule allocates HUPs with a mix of vegetation and formal areas to formal areas when the vegetation cover is less than 60%. HUPs with more than 60% vegetation cover are classified as vegetation; however, such HUPs might still contain individual buildings.
Remote Sens. 2017, 9, 384
12 of 23
The second model, a multinomial LR model, assesses whether the features (Figure 7) are able to distinguish the different types of deprived areas. The result shows the significant features to be used for the third LR model and the resulting classification accuracies for the various types of deprived areas. 3.4.2. Extracting the Typology of Deprivation Employing a third LR model, the most significant features per deprived type are extracted by four binary backward LR models. The obtained coefficients and constants for the four deprived types are used to calculate the probability of each HUP to belong to a specific type using Equation (7). Each built-up HUP (using the result of the land cover/use classification) is classified in a vector environment according to the highest probability of the five built-up types. All other non-built-up HUPs are also classified using the result of the land cover/use classification; only roads and water bodies are derived from OSM. The strength of the model is assessed via the classification accuracy and Nagelkerke R2 . In a final step, the accuracy of the classification is assessed using the second set of 166 ground truth (test) data using the overall accuracy and Kappa. 3.4.3. Cross-Boundary Health Ward Clusters of Deprivation To illustrate the application potential of mapping the typology of deprivation, the results of the HUP-based deprivation map and the ward boundaries (including the index of multiple deprivation) are superimposed. Despite the temporal inconsistency of the data, this comparison illustrates the different aggregation levels of the datasets for a central area of Mumbai, where large areas have been relatively stable between 2001 and 2009 (the center was already in 2001 very densely built up, not allowing for much in the way of horizontal building dynamics). This comparison focuses on problems of aggregated administrative units for analyzing aspects of the urban morphology, as also illustrated in [12]. 4. Results In this section, we present the results of the stepwise process to extract the typology of deprived areas based on the most significant features. We also illustrate how such data can visualize clusters of deprivation across ward boundaries and show their diversity. 4.1. Analyzing the Correlation of Potential Features Both the ability to distinguish the five built-up types and the correlation of all 34 image features (Figure 7) are analyzed for all image features aggregated at the level of built-up HUPs. Many of the features highly correlate with several others. Therefore, the most correlating and least differing features are excluded from the selection. Mean feature values per built-up class are shown in Figure 8. For several features, formal areas show large differences with the deprived area types, e.g., ‘GLCM variance’, ‘built-up PD’ (patch density), ‘shadow and line density’, ‘shape index’ and ‘vegetation percentage’. However, for ‘GLCM entropy STD’, ‘built-up density’ and ‘mean built-up area’ formal areas and slum pockets have rather similar values. This seems rather surprising, but is caused by small slum pockets often being part of a larger HUP, which also contains non-built-up classes (e.g., soil) or in-between formal areas, while formal HUPs are often rather small because of the surrounding vegetation cover being part of a different HUP. This is also confirmed by the high ‘land cover/use (lc/u) evenness’ value of slum pockets, indicating that they have the highest mix of land cover/use classes. The largest ‘mean area’ is displayed by slum areas with small buildings; this type covers large areas across the study area. In general, slum areas with mixed building sizes are located at higher elevation (DEM min) and on steeper slopes (‘slope mean’). Basic formal areas and chawls have the ‘highest built-up densities’ and ‘GLCM second moment’, while having the lowest ‘shadow density’.
Remote Sens. 2017, 9, 384 Remote Sens. 2017, 9, 384
13 of 23 13 of 22
Figure8. 8. Mean Mean feature featurevalues valuesof oftraining trainingand andreference referencesamples. samples. Figure Table 3. VIF values of morphological features of deprived areas when analyzing multi-collinearity.
None of the 15 remaining features has a VIF value of more than 10 (critical value), but several Features VIF have more than 5, which still signals relatively high collinearity (Table Dimension 3). However, all features are Vegetation percentage 5.536 Environment entered into the LR model.
Land cover/use evenness 4.507 Environment Slope mean features of deprived 2.503 Environment Table 3. VIF values of morphological areas when analyzing multi-collinearity. DEM min 2.620 Environment GLCM entropy mean 5.695 Texture pattern Features VIF Dimension GLCM entropy STD 1.444 Texture pattern Vegetation percentage 5.536 Environment GLCM second moment mean 3.183 Texture pattern Land cover/use evenness 4.507 Environment GLCMSlope variance 5.372 Texture mean 2.503 Environment pattern Built-up aggregation 4.654 Geometry DEM min 2.620 Environment Shadow 1.274 Texture pattern Geometry GLCM density entropy mean 5.695 Built-up shape indexSTD 3.896 Texture pattern Geometry GLCM entropy 1.444 GLCM second mean 3.183 Built-up meanmoment area 3.613 Texture pattern Geometry GLCM variance 5.372 Built-up density 6.455 Texture pattern Density Built-up 4.654 Geometry Built-up Patchaggregation Density 5.186 Density Shadow density 1.274 Geometry Line density 1.618 Density Built-up shape index 3.896 Geometry Built-up mean area 3.613 Geometry 4.2. Features Used to Distinguish between Formal and Deprived Built-up density 6.455 Areas Density Built-up Patch Density 5.186 Density A first binary backward Line LR model to distinguish between formal and deprived areas using all density 1.618 Density
15 features shows that GLCM variance alone is sufficient to distinguish them, with a classification accuracy of 98.9 % and Nagelkerke R2 of 0.93. The coefficients and constants displayed in Table 4 are used to calculate the probability of a HUP being formally built-up. To simplify the calculation, the HUPs are stored as vector data and probability values are attributes.
Remote Sens. 2017, 9, 384
14 of 23
4.2. Features Used to Distinguish between Formal and Deprived Areas A first binary backward LR model to distinguish between formal and deprived areas using all 15 features shows that GLCM variance alone is sufficient to distinguish them, with a classification accuracy of 98.9 % and Nagelkerke R2 of 0.93. The coefficients and constants displayed in Table 4 are used to calculate the probability of a HUP being formally built-up. To simplify the calculation, the HUPs are stored as vector data and probability values are attributes. Table 4. Logistic regression (LR) model distinguishing formal and deprived areas. Features
B
Sig.
GLCM variance Constant
0.41.455924 −6.481
0.002 0.000
4.3. Analyzing the Separability of Deprived Areas The second LR model analyzes whether deprived area types can be distinguished based on the selected set of 15 features within a multinomial LR model. Table 5 shows the classification result for all types using the training data, having an overall accuracy of 83%. The lowest accuracy is obtained for the ‘slum mix’ category, with only 61.5% correctly predicted HUPs. This was to be expected, as these deprived areas contain a mixture of small and large buildings, illustrating the complexity of slum typologies. In addition, the type ‘basic/chawl’ shows some incorrect predictions, which relates to the diversity within this type, ranging from chawls to resettlement colonies. Problems within the type ‘slum small’ often relate to the definition of HUPs that sometimes include smaller areas of other types and relate to the fact that ground-truth was collected as point data, not necessarily representing the dominant type of a larger HUP. Very stable predictions are obtained for the type ‘slum pocket’ and the type ‘formal area’ (Table 5). However, the training samples for the type ‘slum pocket’ are rather few. Table 5. Accuracy of the multinomial LR model of all built-up types based on training samples (OA: overall accuracy). Predicted (Training Samples)
Observed
Slum Pocket Slum Small Slum Mix Basic/Chawl Formal Training samples (N) Overall percentage (N)
Slum Pocket
Slum Small
Slum Mix
Basic/Chawl
Formal
Accuracy
10 0 0 0 0 10 10.6%
0 21 2 3 0 26 27.7%
0 2 8 2 0 12 12.8%
0 4 3 13 0 20 21.3%
0 0 0 0 26 26 27.7%
100.0% 77.8% 61.5% 72.2% 100.0% 94 OA: 83.0%
4.4. Features to Classify Deprived HUPs To calculate the probability of a built-up HUP belonging to a specific deprived type, four binary backward LR models are employed. After eliminating all non-significant features (via the second model), the coefficients and constants for the significant features of the four types of deprived areas were obtained (Table 6). Out of the 15 features, only seven significant features were finally used within the four LR models, i.e., ‘built-up mean area’, ‘GLCM second moment mean’, ‘GLCM entropy mean’, ‘built-up patch density (PD)’, ‘GLCM variance’, ‘land cover/use evenness (SHEI)’, and ‘DEM mean’. The most commonly reoccurring feature is the ‘GLCM variance’. The features ‘built-up mean area’, ‘land cover/use evenness’, and ‘DEM mean’ are significant features for two types, while others are only significant for a specific type, e.g., ‘GLCM entropy mean’. The coefficients and constants are used (Equation (7)) to calculate the HUP probabilities for all types. All models have a high Nagelkerke R2 (ranging from 0.88 to 0.98), showing that they have very good explanatory power, even though there were only a few samples for some deprived classes.
Remote Sens. 2017, 9, 384
15 of 23
Table 6. LR models for all deprived area types. Type
Features
B
Accuracy
Slum Pocket
Built-up mean area GLCM variance Built-up patch density Constant
1704.6 −290.4 −308.5 227.7
Nagelkerke R2 : 0.88
Slum Small
GLCM variance Land cover/use evenness Built-up mean area Constant
−265.4 645.0 415.8 −513.5
Nagelkerke R2 : 0.98
GLCM variance DEM mean GLCM second moment mean Constant
−974.1 −492.9
GLCM variance DEM mean GLCM entropy mean Land cover/use evenness Constant
624.87 −755.6 −149.5 427.1 −102.8
Slum Mix
Basic/Chawl
Nagelkerke R2 : 0.92
−452.1 317.1
Nagelkerke R2 : 0.87
For the classification of the formal areas, the results of Table 4 are employed. Non-built-up HUPs (soil and vegetation) are classified using the land cover/use classification and OSM layers representing water bodies and roads. The classified HUPs (Figure 9) show the distribution of deprived areas. At the center of the mosaic is the international airport of Mumbai, with several deprived areas in its environs. Most large areas consist of the type ‘slum small’, whereas the type ‘slum pocket’ is scattered throughout the entire study area. The type ‘basic/chawl’ is found more towards the edges of the studied area, while the type ‘slum mix’ is often found adjacent to areas of the type ’slum small’. The statistics (Figure 9) show that 60.3% of the built-up area is ‘formal’, followed by 27.3% ‘slum small’, 5.6% ‘slum pockets’, 3.4% ‘slum mix’ and ‘basic/chawls’. Deprived areas in this part of Mumbai represent almost 40% of the built-up area, while deprived areas are diverse (with ‘slum small’ as the most commonly occurring type). Some problems exist with the dominant land cover/use type per HUP. For example, formal HUPs that are dominated by more than 60% vegetation cover are classified as vegetation HUP (see example 10a). Also, smaller areas that are within a larger HUP, e.g., small formal areas within larger deprived areas (see the example in Figure 10b,c) are omitted. Slum pockets are most prone to be completely or partially omitted (see the example in Figure 10d) due to their size. The transition between deprived types is very much influenced by the selected scale. Thus HUPs sometimes include a mix of formal and slum areas (see the example in Figure 10b), while the transition zones between deprived types are often not entirely crisp (see the example in Figure 10c). The overall classification accuracy for a typology of deprived areas is 79%, with a Kappa value of 0.67 (Table 7). The types with the best performance (considering producer and user accuracy) are ‘formal’ and ‘slum small’, followed by ‘basic formal/chawl’ and ‘slum pocket’. The type ‘slum mix’, which has in its morphological definition some degree of fuzziness, has the lowest accuracy. However, the results show that the employed features allow for the extraction of a complex typology of deprived areas, with some limitations.
Remote Sens. 2017, 9, 384
16 of 23
Figure 9. Mapping the typology of deprived areas on top of a land cover/use map (background image source: DigitalGlobe). Table 7. Confusion matrix classifying HUPs according to a typology of deprived areas. GROUND REFERENCE (TEST SAMPLES)
CLASSIFICATION RESULT
Slum Pocket
Slum Small
Slum Mix
Basic/Chawl
Formal
Total
Slum Pocket Slum Small Slum Mix Basic/Chawl Formal Total
7 4 0 0 2 13
2 69 1 0 3 75
0 9 4 0 0 13
0 2 2 7 1 12
0 7 0 1 45 53
9 91 6 8 52 166
User Accuracy
53.9%
92.0%
30.8%
58.3%
84.9%
Producer Accuracy 77.8% 75.80% 57.1% 87.5% 88.2% OA: 78.9% Kappa: 0.671
HUPs that are dominated by more than 60% vegetation cover are classified as vegetation HUP (see example 10a). Also, smaller areas that are within a larger HUP, e.g., small formal areas within larger deprived areas (see the example in Figure 10b,c) are omitted. Slum pockets are most prone to be completely or partially omitted (see the example in Figure 10d) due to their size. The transition between deprived types is very much influenced by the selected scale. Thus HUPs sometimes Remote Sens. 2017, 9,a 384 include mix of formal and slum areas (see the example in Figure 10b), while the transition zones between deprived types are often not entirely crisp (see the example in Figure 10c).
(a)
(b)
(c)
17 of 23
(d)
Figure 10. Mapping a typology of deprived areas: scope and limitations. (a) Formal and vegetation;
Figure 10. Mapping a typology of deprived areas: scope and limitations. (a) Formal and vegetation; (b) transition between slum types; (c) mix of deprived types; (d) slum pocket partial extraction. (b) transition between slum types; (c) mix of deprived types; (d) slum pocket partial extraction. The overall classification accuracy for a typology of deprived areas is 79%, with a Kappa value of 0.67 (TableHealth 7). The Ward types with the best performance (considering producer and user accuracy) are 4.5. Cross-Boundary Clusters of Deprivation ‘formal’ and ‘slum small’, followed by ‘basic formal/chawl’ and ‘slum pocket’. The type ‘slum mix’, which to has in its morphological degree of fuzziness, lowestthe accuracy. In order generate informationdefinition that hassome societal relevance andhas canthe inform development However, the results showisthat the employed features allow for the extraction of a complex typology at large of pro-poor policies, which often based on census data and commonly aggregated of deprived areas, with some limitations.
administrative units, the study examines whether such units are meaningful for mapping the diversity of deprivation. The results show that areasaccording do not match the boundaries of health wards, nor Table 7. Confusion matrixdeprived classifying HUPs to a typology of deprived areas. do health wards necessarily containGhomogeneous types of deprivation. As illustrated in Figure 11, ROUND REFERENCE (TEST SAMPLES) Slum deprived Slum Slum Producer health ward boundaries crosscut large areas.Basic/Chawl Furthermore, deprived areas within wards Formal Total Pocket Small Mix Accuracy differ, sometimes showing adjacent areas of different deprivation types as well as large clusters of Slum Pocket 77.8% 7 2 0 0 0 9 the same type. Analyzing deprivation administrative obscures the real Slum Small 4 based 69 on such 9 2 7 spatial 91 units75.80% Slum Mix 57.1% 0 1 4 0 6 spatial extent of deprivation and could prevent the efficient72 targeting of pro-poor policies, e.g., [65] CLASSIFICATION 87.5% Basic/Chawl 0 0 0 1 8 showed “considerable spatial (p. 15)0of deprivation (in45 form52of a slum Formalvariability” 88.2%index) within RESULT 2 3 1 Total 13 75 13 12 53 166 administrative units (neighborhoods). Combining our classification results with the index of multiple User OA: 78.9% 53.9% 92.0% 30.8% 58.3% 84.9% Kappa: deprivation reveals wards with lower census-based deprivation values may also Remote Sens. 2017,that 9, 384 Accuracy 170.671 of 22have large and cross-boundary clusters of deprivation (see ward A with an IMD of 0.29 in Figure 11), while also have large and cross-boundary clusters of deprivation (see ward A with an IMD of 0.29 in 4.5. Cross-Boundary Health Ward Clusters of Deprivation more deprived wards may havewards larger formal built-up areasbuilt-up (see ward with anB IMD Figure 11), while morealso deprived may also have larger formal areasB(see ward with of 0.39 in In order to in generate that has societal relevance and can inform the development of Figure 11).an IMD of 0.39 Figure information 11). pro-poor policies, which is often based on census data and commonly aggregated at large administrative units, the study examines whether such units are meaningful for mapping the diversity of deprivation. The results show that deprived areas do not match the boundaries of health wards, nor do health wards necessarily contain homogeneous types of deprivation. As illustrated in Figure 11, health ward boundaries crosscut large deprived areas. Furthermore, deprived areas within wards differ, sometimes showing adjacent areas of different deprivation types as well as large clusters of the same type. Analyzing deprivation based on such administrative spatial units obscures the real spatial extent of deprivation and could prevent the efficient targeting of pro-poor policies, e.g., [65] showed “considerable spatial variability” (p. 15) of deprivation (in form of a slum index) within administrative units (neighborhoods). Combining our classification results with the index of multiple deprivation reveals that wards with lower census-based deprivation values may
Figure 11. Cross health ward clusters of deprivation (A indicates a ward with an IMD of 0.29 and B
Figure 11. Cross health ward clusters of deprivation (A indicates a ward with an IMD of 0.29 and B has has an IMD of 0.39). an IMD of 0.39). When calculating the percentage of deprived areas from the total built-up area per ward (based on our classification results), the Pearson correlation coefficient with the multiple deprivation index
When calculating the percentage of deprived areas from the total built-up area per ward (based (IMD) is 0.83, showing that image features are helpful indicators for mapping deprivation. When on our classification the correlation coefficient multiple index comparing theresults), percentage of Pearson deprived areas with the percentage of with peoplethe living in slums deprivation per ward (census-based), the correlation, at 0.65, is much lower. This indicates that census statistics do not fully cover deprivation in a complex mega-city like Mumbai, and shows the high potential of VHR imagery, which is capable of mapping cross-ward clusters and the diversity of deprivation. However, this finding is limited by the temporal difference of the two datasets, as the census and image data have a time gap of eight years.
Remote Sens. 2017, 9, 384
18 of 23
(IMD) is 0.83, showing that image features are helpful indicators for mapping deprivation. When comparing the percentage of deprived areas with the percentage of people living in slums per ward (census-based), the correlation, at 0.65, is much lower. This indicates that census statistics do not fully cover deprivation in a complex mega-city like Mumbai, and shows the high potential of VHR imagery, which is capable of mapping cross-ward clusters and the diversity of deprivation. However, this finding is limited by the temporal difference of the two datasets, as the census and image data have a time gap of eight years. 5. Discussion The aim of the study was to analyze the capability of image processing methods to spatially distinguish different deprived areas in Mumbai from VHR imagery. Deprived areas in Mumbai have diverse and complex morphological characteristics, often overlooked in previous studies, e.g., [17,18]. The morphological characteristics were conceptualized into four dimensions, i.e., environment, texture pattern, density, and geometry, and further utilized in the image-based analysis to extract spatial information about their morphological differences. This not only improved our understanding of how to extract such information, but also has practical value. For instance, [51] stressed that deprived areas with a more regular pattern offer a better “base for subsequent improvements and installation of infrastructure”(p. 7) than areas with more irregular patterns, which often require more investment for upgrading. Thus, if different morphologies require different action for upgrading, detailed knowledge on the morphology of deprivation will support planning and decision-making for implementing upgrading policies [66]. However, the employed dimensions and their features have an inherent challenge, which refers to the spatial dimension used for its measurement [12]; for instance, density measures vary considerably depending on the reference unit used. Thus utilizing a different spatial aggregation level, e.g., via smaller or larger HUPs or using more regular outlined blocks will give different feature values and impact final mapping results. Nevertheless, we argue that HUPs optimized for the local context are much better adapted to reflect the urban morphology compared to administrative units, which are often not suitable due to the modifiable areal unit problem (MAUP) [12] and their overly large and variable size. The extracted morphological features allowed us to capture the diversity of four deprived and one formal built-up area type. The significance of these image features was analyzed within a LR model, resulting in a set of coefficients and constants for the most significant features (i.e., GLCM variance, built-up mean area, land cover/use evenness (SHEI), DEM mean, GLCM second moment mean, GLCM entropy mean, and built-up patch density). This allowed us to calculate class probabilities for all HUPs, which resulted in a fuzzy probability layer at the HUP level. The final typology of deprived areas was based on the highest class probability. Due to the logistical challenges of collecting a large set of ground-truth data spread over a large urban area, the number of training points was relatively small. Collecting such data based on visual image interpretation, as is often done, would introduce a lot of uncertainty, as experts often disagree on the delineation of deprived areas in VHR imagery [33,67]. The increasing availability of crowdsourced data and Google Street View (e.g., in Indonesian cities) combined with visual image interpretation might, in the future, facilitate the extraction of suitable training data. Therefore, it would be interesting to repeat the approach for other cities using a larger set of training data. Through this study we distinguished different types of deprivation with an overall classification accuracy of 79%. Obtained accuracy levels differed by type, showing that slums with small buildings had the highest classification accuracy while slums with mixed building sizes and the transition type between chawls and basic formal areas had the lowest classification accuracy. The aggregation of deprived areas to HUPs allowed for mapping the dominant type of entire neighborhoods. However, this aggregation often led to very small clusters of slum pockets (e.g., small pavement dwellings) being omitted as they are frequently part of a larger (e.g., formal) HUP. Employing a LR model helped to reduce the computational demand, because all feature values were aggregated to HUPs stored as
Remote Sens. 2017, 9, 384
19 of 23
vector data (in a raster data structure, image features would consume several GB). HUPs are also a more meaningful spatial unit for informing pro-poor policies. Furthermore, LR modeling allowed the extraction of the most significant features per type, while the fuzzy classification facilitated a better optimization of class threshold (probability) values compared to standard image classification methods. The presented approach to capture the diversity of deprivation in a large and complex megacity was tailored to the local morphology of deprivation (in Mumbai) via the selected image features. However, the conceptual level of the four dimensions of the diversity of deprivation has the potential of being transferable (for concepts on measuring transferability and robustness, see [59,67–69]) to other cities in the Global South. Further studies are recommended to better understand and analyze the diversity of deprivation across the globe, as well as to decide which image features are relevant for specific regional conditions. The application potential of mapping the diversity and clustering of deprived areas was illustrated by overlaying the result with the health ward boundaries. This showed that large administrative units have limited use in mapping fine-grained patterns of deprivation in a complex megacity [15]. The ward boundaries sometimes cut across larger clusters of deprivation, splitting them into smaller subunits. For informing pro-poor policy, ward-based information hides the spatial heterogeneity of deprivation within wards and across boundaries, hampering effective planning and service provision [66]. Thus, more disaggregated and clustered information on deprivation that also measures its diversity could improve planning and decision-making in complex and dynamic megacities. It also points to the possible benefit of coordinating anti-deprivation action across ward jurisdictions, so that spatial coherent investments and improvements are made. Thus, VHR imagery, with its potential for covering larger areas with high temporal frequency, is fit for capturing details of the urban morphology beyond the aggregated view of administrative units. 6. Conclusions Deprived areas are not homogenous in their dimensions, and considering them as one class ignores their vast diversity. We have shown that their morphological differences can be captured from space via image-based features, used as inputs for modeling the morphological dimensions of deprivation, i.e., geometry, density, texture pattern, and environment, while other aspects of their diversity such as economic activities are not easily captured from space. Employing image-based features within logistic regression models allowed for the selection of the most significant features to build a typology of deprivation in a very complex Indian megacity. The resulting fuzzy probability vector layer allowed for optimizing probabilities thresholds for the different types of deprivation and other land cover/use types. Comparing the results with aggregated deprivation maps revealed the internal diversity of wards as well as the existence of cross-ward clusters of deprivation. Such disaggregated spatial and semantically meaningful information on deprivation from VHR imagery has the potential to provide relevant information for strategic urban planning and management in a complex and dynamic megacity. Further research could address the transferability of image features for mapping locally specific types of deprivation to other cities in the Global South, aiming at employing a larger set of training data, which would allow for using larger feature sets. This would address one of the identified limitations of this research but also illustrate variations in the typology of deprivation across the globe. Acknowledgments: We would like to especially thank Emma Teräma, Navtej Nainan, Smita Waingankar, Vickyson Naorem, Ronald Soubam, and Kakchingtabam Lenin Sharma for their help with the field work, collecting valuable data in support of a better understanding of the complexity of slums in Mumbai. We acknowledge the support of DigitalGlobe providing the 8-band WorldView-2 images for this research. Author Contributions: Monika Kuffer performed the data analyses and wrote the majority of the paper. Karin Pfeffer, Richard Sliuzas, Isa Baud, and Martin van Maarseveen supported in developing the structure of the paper and revising the paper. Isa Baud and Karin Pfeffer organized and conducted the field data collection of the training dataset, and developed, together with Monika Kuffer, the local typology of deprived areas. Conflicts of Interest: The authors declare no conflict of interest.
Remote Sens. 2017, 9, 384
20 of 23
Abbreviations The following abbreviations are used in this manuscript: VHR OBIA GE OSM
Very high resolution Object-based image analysis Google Earth Open street map
References 1. 2. 3. 4. 5. 6. 7. 8. 9.
10.
11. 12.
13. 14.
15.
16. 17. 18.
19.
Nijman, J. Against the odds: Slum rehabilitation in neoliberal Mumbai. Cities 2008, 25, 73–85. [CrossRef] Gupte, R.; Shetty, R.; Mishra, R.; Mayadeo, A. Typologies and Beyond: Slum Settlement in Mumbai. Available online: https://critmumbai.files.wordpress.com/2011/10/slumtypologies1.pdf (accessed on 15 April 2017). Roy, D.; Lees, M.H.; Palavalli, B.; Pfeffer, K.; Sloot, M.A.P. The emergence of slums: A contemporary view on simulation models. Environ. Model. Softw. 2014, 59, 76–90. [CrossRef] Taubenböck, H.; Kraff, N.J. The physical face of slums: A structural comparison of slums in Mumbai, India, based on remotely sensed data. J. Hous. Built Environ. 2014, 29, 15–38. [CrossRef] Baud, I.; Sridharan, N.; Pfeffer, K. Mapping urban poverty for local governance in an Indian mega-city: The case of Delhi. Urban Stud. 2008, 45, 1385–1412. [CrossRef] Baud, I.; Pfeffer, K.; Sridharan, N.; Nainan, N. Matching deprivation mapping to urban governance in three Indian mega-cities. Habitat Int. 2009, 33, 365–377. [CrossRef] Directorate of Census Operations Maharashtra. Census of India 2011 Maharashtra. District Census Handbook, Mumbai; Directorate of Census Operations Maharashtra: Mumbai, India, 2011. Directorate of Census Operations Maharashtra. Census of India 2011 Maharashtra. District Census Handbook, Mumbai Suburban; Directorate of Census Operations Maharashtra: Mumbai, India, 2011. Mahabir, R.; Stefanidis, A.; Croitoru, A.; Crooks, A.; Agouris, P. Authoritative and volunteered geographical information in a developing country: A comparative case study of road datasets in Nairobi, Kenya. ISPRS Int. J. Geo-Inf. 2017, 6, 24. [CrossRef] Graesser, J.; Cheriyadat, A.; Vatsavai, R.R.; Chandola, V.; Long, J.; Bright, E. Image based characterization of formal and informal neighborhoods in an urban landscape. IEEE J. Sel. Top. Appl. Earth Obs. Remote Sens. 2012, 5, 1164–1176. [CrossRef] Huang, X.; Zhang, L. Morphological building/shadow Index for building extraction from high-resolution imagery over urban areas. IEEE J. Sel. Top. Appl. Earth Obs. Remote Sens. 2012, 5, 161–172. [CrossRef] Taubenböck, H.; Standfuß, I.; Klotz, M.; Wurm, M. The physical density of the city—Deconstruction of the delusive density measure with evidence from two European megacities. ISPRS Int. J. Geo-Inf. 2016, 5, 206. [CrossRef] Gevaert, C.M.; Persello, C.; Sliuzas, R.; Vosselman, G. Informal settlement classification using point-cloud and image-based features from UAV data. ISPRS J. Photogramm. Remote Sens. 2017, 125, 225–236. [CrossRef] Kuffer, M.; Pfeffer, K.; Baud, I.S.A.; Sliuzas, R.V. Analysing sub-standard areas using high resolution remote (VHR) sensing imagery. In Proceedings of the 14th N-AERUS/GISDECO Conference, Enschede, The Netherlands, 12–14 September 2013. Baud, I.; Kuffer, M.; Pfeffer, K.; Sliuzas, R.V.; Karuppannan, S. Understanding heterogeneity in metropolitan India: The added value of remote sensing data for analyzing sub-standard residential areas. Int. J. Appl. Earth Obs. Geoinf. 2010, 12, 359–374. [CrossRef] Kamini, J.; Jayanthi, S.; Raghavswamy, V. Spatio-temporal analysis of land use in urban Mumbai—using multi-sensor satellite data and GIS techniques. J. Indian Soc. Remote 2006, 34, 385–396. [CrossRef] Kuffer, M.; Pfeffer, K.; Sliuzas, R.; Baud, I. Extraction of slum areas from VHR imagery using GLCM variance. IEEE J. Sel. Top. Appl. Earth Obs. Remote Sens. 2016, 9, 1830–1840. [CrossRef] Taubenböck, H.; Wurm, M. Ich weiß, dass ich nichts weiß—Bevölkerungsschätzung in der Megacity Mumbai. In Globale Urbanisierung: Perspektive aus dem All; Taubenböck, H., Wurm, M., Esch, T., Dech, S., Eds.; Springer: Berlin/Heidelberg, Germany, 2015; pp. 171–178. Wurm, M.; Taubenböck, H.; Weigand, M.; Schmitt, A. Slum mapping in polarimetric SAR data using spatial features. Remote Sens. Environ. 2017, 194, 190–204. [CrossRef]
Remote Sens. 2017, 9, 384
20. 21. 22.
23. 24. 25. 26. 27.
28.
29.
30. 31. 32. 33. 34. 35.
36. 37. 38. 39. 40. 41. 42.
21 of 23
Kuffer, M.; Pfeffer, K.; Sliuzas, R. Slums from space—15 years of slum mapping using remote sensing. Remote Sens. 2016, 8, 455. [CrossRef] Huang, X.; Lu, Q.; Zhang, L. A multi-index learning approach for classification of high-resolution remotely sensed images over urban areas. ISPRS J. Photogramm. Remote Sens. 2014, 90, 36–48. [CrossRef] Huang, X.; Liu, H.; Zhang, L. Spatiotemporal detection and analysis of urban villages in mega city regions of China using high-resolution remotely sensed imagery. IEEE Trans. Geosci. Remote Sens. 2015, 53, 3639–3657. [CrossRef] Kohli, D.; Sliuzas, R.; Stein, A. Urban slum detection using texture and spatial metrics derived from satellite imagery. J. Spat. Sci. 2016, 61, 405–426. [CrossRef] Liu, X.H.; Clarke, K.; Herold, M. Population density and image texture: A comparison study. Photogramm. Eng. Remote Sens. 2006, 72, 187–196. [CrossRef] Kohli, D.; Sliuzas, R.V.; Kerle, N.; Stein, A. An ontology of slums for image-based classification. Comput. Environ. Urban Syst. 2012, 36, 154–163. [CrossRef] Haralick, R.M.; Shanmugam, K.; Dinstein, I. Texture features for image classification. IEEE Trans. Syst. Man Cybern. 1973, 3, 610–621. [CrossRef] Pesaresi, M.; Gerhardinger, A.; Kayitakire, F. A robust built-up area presence index by anisotropic rotation-invariant textural measure. IEEE J. Sel. Top. Appl. Earth Obs. Remote Sens. 2008, 1, 180–192. [CrossRef] Verzosa, L.C.O.; Gonzalez, R.M. Remote sensing, geographic information systems and Shannon’s entropy: Measuring urban sprawl in a mountainous environment. Int. Arch. Photogramm. Remote Sens. Spat. Inf. Sci. 2010, 38, 269–274. Praptono, N.H.; Sirait, P.; Fanany, M.I.; Arymurthy, A.M. An automatic detection method for high density slums based on regularity pattern of housing using Gabor filter and GINI index. In Proceedings of the IEEE Advanced Computer Science and Information Systems (ICACSIS), Bali, Indonesia, 28–29 September 2013; pp. 347–351. Stasolla, M.; Gamba, P. Humanitarian aids using satellite technology. In Space Technologies for the Benefit of Human Society and Earth; Olla, P., Ed.; Springer: Dordrecht, The Netherlands, 2009; pp. 431–451. Taubenböck, H.; Wegmann, M.; Roth, A.; Mehl, H.; Dech, S. Urbanization in India—Spatiotemporal analysis using remote sensing data. Comput. Environ. Urban Syst. 2009, 33, 179–188. [CrossRef] Herold, M.; Couclelis, H.; Clarke, K.C. The role of spatial metrics in the analysis and modeling of urban land use change. Comput. Environ. Urban Syst. 2005, 29, 369–399. [CrossRef] Kohli, D.; Stein, A.; Sliuzas, R. Uncertainty analysis for image interpretations of urban slums. Comput. Environ. Urban Syst. 2016, 60, 37–49. [CrossRef] Martínez, J.A.; Pfeffer, K.; Baud, I. Factors shaping cartographic representations of inequalities: Maps as products and processes. Habitat Int. 2016, 51, 90–102. [CrossRef] Richter, C.; Miscione, G. Enlisting SDI for urban planning in India: Local practices in the case of slum declaration. In Spatial Data Infrastructures SDI in Context North and South; Nedovic-Budic, Z., Crompvoets, J.W.H.C., Georgiadou, P.Y., Eds.; CRC Press: Boca Raton, FL, USA, 2011; pp. 157–179. Office of the Registrar General & Census Commissioner. Primary Census Abstract for Slum; Office of the Registrar General & Census Commissioner: New Delhi, India, 2013. Chandrasekhar, S.; Montgomery, M.R. Broadening Poverty Definitions in India: Basic Needs in Urban Housing; IIED: London, UK, 2011; Volume 27. Nolan, L.B. Slum definitions in urban India: Implications for the measurement of health inequalities. Popul. Dev. Rev. 2015, 41, 59–84. [CrossRef] [PubMed] Government of India. Slums in India a Statistical Compendium; Ministry of Housing and Urban Poverty Alleviation, National Buildings Organization: New Delhi, India, 2011. Patel, S. Upgrade, rehouse or resettle? An assessment of the Indian government’s Basic Services for the Urban Poor (BSUP) programme. Environ. Urban. 2013, 25, 177–188. [CrossRef] UN-Habitat. Slums of the World: The Face of Urban Poverty in the New Millennium; UN-HABITAT: Nairobi, Kenya, 2003; p. 90. Dosh, P. Tactical innovation, democratic governance, and mixed motives: Popular movement resilience in Peru and Ecuador. Lat. Am. Politics Soc. 2009, 51, 87–118. [CrossRef]
Remote Sens. 2017, 9, 384
43. 44.
45. 46.
47. 48. 49. 50.
51. 52. 53.
54.
55. 56. 57.
58. 59. 60.
61. 62. 63. 64. 65.
22 of 23
Fekade, W. Deficits of formal urban land management and informal responses under rapid urban growth, an international perspective. Habitat Int. 2000, 24, 127–150. [CrossRef] Galeon, F. Estimation of population in informal settlement communities using high resolution satellite image. In Proceedings of the XXI ISPRS Congress, Commission IV, Beijing, China, 3–11 July 2008; Volume 37, pp. 1377–1381. Githira, D.N. Growth and eviction of Informal Settlements in Nairobi; University of Twente Faculty of Geo-Information and Earth Observation (ITC): Enschede, The Netherlands, 2016. Soliman, A.M. Tilting at Sphinxes: Locating urban informality in Egyptian cities. In Urban Informality: Transnational Perspectives from the Middle East, Latin America, and South Asia; Ananya, R., Nezar, A., Eds.; Lexington Books: Lanham, MD, USA, 2004; pp. 171–208. Abd-Allah, M.M.A. Modelling Urban Dynamics Using Geographic Information Systems, Remote Sensing and Urban Growth Models; Cairo University: Giza, Egypt, 2007. Smollich, S. An Integrative Approach Using Remote Sensing and Social Analysis to Identify Different Settlement Types and the Specific Living Conditions of Its Inhabitants; LMU München: Munich, Germany, 2015. Krishna, A.; Sriram, M.; Prakash, P. Slum types and adaptation strategies: Identifying policy-relevant differences in Bangalore. Environ. Urban. 2014, 26, 568–585. [CrossRef] Vahidi, H.; Yan, W. Towards spatially explicit agent-based model for simulation of informal transport infrastructure indirect growth dynamic in informal settlements. In Proceedings of the International Archives of the Photogrammetry, Remote Sensing and Spatial Information Sciences—ISPRS Archives, Tehran, Iran, 15–17 November 2014; pp. 273–279. Fernandez, R.F. Physical and spatial characteristics of slum territories vulnerable to natural disasters. Les Cahiers de l’Afrique de l’Est 2011, 44, 5–22. Government of India. Population Census. 2011. Available online: http://www.census2011.co.in/ (accessed on 7 June 2016). Naorem, V.; Kuffer, M.; Verplanke, J.J.; Kohli, D. Robustness of rule sets using VHR imagery to detect informal settlements: A case of Mumbai, India. In Proceedings of the GEOBIA 2016: Solutions and Synergies, Enschede, The Netherlands, 14–16 September 2016. McGarigal, K.; Cushman, S.A.; Ene, E. FRAGSTATS v4: Spatial Pattern Analysis Program for Categorical and Continuous Maps. Computer Software Program Produced by the Authors at the University of Massachusetts, Amherst. 2012. Available online: http://www.umass.edu/landeco/research/fragstats/fragstats.html (accessed on 15 April 2017). Duque, J.C.; Patino, J.E.; Ruiz, L.A.; Pardo-Pascual, J.E. Measuring intra-urban poverty using land cover and texture metrics derived from remote sensing data. Landsc. Urban Plan. 2015, 135, 11–21. [CrossRef] Owen, K.K.; Wong, D.W. An approach to differentiate informal settlements using spectral, texture, geomorphology and road accessibility metrics. Appl. Geogr. 2013, 38, 107–118. [CrossRef] Sandborn, A.; Engstrom, R.N. Determining the relationship between census data and spatial features derived from high-resolution imagery in Accra, Ghana. IEEE J. Sel. Top. Appl. Earth Obs. Remote Sens. 2016, 9, 1970–1977. [CrossRef] Stow, D.A.; Lippitt, C.D.; Weeks, J.R. Geographic object-based delineation of neighborhoods of Accra, Ghana using QuickBird satellite imagery. Photogramm. Eng. Remote Sens. 2010, 76, 907–914. [CrossRef] Hofmann, P.; Blaschke, T.; Strobl, J. Quantifying the robustness of fuzzy rule sets in object-based image analysis. Int. J. Remote Sens. 2011, 32, 7359–7381. [CrossRef] Weeks, J.R.; Getis, A.; Stow, D.A.; Hill, A.G.; Rain, D.; Engstrom, R.; Stoler, J.; Lippitt, C.; Jankowska, M.; Lopez-Carr, A.C.; et al. Connecting the dots between health, poverty, and place in Accra, Ghana. Ann. Assoc. Am. Geogr. 2012, 102, 932–941. [CrossRef] [PubMed] Kuffer, M.; Barros, J.; Sliuzas, R. The development of a morphological unplanned settlement index using very-high-resolution (VHR) imagery. Comput. Environ. Urban Syst. 2014, 48, 138–152. [CrossRef] Field, A. Discovering Statistics Using IBM SPSS Statistics; Sage: London, UK, 2013. Myers, R.H. Classical and Modern Regression with Applications; Duxbury: Boston, MA, USA, 1990. Rogerson, P.A. Statistical Methods for Geography: A Student’s Guide; Sage: London, UK, 2010. Weeks, J.R.; Hill, A.; Stow, D.A.; Getis, A.; Fugate, D. Can we spot a neighborhood from the air? Defining neighborhood structure in Accra, Ghana. GeoJournal 2007, 69, 9–22. [CrossRef] [PubMed]
Remote Sens. 2017, 9, 384
66.
67.
68.
69.
23 of 23
Sliuzas, R.; Kuffer, M.; Pfeffer, K.; Gevaert, C.M.; Persello, C. Slum mapping: From space to unmanned aerial vehicle based approaches. In Proceedings of the Joint Urban Remote Sensing Event, Dubai, United Arab Emirates, 6–8 March 2017; p. 4. Pratomo, J.; Kuffer, M.; Martínez, J.A.; Kohli, D. Uncertainties in analyzing the transferability of the generic slum ontology. In Proceedings of the GEOBIA 2016: Solutions and Synergies, Enschede, The Netherlands, 14–16 September 2016. Hofmann, P. Defining robustness measures for OBIA framework: A case study for detecting informal settlements. In Global Urban Monitoring and Assessment through Earth Observation; Weng, Q., Ed.; CRC Press: Boca Raton, FL, USA, 2014; pp. 303–324. Kohli, D.; Warwadekar, P.; Kerle, N.; Sliuzas, R.; Stein, A. Transferability of object-oriented image analysis methods for slum identification. Remote Sens. 2013, 5, 4209–4228. [CrossRef] © 2017 by the authors. Licensee MDPI, Basel, Switzerland. This article is an open access article distributed under the terms and conditions of the Creative Commons Attribution (CC BY) license (http://creativecommons.org/licenses/by/4.0/).