Abstract Kelvin probe-based contact potential measure- ... Keywords Kelvin probe . ...... Jewell L, Davis B (2006) Review of absorption and adsorption in.
J Solid State Electrochem DOI 10.1007/s10008-017-3541-3
ORIGINAL PAPER
Challenges in hydrogen quantification using Kelvin probe technique at different levels of relative humidity Wolfgang Burgstaller 1,2 & Gabriela Schimo 1,3 & Achim Walter Hassel 1,2,3
Received: 8 November 2016 / Revised: 9 February 2017 / Accepted: 13 February 2017 # The Author(s) 2017. This article is published with open access at Springerlink.com
Abstract Kelvin probe-based contact potential measurements were conducted with in situ electrochemical hydrogen loading of a Pd membrane with a thickness of 100 μm. The theoretical basis of diffusion coefficient calculation based on measured response time of potential drop, arising from hydrogen arriving at the detection side of the Pd membrane, was discussed. In situ hydrogen loading was also utilized for insertion of different amounts of hydrogen into the Pd sample while monitoring the resulting contact potential difference changes. Measurement of contact potential difference at different final values of hydrogen concentration in the Pd membrane was performed at various atmospheric conditions, focusing in this work on increasing relative humidity (4 to 85% rH). Moreover, the effect of humidity changes on hydrogen effusion kinetics at room temperature and low oxygen content ( 0, where x = 0 is defined as the hydrogen entry side of the sample and x = L is the corresponding exit side, with the initial condition Ct = 0,x > 0 = C0 and the boundary condition Ct > 0,x = 0 = CH,x = 0 gives the following: � � � � x ð7Þ C x;t ¼ C H;x¼0 − C H;x¼0 −C 0 erf pffiffiffiffiffiffiffiffi 4Dt The concentration distribution (Fig. 2) can be approximated by the following: � � ∂cx;t x ð8Þ C x;t ≈C H;x¼0 − ð0; t Þx ¼ C H;x¼0 1− pffiffiffiffiffiffiffiffi ∂x πDt The penetration depth is therefore defined as follows: pffiffiffiffiffiffiffiffi xpen ¼ πDt ð9Þ In our case, xpen is limited by the thickness (L = 0.01 cm) of the membrane and the time t corresponds to the onset or response time (tonset) of the measured KP potential drop. Therefore, solution of D gives, for the case of materials with very low hydrogen trap density, D¼
L2 0:012 ¼ 3:32∙10−7 cm2 s−1 ¼ πt onset 96π
ð10Þ
This value is in good agreement to previously published results [21, 34, 42, 50, 51]. After finishing hydrogen loading for determination of diffusion coefficient, point measurement of CPD was continued until a return of the potential almost to the initial value of 0.575 V (SHE) was observed. Increase in potential, which describes removal of hydrogen from the Pd sample, is slow due to conditions inhibiting the reaction of absorbed hydrogen and consecutive removal from the foil. In contrast to electrochemical unloading of hydrogen, where an anodic potential is applied to the sample, enabling fast reaction kinetics, removal of hydrogen has to occur by recombination of adsorbed hydrogen followed by desorption as molecular hydrogen (Fig. 3) or by reaction with atmospheric oxygen at the hydrogen exit side of the sample [29]. Additional to the effusion of hydrogen into the atmosphere on the exit side of the sample probed by the KP, hydrogen can diffuse back to the entry side of the sample, where a loss of hydrogen into the electrolyte is highly probable. Kirchheim and coworkers showed in several publications that the loss of hydrogen in molecular state into the electrolyte is highly dependent on mobility and activity of hydrogen in the electrolyte [52–54]. In order to decrease the hydrogen mobility in the electrolyte, a highly viscous electrolyte was used, which is, however, not suited for the herein presented flow cell setup. An interesting aspect found in results presented in Fig. 2 is that the potential is not reaching its starting value, even after
Fig. 3 Schematic depicting Kelvin probe measurement on Pd during electrochemical hydrogen loading in the flow cell including reaction mechanisms and hydrogen concentration profiles (cx,t)
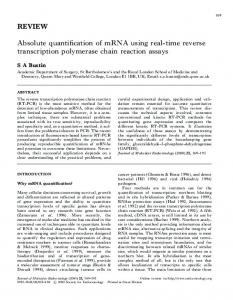
very long recovering times. This aspect was already reported in literature [33] and can be on the one hand due to hydrogen trapping phenomena as well as irreversible deformations of the metal lattice. As preparation for electrochemical hydrogen loading of the Pd sample, a suitable potential has to be chosen. For this purpose, a cyclic voltammogram of Pd in 0.1-M NaOH solution was recorded (Fig. 4) at the same electrolyte flow rate as for all other experiments described in this work. Maintenance of flow rate is essential, as convectional changes were reported to affect hydrogen entry into the metal sample [55] significantly. The shape of the recorded cyclic voltammogram (CV) is slightly different from other published results [36, 56, 57], which can be due to electrolyte convection. Nevertheless, a cathodic peak resulting from hydrogen adsorption, absorption and hydrogen evolution as indicated in Fig. 3 can be identified. At less cathodic potentials, reduction of Pd oxide (−0.09 V (SHE)), previously formed at potentials above 0.1 V (SHE), is visible. Combined with results from a previous work [34], a potential of −0.7 V (SHE) was chosen for hydrogen loading of the Pd sample, which is positioned in the hydrogen adsorption and absorption region as depicted in Fig. 3. At lower potentials, hydrogen evolution reaction (HER) occurs dominating the hydrogen ingress with formation of a mixed α-,β-PdH phase at the entry side of the Pd membrane. Even though the used flow cell allows for polarizations at lower potentials going along with hydrogen evolution as shown in [34], those cathodic potentials are not considered for hydrogen loading as formation of β-PdH phase has to be avoided [25, 47].
J Solid State Electrochem
Fig. 4 Cyclic voltammogram recorded on Pd at a potential scan rate of 10 mV s−1 in 0.1-M NaOH solution for determination of suitable Hloading potential
In order to achieve various amounts of hydrogen in the Pd sample, as mentioned earlier, several loading cycles were conducted by applying a constant potential of −0.7 V (SHE) with pulse durations between 5 and 180 s. The corresponding current transients (j) measured during these potentiostatic Hloading cycles are presented in Fig. 5. From integration of the obtained current transients, the amount of inserted hydrogen can be calculated as shown representatively in the inset of Fig. 5 for hydrogen loading pulse of 75-s duration. The calculation is based on Faraday’s laws [58]: QH ¼ j∙t ¼ nH ∙z∙ F
ð11Þ
QH describes the amount of charge per square centimetre, which can be correlated to the amount of hydrogen inserted (nH). Finally, by dividing the obtained nH by the thickness of the sample (L), one obtains the hydrogen concentration per volume (cH,coulometric): cH;coulometric ¼
nH L
ð12Þ
At −0.7 V (SHE), the hydrogen evolution is assumed to be negligible, enabling calculation of the inserted amount of hydrogen from integration of the measured insertion current during cathodic polarization. However, part of the hydrogen, which was inserted into the Pd membrane, will be lost into the electrolyte, especially after finishing cathodic polarization. Therefore, the calculated amount of hydrogen (Eqs. 11 and 12) is an approximation, reflecting the amount of hydrogen in the Pd membrane without giving the exact value. Determination of the real hydrogen concentration is, for the system used, only accessible via numerical simulation, taking into account loss of hydrogen into the electrolyte and effusion of hydrogen into the KP chamber atmosphere next to diffusion
Fig. 5 Electrochemical hydrogen loading transients measured during potentiostatic H-loading at −0.7 V (SHE) including scheme of determination of amount of charged hydrogen by integration of current transient
rates of hydrogen in Pd. The loss of hydrogen into the KP chamber atmosphere as well as the loss into the electrolyte is dependent not only on the hydrogen concentration in the Pd, but also on the composition of the electrolyte and the atmosphere, respectively. Hydrogen detection and humidity influence In order to avoid systematic measurement errors due to changes in the sample material, which is in our case Pd, occurring during variation of KP measurement atmosphere, CPD was recorded (Fig. 6) for at least 45 min at each adjusted value of relative humidity (rH). Variation of potential in a humidity range between