19
Changes in baseline growth and maturation parameters of Northwest Atlantic porbeagle, Lamna nasus, following heavy exploitation Rachel M. Cassoff, Steven E. Campana, and Sigmund Myklevoll
Abstract: We tested for density-dependent changes in growth and maturation of Northwest Atlantic porbeagle (Lamna nasus) after the population declined by 75%–80% from fishing. Vertebrae and reproductive data collected from the virgin (1961–1966) and exploited (1993–2004) populations were analysed to test for differences in growth rate and age and length at maturity between the time periods. We detected significant differences between reparameterized von Bertalanffy growth models for each period, using likelihood ratio tests. Beyond an age of 7 years, mean length at age was greater during 1993–2004 than during 1961–1966. Between 1961–1963 and 1999–2001, length at maturity decreased in males (from 179 to 174 cm curved fork length (CFL)) and was invariant in females (216 cm CFL), whereas age at maturity declined in both males (from 8 to 7 years) and females (from 19 to 14 years). An analysis of porbeagle temperature associations indicated that sharks occupied comparable temperature conditions during the mid-1960s and 1990s, ruling out the possibility of temperature-induced growth changes. The observed increase in growth rate and decrease in age at maturity following exploitation support the hypothesis of a compensatory density-dependent growth response. Résumé : Après que la population de maraîches (Lamna nasus) du nord-ouest de l’Atlantique eût décliné de 75–80 % à cause de la pêche, nous avons recherché l’existence de changements reliés à la densité dans la croissance et la maturation. Nous avons analysé des données sur les vertèbres et la reproduction récoltées dans la population non exploitée (1961–1966) et la population exploitée (1993–2004) afin de vérifier les différences de taux de croissance et d’âges et longueurs à la maturité durant ces deux périodes. Des tests de rapports de vraisemblance indiquent des différences significatives entre les modèles de croissance de Bertalanffy reparamétrisés durant les deux périodes. Au-delà de l’âge de 7 ans, la longueur moyenne en fonction de l’âge est plus grande en 1993–2004 qu’en 1961–1966. Entre 1961–1963 et 1999–2001, la longueur à la maturité a diminué chez les mâles (de 179 à 174 cm de longueur courbée à la fourche, CFL), mais elle est demeurée la même chez les femelles (216 cm CFL); cependant, l’âge à la maturité a décliné, tant chez les mâles (de 8 à 7 ans) que chez les femelles (de 19 à 14 ans). Une analyse des associations des maraîches avec la température indique que ces requins ont vécu dans des conditions thermiques comparables durant le milieu des années 1960 et les années 1990, ce qui élimine la possibilité que les changements de croissance aient été causés par la température. L’accroissement du taux de croissance et le déclin de l’âge à la maturité observés après l’exploitation est compatible avec l’hypothèse d’une réaction de croissance dépendante de la densité. [Traduit par la Rédaction]
Cassoff et al.
29
Introduction The porbeagle, Lamna nasus, is a large, cold-temperate, pelagic shark species found in the eastern and western North Atlantic and more broadly throughout the oceans of the southern hemisphere (Svetlov 1978; Compagno 2001). Porbeagles residing in the Northwest Atlantic are considered to be members of a single population (Campana et al. 1999) ranging from northern Newfoundland to at least New Jersey and perhaps to South Carolina (Templeman 1963; Campana
et al. 1999). Porbeagles in this population are most abundant on and along the continental shelves in the area encompassing the Gulf of Maine (off New England) to the Grand Banks (off southern Newfoundland). However, distribution varies seasonally across this region as a result of size and sex-specific north–south migrations (Aasen 1963; Campana et al. 2001). In the Northwest Atlantic, porbeagle abundance has declined by an estimated 75%–80% since the early 1960s (Department of Fisheries and Oceans (DFO) 2005), warranting
Received 13 March 2006. Accepted 8 November 2006. Published on the NRC Research Press Web site at http://cjfas.nrc.ca on 16 January 2007. J19223 R.M. Cassoff.1,2 Department of Biology, Dalhousie University, 1355 Oxford Street, Halifax, NS B3H 4J1, Canada. S.E. Campana. Department of Fisheries and Oceans, Bedford Institute of Oceanography, P.O. Box 1006, Dartmouth, NS B2Y 4A2, Canada. S. Myklevoll. Institute of Marine Research, P.O. Box 1870, Nordnes, N-5817 Bergen, Norway. 1 2
Corresponding author (e-mail:
[email protected]). Present address: 413 Maple Lane, Sewickley, PA 15143, USA.
Can. J. Fish. Aquat. Sci. 64: 19–29 (2007)
doi:10.1139/F06-167
© 2007 NRC Canada
20
their recent designation as endangered by the Committee on the Status of Endangered Wildlife in Canada (COSEWIC 2004). Several independent lines of evidence strongly implicate exploitation in commercial target fisheries as the cause of this decline (Campana et al. 2003). Commercial harvesting of porbeagles started in 1961, when Norwegian longliners began exploratory fishing on the virgin (previously unexploited) population. Historically, exploitation was most intense during the first few years of the fishery. From 1961 to 1964, total reported annual landings in the Northwest Atlantic rose from 1900 to 9000 tonnes (t) (Campana et al. 2002a). These intense fishing efforts precipitated the collapse of the Norwegian fishery in the late 1960s and reduced the population to an estimated 50% of the virgin abundance (DFO 2005). A modest recovery of porbeagle numbers occurred throughout the 1970s and 1980s, as landings averaged less than 350 t·year–1 (Campana et al. 2002a). However, annual catches increased to 1000–2000 t during the 1990s, and the abundance of porbeagles once again fell sharply (Campana et al. 2003). Subsequent catch restrictions, implemented under a Canadian Shark Management Plan, reduced annual landings to less than 250 t by 2002 (Campana et al. 2003). A recent stock assessment indicated that these measures were effective in stabilizing the population at its current low level (DFO 2005). Given the magnitude of the decline in porbeagle abundance since the early 1960s, a density-dependent compensatory response would be expected. One process that could potentially lead to compensation in depleted shark populations is a density-dependent increase in somatic growth rates owing to reduced prey limitation and a concomitant decrease in the age at sexual maturity (as maturation is largely sizedependent) (Holden 1973). Demographic analyses have demonstrated that a compensatory growth response may be one of the main mechanisms of population regulation in sharks (Smith et al. 1998; Cortés 2002; Frisk et al. 2005). Compensatory changes in growth have been observed in a large number of teleost populations (see Rose et al. (2001) and references therein). However, because reliable, longterm biological and fisheries data are lacking for the majority of elasmobranch species (Compagno 1990; Stevens et al. 2000), few rigorous empirical investigations have addressed compensatory processes in sharks. Two recent studies have provided the only empirical evidence to date of density-dependent growth in sharks. Carlson and Baremore (2003) reported increased juvenile growth rates and earlier sexual maturation of Atlantic sharpnose sharks (Rhizoprionodon terraenovae) in the Gulf of Mexico after a period of intensified exploitation. Similarly, off the southeastern US, Sminkey and Musick (1995) observed faster growth in juvenile sandbar sharks (Carcharhinus plumbeus) following declines in population size. Although density-dependent effects were strongly implicated in these changes, neither study was able to evaluate the relative influence of other factors that affect rates of growth, such as changes in environmental conditions. Furthermore, sampling occurred well after the onset of exploitation in both studies. Therefore, the documented changes in life history likely do not represent the full scope for compensatory response in either shark species.
Can. J. Fish. Aquat. Sci. Vol. 64, 2007
The biology of the porbeagle in the Northwest Atlantic has been the subject of research since the commencement of commercial harvesting in the early 1960s. As a result, vertebral samples and reproductive data were available from the periods 1961–1966 and 1993–2004, providing us with the opportunity to examine possible density-dependent changes in baseline growth and maturation parameters. As far as we are aware, this is the only shark population for which preexploitation life history data are available. The first objective of our study was to reconstruct porbeagle growth rate and estimate age and length at maturity in order to test for differences between the time periods. If porbeagle growth was responsive to changes in density, then we would expect an increase in growth rate, as well as a decline in the age at maturity between the sampling periods. In addition to evaluating density-dependent effects, we also considered the effects of variation in ambient water temperature on porbeagle growth as an alternative explanation of observed growth rate changes. Finally, we evaluate the implications of our findings to the understanding of life history theory in sharks.
Materials and methods Two sets of porbeagle vertebrae were used for age and growth analysis: one taken after three to four decades of heavy exploitation in the Northwest Atlantic and one taken from the virgin (previously unfished) population. Collectively, 615 samples were available from the recent past: 558 prepared vertebrae available from 1993–1999, which were used for a previous age determination study (Natanson et al. 2002), and 57 additional vertebrae obtained in 2004. Sampling took place primarily in the spring and fall on commercial and research vessels operating with longline gear in an area encompassing the Gulf of Maine to the Grand Banks (off southern Newfoundland) and Gulf of St. Lawrence (Fig. 1). Captured individuals were considered to be members of a single population, an assumption strongly supported by long-term tagging studies by Canada, the US, and Norway (Campana et al. 1999). Vertebrae were taken from sharks between the head and the branchial chamber (numbers 10–15) and stored frozen or in 70% ethanol. Body lengths were reported to the nearest centimetre as curved fork length (CFL; over the body distance from the tip of the snout to the fork in the tail) (CFL = straight fork length, r2 = 0.998; Campana et al. 1999). Reproductive information, including maturity status and length of reproductive organs, was available for the years 1999–2001 (Jensen et al. 2002). Vertebral samples collected in 1961–1966 were analyzed to reconstruct the growth rate of the virgin porbeagle population. A total of 229 samples were acquired from the archives of the Institute of Marine Research (IMR) in Bergen, Norway. Most of the vertebrae (99%) were collected in the first 2 years of the fishery. Sampling was carried out between May and August by Olav Aasen (IMR) onboard the Norwegian longliners that first targeted porbeagles in the Northwest Atlantic. Vertebrae were taken on the same fishing grounds as the more recent samples (with the exception of one shark captured off North Carolina) and with comparable fishing gear (Joyce 1999). Four to six vertebrae were reportedly removed midway between the head and the caudal © 2007 NRC Canada
Cassoff et al.
21
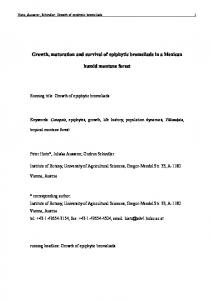
Fig. 1. Map of the Northwest Atlantic showing the distribution of porbeagle (Lamna nasus) catch recorded in the 1965 and 1966 fishing logs of the Norwegian longliner M.S. Volstad. Fishing locations for the remainder of the sampling period (1961–1964) are not shown. Expanding circles are proportional in size to the number of sharks captured, and ×s represent zero catch. The principal porbeagle fishing grounds, where historical and recent vertebral samples were collected, are delineated by the rectangle. The 100 m (broken lines) and 200 m (solid lines) depth contours are shown.
fin of each shark (numbers 50–60) (S. Myklevoll, personal communication, 2005) and stored either dry or in formalin. Aasen (1963) recorded exterior clasper and uterus lengths to the nearest millimetre and either a nonstandard total length (TL) or dorsal length (DL; distance from the anterior edge of the first dorsal fin to the anterior precaudal pit) to the nearest centimetre. The following regression models were used to convert Aasen’s body length measurements to CFL (Campana et al. 1999, 2001): CFL = 0.947 TL + 3.64 CFL = 3.03DL0.904
(n = 361, r 2 = 0.99)
(n = 356, r 2 = 0.99)
One vertebra from each shark was processed according to the methods of Natanson et al. (2002). This entailed removing excess tissue and measuring medial dorso-ventral centrum diameter (CD) with calipers to the nearest millimetre. A sagittal (bow tie) cross section of each centrum was made through the center with a diamond-bladed Isomet saw. Digital images of sections were taken using an image analysis system under reflected light (1280 × 1024 resolution). To increase the contrast between adjacent growth bands, images were digitally enhanced using Adobe Photoshop 7.0® (Adobe Systems Inc. 2002). Centrum radius (CR) was measured to the nearest millimetre on these images with Optimas 5.2® (Meyer Instruments Inc. 2000), unless both section halves were broken during processing. Measurements were taken on each half bow tie from the base, which
is located just above the isthmus, to the distal edge along the intersection of the corpus calcareum with the intermediala. Rigorous validation studies, using several techniques, have confirmed that deposition of a single pair of opaque and translucent bands (growth increment) occurs annually in porbeagles from birth to an age of at least 26 years (Campana et al. 2002b; Natanson et al. 2002). To ensure the accuracy of age determinations in the present study, interpretation of annuli was calibrated with a reference collection of more than 500 sectioned vertebrae of known or consensusderived ages, used in the aforementioned studies. Samples from both time periods were then aged twice by the senior author, in a random order, following a double-blind procedure. Those deemed unreadable (recent sample, n = 31; historical sample, n = 26) were excluded from further analysis. The consistency of the new age interpretations with those published previously was evaluated using age-bias plots, and the coefficient of variation (CV) was used as a measure of precision (Campana et al. 1995). Some of the sample tags attached to dried, historical vertebrae had deteriorated, making it impossible to link these samples to Aasen’s recorded data. To estimate the lengths of these sharks, CFL was derived from a regression model fitted to the CFL–CR data or, in the absence of CR measurements, from the calculated relationship between CFL and CD. Both of these regressions were generated from a subsample of Aasen’s vertebrae for which TL was recorded. To compare growth characteristics between the virgin and exploited porbeagle populations, the von Bertalanffy growth © 2007 NRC Canada
22
Can. J. Fish. Aquat. Sci. Vol. 64, 2007
function (VBGF), as well as a reparameterized version of this model, were fitted to each set of length at age data using nonlinear least squares in Systat 10.0® (Systat Software Inc. 2002). The conventional VBGF (von Bertalanffy 1938; Ricker 1979) is expressed as Lt = L∞ [1 − e− K ( t − t0 ) ] where Lt is the mean length at age t, L∞ is the mean asymptotic length, K is the Brody growth coefficient, which determines how rapidly the horizontal asymptote is approached, and t0 is the mean age at length zero. The alternative parameterization was formulated by Francis (1988) as L = lφ + (lψ − lφ )(1 − r 2( T − φ )/ ( ψ − φ ) )/(1 − r 2) where r = (lψ − lχ)/(lχ − lφ ) The parameter L represents the mean length at age T, and lφ, lχ, and lψ represent the mean lengths at ages φ, (φ + ψ)/2, and ψ, respectively, which were selected to fall within the range of both data sets. In addition, locally weighted least squares regression (lowess) curves were used to describe patterns of growth during each time period and were fitted to length at age data using the Lowess function in SPSS 11.5.0® (SPSS Inc. 2002). Both the reparameterized and traditional von Bertalanffy growth models were used to test for statistical differences between the virgin and exploited length at age data sets. The reparameterized model was selected, because it overcomes two of the shortfalls of the conventional VBGF: the L∞ and K parameters tend to be strongly correlated and the estimation of some parameter values involves extrapolation (Francis 1988). Likelihood ratio tests were employed to test for differences in growth curves between the time periods (Kimura 1980). Of the most commonly used statistical procedures for growth curve comparison, this approach is considered to be the most accurate on the basis of empirical analyses conducted by Cerrato (1990). This test assumes a normal, additive error structure and equal variances between data sets. The validity of the latter assumption was assessed using a Bartlett’s test (Zar 1996). Male length at maturity in porbeagles is associated with a distinct inflection in clasper growth (Jensen et al. 2002). Differences in male length at maturity between time periods were evaluated by fitting a logistic growth model to each set of clasper length (CL) – CFL data using nonlinear least squares and comparing their inflection points, which were used as a common reference point. The model was formulated following Piner et al. (2005): y$ = y min + k [1 + exp(b (a − x))]−1 with fixed parameters y = CL, ymin = the minimum observed CL, and x = CFL and estimated parameters k = maximum observed CL – minimum observed CL, a = inflection point, and b = shape parameter. Length at female maturity, which corresponds with a marked increase in uterus development (Jensen et al. 2002), was clearly visible from graphs of uterus length versus CFL. The length at maturity for the virgin population, estimated from a plot of uterus growth, was
compared with the reproductive information from more recent years reported by Jensen et al. (2002). An analysis of historical porbeagle temperature associations was carried out using catch (number of sharks), effort (number of hooks per set), and fishing locations obtained from the 1965 logs of the Norwegian longliner M.S. Volstad. Vessel positions were given as Loran-A readings (to the nearest 5 µs) and were converted to latitude and longitude with LoranGPS 6.0® (Andren Software Co. 2005). Analyses were limited to the principal porbeagle fishing grounds extending north of Cape Cod, Mass. (Fig. 1). To estimate the temperature at the depth of the longline gear associated with each fishing location, we extracted temperature profiles from the year 1965 from the Atlantic Fisheries Adjustment Program database (Bedford Institute of Oceanography, Dartmouth, Nova Scotia). Temperatures were averaged over the depth range (10–30 m) at which the Norwegian fleet set the longline hooks (Aasen 1963). Contour maps displaying temperature at mean gear depth, overlaid with catch per unit effort, were then produced for each month and area (e.g., Grand Banks) in which porbeagles were caught. Temperatures at fishing locations were estimated from these maps only if fishing sites were bounded on all sides by temperature contours. The same set of contour maps was used to determine the range of temperatures available to porbeagles in areas surrounding fishing sets (environmental temperature). Broad fishing areas, which included the Gulf of Maine, Grand Banks, and Gulf of St. Lawrence, were delineated on the maps by polygons enclosing all of the 1965 fishing locations. Temperature observations lying within these polygons were drawn from the maps along a 30′ latitude × 30′ longitude grid pattern. To identify porbeagle temperature associations, we compared cumulative distribution functions (CDFs) of two variables: temperature at fishing locations, weighted by catch per unit effort, and environmental temperature (Perry and Smith 1994). Cumulative distribution functions were generated with temperatures pooled across months (May–August) and areas because of limited data availability. Disparities between CDFs imply that porbeagles prefer a particular temperature range, whereas similarities suggest a lack of association between porbeagle catch and specific temperature conditions within the range available in the environment. Results were compared with findings from a similar analysis of temperature profiles from 1994 to 2000 (Campana and Joyce 2004).
Results Aged specimens from the exploited population consisted of 291 males, 290 females, and 3 of unknown sex ranging in size from 77 to 261 cm CFL (Table 1). Those collected from the virgin population included 34 males, 43 females, and 126 samples that could not be matched to Aasen’s recorded data and, therefore, were of unknown sex and body length (Table 1). These sharks had a CFL range of 70 to 245 cm. The coefficient of variation for the replicated age readings was 7%. The modeled CFL–CR and CFL–CD relationships were used to reconstruct body lengths of 107 and 19 historical © 2007 NRC Canada
Cassoff et al.
23
Table 1. Summary of vertebral samples used to reconstruct growth in the virgin (1961–1966) and exploited (1993–2004) porbeagle (Lamna nasus) populations. Sample size
CFL of males (cm)
CFL of females (cm)
Unknown sex
Total
Min
Max
Min
Max
10 20 11 0 1 1
0 0 0 126 0 0
23 37 14 126* 1 2
112 132 96 92 — 70
176 220 226 231 — 70
103 125 90 92 146 72
164 216 245 231 146 72
34
43
126
203
70
226
72
245
3 17 75 1 3 31 19 13 0 7 9 0 64 7 1 28 10 1 0 1 0 1 0 0 0
0 16 66 1 6 17 19 15 2 4 15 1 80 13 0 26 3 0 1 1 0 1 1 1 1
0 0 0 0 0 0 0 0 0 0 1 0 0 0 0 0 0 0 0 0 1 0 0 0 1
3 33 141 2 9 48 38 28 2 11 25 1 144 20 1 54 13 1 1 2 1 2 1 1 2
182 104 77 156 105 113 89 92 — 135 170 — 95 107 148 99 162 97 — 159 236 189 — — 97
219 239 232 156 144 202 216 226 — 208 232 — 246 240 148 230 201 97 — 159 236 189 — — 102
— 101 97 193 128 110 90 101 95 167 113 169 94 200 — 100 184 — 183 202 236 139 100 224 97
— 203 241 193 228 181 192 240 167 220 236 169 256 261 — 242 221 — 183 202 236 139 100 224 102
291
290
3
584
77
246
90
261
Area
Season
Year
Males
Virgin Gulf of Maine
Summer
Scotian Shelf Grand Banks Southeastern US Unknown
Summer Summer Spring Unknown
1961 1962 1961 1961 1966 1965
13 17 3 0 0 1
Total
—
—
Summer Spring
Winter Unknown
1999 1994 1999 1997 1999 2004 1993 1999 1999 1999 1993 1997 1999 1999 1993 1999 1997 1999 1993 1997 1999 1996 1997 1996 —
—
—
Exploited Gulf of Maine
Summer
Autumn
Grand Banks
Winter Spring Autumn
Gulf of St. Lawrence
Winter Autumn
Unknown
Spring Summer
Autumn
Total
Females
Note: Sample size and curved fork length (CFL) range are given separately for each sex by sampling area, season, and year. Seasons: spring, March– May; summer, June–August; autumn, September–November; winter, December–February. Min, minimum; max, maximum. *Fork lengths were reconstructed from vertebral size.
samples, respectively, for which only centrum measurements were available. CFL and CR displayed a moderately curvilinear relationship, which was linearized by applying a loge– loge transformation (Fig. 2). The least squares equation calculated from the transformed data was loge (CFL) = 0.74 loge (CR) + 3.21
(n = 76, r 2 = 0.95)
In the case of the CFL and CD data, the untransformed relationship provided a better fit: CFL = 5.08CD + 24.05
(n = 74, r 2 = 0.94)
Both linear regressions were highly significant (P < 0.0001), and neither differed significantly between the sexes (analysis of covariance, ANCOVA, P > 0.7). Plots of length at age data for the sexes combined (Figs. 3 and 4) indicated that porbeagles from the virgin population grew more slowly throughout most of the observed age range. Age estimates ranged from 0 to 23 years in 1961– 1966 and from 0 to 24 years in 1993–2004. In the virgin population, the youngest age classes (