Under the conditions of a space flight (SF), the lack of supporting loads on the skeleton has an adverse effect on the strength of bones and structure of the bone ...
ISSN 0362�1197, Human Physiology, 2012, Vol. 38, No. 7, pp. 727–731. © Pleiades Publishing, Inc., 2012. Original Russian Text © I.V. Prostyakov, B.V. Morukov, I.B. Morukov, 2010, published in Aviakosmicheskaya i Ekologicheskaya Meditsina, 2010, Vol. 44, No. 3, pp. 24–28.
EXPERIMENTAL AND GENERAL THEORETICAL STUDIES
Changes in Bone Mineral Density and Microarchitecture in Cosmonauts after a Six�Month Space Flight I. V. Prostyakov, B. V. Morukov, and I. B. Morukov Institute of Biomedical Problems, Russian Academy of Sciences, Moscow, 123007 Russia Received April 19, 2010
Abstract—The effect of microgravity on the bone tissue of cosmonauts has been studied after a six�month space flight. The volumetric bone mineral density (VBMD) and the bone structural characteristics of distal segments in the radius and tibia have been studied by means of peripheral quantitative computed tomography (pQCT). The changes in VBMD were found to correlate with the position of the bone relative to the vector of gravity. In the radius, reversible hypermineralization, together with thickening of the compact bone were recorded. In the tibia, reversible osteopenia was characterized by significant losses in both compact and tra� becular bones. Irrespective of the position relative to the vector of gravity, there was a trend towards microar� chitectural deterioration, such as a decrease in the trabecula number and increase in the bone tissue hetero� geneity. Postflight dynamics of structural parameters showed an integrative character with nonlinear time dependence. DOI: 10.1134/S0362119712070201
Under the conditions of a space flight (SF), the lack of supporting loads on the skeleton has an adverse effect on the strength of bones and structure of the bone tissue [3]. A decrease in the bone mass and changes in bone structure increase the risk of traumatic injuries in cos� monauts and may be significant obstacles to an increase in the duration of SFs. Predicting the levels of mineralization and changes in bone structure can help develop measures aimed to adapt cosmonauts to long flights. Previous densitometry studies have definitely indi� cated osteopenia in the proximal femur, as well as a ten� dency towards an increase in the bone mass in the upper half of the skeleton [2, 4]. In this study, we have assessed the changes occurring in the same parts of the skeleton by means of pQCT, which is a relatively new technique [8]. EXPERIMENTAL Our experiment was based on the ESA�RA�LS�01� Flight/TF005 Program of the European Space Agency (ESA), academic and applied research and experiments on the Russian segment (RS) of the International Space Station (ISS), and the LSRP EDOS_12042005 proto� col on February 9, 2007. During the SF, the cosmonauts stayed in the RS of ISS; and the examinations of cos� monauts were performed before and after the SF, ground�based. The experiment involved prime crew members of the 15th to 20th missions who had performed SFs. The total number of subjects was six. All the subjects had signed their informed consent to participate in the experiment.
Quantitative studies of the bone tissue were per� formed using XTREMECT computed tomography 30 days prior to the SF and on the first, 90th, and 180th days after landing. XTREMECT provides three�dimensional quantita� tive computed tomography (3D�pQCT), i.e., measure� ment of bone mineral density and analysis of the bone microarchitecture in human limbs. Currently, XTREMECT is successfully used in some countries in the clinic for diagnosis of patients with bone pathology [5, 11]. In the EDOS experiment, distal radius and tibia were studied in cosmonauts. The instrument has an international radiation and electrical safety standard IEC 60601 of the European Union. Specifications of XTREMECT are shown in Table 1. The effective dose of one standard measurement was 3 µSv. For each subject, the total effective dose through� out the experiment was 36 µSv. In order to obtain the most accurate results, measur� ing equipment was started up 2 h before the study for warming up and calibration. The measurements were performed in a quiet room with normal humidity. In order to prevent electrostatic damage of the equipment, an electrostatic bracelet was used. The measurements were performed in the non� dominant arm or leg. The duration of the measure� ments for each subject was limited to 30 min (one mea� surement for the radius and one for the tibia). The technique used for data processing and scan� ning has been previously described in detail [6, 8, 10]. When scanning a bone, the average bone volumetric
727
728
PROSTYAKOV et al.
Table 1. Technical specifications of XTREMECT Mass, kg
475
Sizes, height × width × depth, m
1.38 × 0.93 × 1.46
Electric power supply, W, Hz, A
208–230, 50–60, 10
Width of scanning area, mm
126
Length of a scanning object, no less than, mm
150
Resolution, lines of image per mm
4
Isotropic size of voxel, µm
82
Image matrix, pixel × pixel
1536 × 1536
Detector size, pixel × pixel
3072 × 255
Detector size, mm × mm
170 × 14.5
X�ray tube
Voltage, kW
60
Current, A
0.001
Power, W
bone mineral density (VBMD), (D100, mg/cm3) was calculated. By means of a thresholding algorithm, the cortical and trabecular parts were automatically determined in the bone region studied. One�third of the numerical value of BMD measured for clearly visible cortical bone (Dcomp, mg/cm3) was taken to be the threshold value. The average thickness of cortical bone (CtTh) was determined by dividing the average volume of a cortical bone on the surface area of the bone. The trabecular bone density was calculated as the average density throughout the trabecular area (Dtrab, mg/cm3.) For the trabecular region, the average VBMD of the exter� nal layer (Dmeta, mg/cm3), average VBMD of the internal layer (Dinn, mg/cm3), and their ratio (Meta/Inn) were calculated separately. The volume fraction of the trabecular bone (BV/TV) was calculated by dividing the numerical value of Dtrab on the arbi� trary density of a fully mineralized bone (1200 mg/cm3). Since the thickness of trabeculae can� not be measured accurately because of the partial vol� ume effects, we used a special algorithm to assess the trabecular structure [9]. At the first step, the method of converting median axes was used to identify the trabec� ular elements; the distance between the elements was determined using the method of the transformation of distances [6]. The number of trabeculae (TbN, mm–1) was determined by inversion of the middle step of the median axes and, hence, it was truly three�dimensional. The thickness of trabeculae (TbTh, mm) and the distance between them (TbSp, mm) were determined from the values of BV/TV and TbN by calculating the standard histomorphometric equations TbTh = (BV/TV) / TbN and TbSp = [1 – (BV/TV)/TbN] [14]. The distance transformation technique enables us to calculate the standard deviation of the distance between
60
trabeculae (TbSp SD, mm), which serves as a measure of the heterogeneity of the trabecular network (Tb.1/N.SD). For each subsequent measurement, the algorithm automatically uses the cross�sectional area within the periosteal boundary of the radius or tibia to determine the compliance of areas under study for the first and all subsequent scans. Thus, when estimating the VBMD and microarchitectural parameters, only the amount of bone that was common with that at previous measure� ments was used [7]. For the area under study, 110 slides were obtained, and an average of 100–105 were common for subse� quent scans. Note the high reproducibility of the mea� surements; according to the manufacturer, the variation coefficient is no more than 0.3% for the values of VBMD [15] and 2–3% for the structural parameters. Statistical analysis was performed using the StatSoft Statistica 6.1 software. The significance of changes was tested using the Wilcoxon test for dependent samples and the Friedman test for repeated modifications. RESULTS AND DISCUSSION Examination in the background period showed a high individual variability in the values of VBMD, which may be due to a genetic determinacy of the dynamics of the bone mass [1]. Postflight examinations of the radius (Table 2) con� firmed the phenomenon of hypermineralization of the bones in the upper half of the body after a prolonged SF, which has been described earlier [4]. An increase in VBMD D100 of the radius (individual changes in the range +0.31–4.1%) and thickening of the cortical layer CtTh (individual changes in the range +0.89–6.86%) were recorded. HUMAN PHYSIOLOGY
Vol. 38
No. 7
2012
CHANGES IN BONE MINERAL DENSITY AND MICROARCHITECTURE
729
Table 2. Changes in volumetric mineral density (VBMD) and structural characteristics of the bone tissue after a 6�month SF (M ± m, n = 6) Parameter
Radius, %
Tibia, %
D100, mg HA/cm3
+1.03 ± 0.68*
–1.38 ± 1.01
Dtrab, mg HA/cm3
–0.08 ± 1.58
–0.79 ± 0.54
Dmeta, mg HA/cm3
–1.12 ± 0.87
–1.20 ± 0.43*
+1.24 ± 2.53
–0.71 ± 1.42
Dinn, mg
HA/cm3
Meta/inn
–1.78 ± 1.56
–0.61 ± 1.47
BV/TV
–0.01 ± 1.55
–0.87 ± 0.61
Tb.N, 1/mm
–1.82 ± 3.4
–1.83 ± 2.37
Tb. Th, mm
+2.72 ± 5.56
+1.57 ± 3.2
Tb. Sp, mm Tb.1/N. SD, mm Dcomp, mg
HA/cm3
Ct. Th, mm
+2.5 ± 3.54
+2.39 ± 2.59
+1.66 ± 3.22
+2.06 ± 2.34
+0.46 ± 0.72
–1.42 ± 0.46*
+2.81 ± 1.06*
–2.64 ± 2.25
Note: n = 6; * significant difference with the background, p < 0.05.
This is apparently the response of the musculoskele� tal system to a dramatic increase in the loads on the shoulder girdle under the conditions of microgravity, rather than merely a result of redistribution of liquid media due to the altered gravity [4]. In the trabecular bone, there was a trend towards a decrease in VBMD; in five of six subjects, the trabecular bone density (Dtrab) decreased (individual changes in the range from –0.59 to –2.84%). However, largely due to the thickening of the cortical bone, this reduction had no significant effect on the average BMD D100. In four subjects, the negative dynamics of the relationship Meta/Inn has been recorded (individual changes in the range from –1.09 to –8.74%), which suggests the formation of a gradient of the VBMD internal radius and, consequently, an increase in the heterogeneity of the trabecular network (individual changes in the range +0.53–14.56%). In those subjects, a decrease in the trabecula number was recorded (individual changes in the range from –1.64 to –15.87%). This enables us to consider a phenomenon similar to the aging of bones accompanied by thinning and punching of trabeculae, as well as changes in the degree of their continuity [12]. In the recovery period (figure), the parameters of VBMD in the radius (Dmeta, Dinn, Dtrab, and Dcomp) gradually returned to the normal levels begin� ning from the 90th day; and on the 180th day, they were almost the same as in the preflight period. Microarchitectural parameters were characterized by integrated dynamics. On the 90th day after landing, their changes reached their maximum values. The tra� becula number significantly decreased compared to the preflight levels, by an average of –8.4 ± 6.3% (in one subject, by –21.1%); and the thickness of trabeculae HUMAN PHYSIOLOGY
Vol. 38
No. 7
2012
and the heterogeneity of the trabecular network increased. On the 180th day of the experiment, the parameters of bone microarchitecture returned to the normal level, except for the thickness of the cortical layer, which remained above the preflight levels (+2.2 ± 0.8%). Postflight examinations of the tibial bone (Table 2) confirmed the results of previous long�term densitome� try studies [4], according to which the BMD in the lower part of the body decreases after prolonged SFs. On the first day after the flight, D100 had no significant changes in the whole group (–1.4 ± 1%); however, this parameter decreased in three out of six subjects. Negative dynamics of Dcomp (–1.4 ± 0.5%) and Dmeta (–1.2 ± 0.4%) were recorded in all subjects. The maximum losses of the bone mass amounted to –3.05% for the Dcomp and –2.39% for Dmeta. Thus, the loss of the mineral component was almost equal in the trabecular and compact bones. Analysis of the dynamics of the parameters of trabecular microar� chitecture shows a trend towards deterioration of the bone tissue. Thus, the average number of trabeculae decreased in four subjects (individual changes in the range 1.02– 12.69%), which was accompanied by an increase in the heterogeneity of the trabecular network (individual changes in the range +1.52–12.38%). On the 90th day, in these subjects, positive dynamics of the structural characteristics was recorded (figure); the trabecula number increased (+4.7 ± 3.1%), and the heterogene� ity of the trabecular network decreased (–5.9 ± 3.5%) compared to the first few days after the flight. On the 180th day after landing, further normalization of the trabecular network was observed.
730
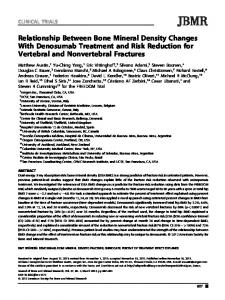
PROSTYAKOV et al. (a) 109 107 105 103
D100, mg HA/cm3 Dtrab, mg HA/cm3 Dmeta, mg HA/cm3 Dinn, mg HA/cm3 Dcomp, mg HA/cm3 Ct. Th, mm Tb. N, 1/mm Tb.1/N.SD, arb. units
101 %%
99 97 95 93 91 + 1 days 103
+ 90 days (b)
+ 180 days
102 101
D100, mg HA/cm3 Dtrab, mg HA/cm3 Dmeta, mg HA/cm3 Dinn, mg HA/cm3 Dcomp, mg HA/cm3 Ct. Th, mm Tb. N, 1/mm Tb.1/N.SD, arb. units
100 %% 99 98 97 96 + 1 days
+ 90 days
+ 180 days
Dynamics of the changes in volumetric mineral density (VBMD) and structural characteristics of the bone tissue (in percentage to the background) after 6 months of SF: A, radius; B, tibia.
The postflight dynamics of VBMD of the tibia did not indicate full recovery for the period of 180 days; Dmeta and Dcomp were still below the prefight values. This agrees with the previous data [4] indicating that the recovery time of the tibial bone may significantly exceed the duration of the mission. Thus, this study has revealed some features of the dynamics of BMD and parameters of the bone structure after an SF. It has been shown that the gradient of VBMD, as well as the gradient of projection BMD, is determined by the position relative to the gravity vector. The phenomenon of hypermineralization in the radius can be explained by an increase in the VBMD of the compact bone. A decrease in BMD of the tibia is not selective: the losses in BMD are approximately equal in the trabecular and in cortical bones. The aging of a bone, which consists in a decrease in trabecula number and increase in heterogeneity of the trabecular network, is apparently the primary reaction of the bone (regard� less of the position relative to the gravity vector) to the lack of supporting loads [12, 13]. Note that this process is sometimes hidden and does not affect the value of the VBMD. The process of recov� ery of bone mass and trabecular microarchitecture in
the radial and tibial bones occurs in different ways and has its own characteristics; the recovery to the preflight level requires at least 180 days. The changes in VBMD and structural organization of bone tissue often exhibit large individual variations. In some cases, these changes are pronounced; this raises some doubt as to the neces� sity of the total use of preventive measures before SFs. REFERENCES 1. Benevolenskaya, L.I. and Finogenova, S.A., Genetics of Osteoporosis; A Study on the Importance of Genetic Factors in Determination of Diseases, Osteopor. Osteo� patii, 1999, vol. 5, no. 2, p. 23. 2. Grigor’ev, A.I., Oganov, V.S., Bakulin, A.V., Polya� kov, V.V., Voronin, L.I., Morgun, V.V., Shnaider, V.S., Murashko, L.V., Novikov, V.E., LeBlank, A., and Shak� leford, L., Clinical and Physiological Evaluation of Bone Changes among Astronauts after Long�term Space Flights, Aviakosm. Ekol. Med., 1998, vol. 32, no. 1, p. 21. 3. Oganov, V.S., Kostnaya sistema, nevesomost' i osteoporoz (The Bone System, Microgravity, and Osteoporosis), Moscow, 2003. 4. Oganov, V.S. and Bogomolov, V.V., Human Bone System in Microgravity: Review of Research Data, Hypotheses HUMAN PHYSIOLOGY
Vol. 38
No. 7
2012
CHANGES IN BONE MINERAL DENSITY AND MICROARCHITECTURE
5.
6.
7.
8. 9.
10.
and Predictability of Musculoskeletal System State in Extended (Exploration) Missions, Aviakosm. Ekol. Med., 2009, vol. 43, no. 1, p. 3. Boutroy, S., Bousein, M.L., Munoz, F., and Delmas, D., In Vivo Assessment of Trabecular Bone Microarchitec� ture by Highresolution Periphera Quantitative Com� puted Tomography, J. Clin. Endocrin. Metab., 2005, vol. 90, no. 12, p. 6508. Hildebrand, T. and Ruegsegger, P., Quantification of Bone Microarchitecture with the Structure Model Index, Comput. Methods Biomech. Biomed. Engin., 1997, vol. 1, no. 1, p. 15. Laib, A., Hildebrand, T., Hauselmann, H.J., and Rueg� segger, P., Ridge Number Density: a New Parameter for in Vito Bone Structure Analysis, Bone, 1997, vol. 21, no. 6, p. 541. Laib, A., Hausemann, H.J., and Ruegsegger, P., In Vivo High Resolution 3D�QCT of the Human Fore� arm, Technol. Heath Care, 1998, vol. 6, nos. 5–6, p. 329. Laib, A. and Ruegsegger, P., Comparison of Structure Extraction Methods for In Vivo Trabecular Bone Mea� surements, Comput. Med. Imaging Graph, 1999, vol. 23, no. 2, p. 69. Laib, A., Newitt, D.C., Lu, Y., and Majumdar, S., New Model�Independent Measures Trabecular Bone Struc�
HUMAN PHYSIOLOGY
Vol. 38
No. 7
2012
11.
12.
13.
14.
15.
731
ture Applied to in Vivo High�Resolution MR Images, Osteopor. Int., 2002, p. 130. Laib, A. and Koller, B., A New 100 Micron Resolution Scanner for In Vivo 3D�CT of the Human Forearm and Lower Leg, in 16th International Bone Densitometry Workshop, Annecy, 2004. Parfitt, A.M., Mathews, C.H., Villanueva, A.R., Kleerekoper, M., Frame, B., and Rao, D.S., Relation� ships between Surface, Volume, and Thickness of Iliac Trabecular Bone in Aging and in Osteoporosis. Implica� tions for the Microanatomic and Cellular Mechanisms of Bone Loss, J. Clin. Invest., 1983, vol. 72, no. 4, p. 1396. Thomsen, J.S., Morukov, B.V., Vico, L., Alexandre, C., Saparin, P.I., and Gowin, W., Cancellous Bone Struc� ture of Iliac Crest Biopsies Following 370 Days of Head� Down Bed Rest, Aviat. Space Environ. Med., 2005, vol. 10, no. 10, p. 915. Voge, H., Hahn, M., and Delling, G., Quantitative Anal� ysis of Trabecular Bone Structure: 22nd European Sym� posium on Calcified Tissue (March 10–14, 1991, Vienna, Austria), Calif. Tissue Int., 1991, vol. 48. XTREMECT, User’s Guide. TD�181 Rev. 5.05 / Date of release 18 July 2005. SCANCO MEDICAL AG Fabrik� weg 2 CH�8306 Bruettisellen, Switzerland.