TECHNICAL PAPER
ISSN 1047-3289 J. Air & Waste Manage. Assoc. 53:1011–1021 Copyright 2003 Air & Waste Management Association
Changes in Physical Properties of a Compost Biofilter Treating Hydrogen Sulfide Juan M. Morgan-Sagastume and Adalberto Noyola Institute of Engineering, National Autonomous University, Mexico City, Mexico Sergio Revah Processes and Hydraulics Department, Metropolitan Autonomous University, Iztapalapa, Mexico Sarina J. Ergas Department of Civil and Environmental Engineering, University of Massachusetts, Amherst, Massachusetts
ABSTRACT A technique is presented that can be used to estimate the changes in physical structure in a natural biofilter packing medium, such as compost, over time. The technique applies information from tracer studies, grain size distribution, and pressure drop analysis to a model that estimates the number of channels, average channel diameter, number of particles, and specific surface area of the medium. Important operational factors, such as moisture content, pressure drop, and sulfate accumulation also were evaluated both in a conventionally operated biofilter and in one operated with periodic compost mixing. In the conventionally operated laboratory-scale compost biofilter, hydrogen sulfide (H2S) removal efficiency decreased from 100% to ⬃90% over 206 days of operation. In a similar system, operated with compost mixing, the H2S removal efficiency was maintained near 100%. Variations in media moisture conditions and specific surface area can explain the results observed in this study. Under conventional operation, drying near the inlet disintegrated the compost particles, producing a large number of particles and flow channels and increasing the specific surface area. At
IMPLICATIONS Over long periods of operation, the removal efficiency of conventionally operated compost biofilters decreases because of drying, channeling, and reduction in specific surface area. The results of this research demonstrate that, using media mixing, the removal efficiency can be maintained near 100%. To avoid channeling, as well as to achieve constant media moisture content, particle size and gas distribution, void fraction, and general homogeneity, periodic media mixing with controlled water addition is recommended.
Volume 53 August 2003
the top of the column, where moisture was added, particle size increased and specific surface area decreased. In the column with media mixing, moisture content, particle size, and specific surface area remained homogeneous. INTRODUCTION Compost-based biofiltration is one of the most important biological processes applied to treat waste gases and to control odors. This system is based on the interaction of gas-phase pollutants in an organic media, such as compost. The degradation activity derives from microorganisms that live and develop in the media. Undesirable compounds in the gas are absorbed and degraded by the microorganisms. Three important general factors that determine compost biofilter performance are (1) the quality of the filter media (including temperature, void fraction, particle size, moisture content, microbial diversity, and nutrients), (2) the prevailing conditions of gas flow inside the biofiltration unit (including superficial velocity, gas distribution, and inlet pressure), and (3) the substrate solubility, degradability, and loading rate applied. Research efforts must be focused on the biofilter media to upgrade the performance of compost biofilters. Biofilters are living pollution control systems and are subject to dynamic changes. Experimental data1–5 show an initial increase and subsequent drop in contaminant removal efficiency, especially in biofilters that are operated for a long time. The initial improvement in performance can be explained by growth and acclimation of the microbial population.6,7 Alonso et al.2 stated that the key reason for the subsequent drop in removal efficiency is the reduction in the specific surface area of the biofilm caused by biomass accumulation. However, in compost biofilters, the specific Journal of the Air & Waste Management Association 1011
Morgan-Sagastume, Noyola, Revah, and Ergas surface area can decrease, independent of biomass accumulation, because of channeling, media compaction, drying, and particle agglutination. As the media undergo these processes, there is a gradual decrease in the specific surface area and a decrease in gas retention time. A number of studies have shown that media mixing can restore biofilter performance in aged systems by decreasing channeling, improving gas distribution, and by controlling moisture.8 –13 A number of mathematical models have been developed to describe the internal physical, chemical, and biological processes that occur in a biofilter. Some of these models analyze substrate removal using first-order kinetics under steady-state conditions.1,14,15 Other kinetic models take into account the substrate mass transfer from the gas phase to the biofilm, simultaneously considering convection, diffusion, and reaction under either steadystate or dynamic conditions.16 Other models have been developed that consider the addition of activated carbon,17,18 the influence of oxygen concentration,19 and substrate adsorption on bed particles.20,21 Zarook et al.10 presented a model that can be used under dynamic conditions where gas axial dispersion effects, adsorption of substrate onto the packing material, and the potential limiting effects of oxygen were considered. These models can be fit to substrate removal profiles and provide general information about whether the reaction rate is zero or first-order and whether the degradation process is kinetic or mass transfer-limited. Models have also been developed that give information about the internal changes in the biofilter media, such as substrate adsorption capacity, formation of biolayers around solid particles, and biolayer thickness.2,13,22 However, these models do not consider parameters related to the internal physical structure, such as the number of particles, particle size distribution, number of flow channels, and channel size. The objective of this project is to describe the changes in media physical structure in compost biofilters treating hydrogen sulfide (H2S). A model was developed that estimates the number of particles, number of flow channels, average channel size, and specific surface area in a packed bed. Pressure drop, particle size distribution, and tracer studies were performed periodically to calibrate the model. In addition, the effect of media mixing on the maintenance of media physical structure and biofilter performance was evaluated.
fraction. The model does not take into account biomass growth or particle arrangement in the bed. The flow channel model is based on four equations: two for specific surface area; one that allows the estimation of channel diameter based on a series of parallel, cylindrical channels in the bed; and one for average and sieve particle diameter as a function of sphericity. Pressure drop profiles and the average retention time of an inert tracer were used to estimate average particle diameter and void fraction, respectively.
THEORETICAL DEVELOPMENT The flow channel model developed during this study estimates the number of particles, number of flow channels, average channel size, and specific surface area in a packed bed. The model assumes uniformly shaped solids that are defined by particle diameter, sphericity, and bed void
Levenspiel25 proposed an experimental method to estimate using granulometry studies. The equation that relates to dp and the average wire sieve diameter, ds (m), is
1012 Journal of the Air & Waste Management Association
Flow Channel Model This mathematical model is based on a conceptual model of the packed bed as a series of parallel, cylindrical channels that carry the gas flow from the inlet to the outlet of the biofilter. Assuming that the external area of the channels is equal to the area of the particles in the bed and the void volume of the bed is equal to the sum of the volumes of all the channels, the following equation can be used to calculate dc (m), the diameter of the channels:23
dc ⫽
ε 2 d 3 p1⫺ε
(1)
where ε is the bed void fraction or effective porosity (dimensionless), is the sphericity factor for the packing material (dimensionless), and dp is the average particle diameter (m). The specific surface area of the channels, ac (m2/m3) can be estimated by
ac ⫽
ndcL AL
(2)
where n is the number of channels (dimensionless), L is the bed height (m), and A is the cross-sectional area of the biofilter (m2). Estimation of Parameters The specific surface area of the biofilter medium, a0 (m2/m3), can be estimated from the particle diameter, dp, the void fraction, and the sphericity using the following equation:24
a0 ⫽
6共1 ⫺ ε兲 d p
d p ⬵ ds
(3)
(4) Volume 53 August 2003
Morgan-Sagastume, Noyola, Revah, and Ergas where ds is determined from the granulometry data using the following:25
冋冘 册 m
ds ⫽
i
⫺1
xi di
(5)
where di (m) is the average mesh size of the wire sieves where a mass fraction xi (dimensionless) was caught. The average particle diameter, dp, can be estimated using pressure drop profiles and the quasi-empirical Ergun equation, which takes into account the dependence of viscous and kinetic energy losses on void fraction:26 –28 ⌬P 150共1 ⫺ ε兲 2 U 0 L 1.75共1 ⫺ ε兲U02L ⫹ ⫽ gcε3dp g c ε3dp2
冘 冘
tiCti⌬ti Cti⌬ti
(7)
where tr is the average gas retention time (sec); Cti is the tracer concentration (mg/L) at a specified time I, and ⌬ti is the difference between ti and tI⫺1. Considering the definition of retention time, the void fraction can be calculated using the average time calculated from eq 7 as follows:
ε⫽
t rQ AL
(8)
where Q is the gas flow rate (L/min). This method has an advantage over the H2O displacement technique in that it allows estimation of the void fraction without affecting the physical structure of the bed. Number of Particles and Channels The number of channels in a packed bed, n, with particles whose form and arrangement are established by ε, , and ds can be estimated by rearranging eqs 1, 2, 3 and 4 to yield Volume 53 August 2003
9 共1 ⫺ ε兲 2 4 ε 4
冉 冊 dT ds
2
(9)
where dT is the biofilter diameter (m) considering that it is a cylinder. The number of particles (N) in a bed can be estimated by dividing the volume of the solids by the average volume of a particle (Vp):
N⫽
AL共1 ⫺ ε兲 Vp
(10)
where Vp is calculated using the equation for the volume of a sphere and eq 4. From this, the following equation is obtained to estimate the number of particles in a bed:
(6)
where ⌬P is the pressure drop across the bed (cm of water [H2O]), gc is the gravitational constant (1 kg m/sec2 N), is the air absolute viscosity (1.83 ⫻ 10⫺5 kg/m sec), U0 is the superficial air velocity (m/sec), and is the air density (0.927 kg/m3). To obtain dp, a pressure drop profile must be fit to eq 6 with the void fraction specified. The void fraction, ε, in a porous media can be estimated using tracer studies with inert gases. The following equation can be used for analyzing the retention time distribution (RTD) curve for a step tracer input:29
tr ⫽
n⫽
N⫽
3 共1 ⫺ ε兲L d T2 2 3 ds3
(11)
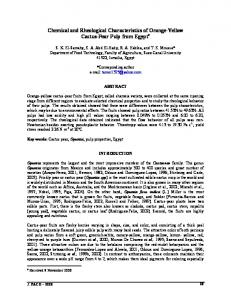
Linking Model Approaches Internal changes in biofilter media physical structure that affect system performance occur over time. The proposed channel flow model can be used to estimate the changes in the number of particles, number of flow channels, average channel size, and specific surface area in a biofilter over time. The procedure is outlined in Table 1. Void fraction is determined both by tracer studies and by H2O displacement only before biofilter operation to avoid saturating the bed while it is in operation. EXPERIMENTAL METHODS Experimental System A system consisting of four identical bench-scale biofilter columns was used to treat H2S in a moist air stream, as shown in Figure 1. Each of the columns (polyvinylchloride [PVC] columns, 0.101 m in diameter and 1.2 m in height) was filled to a height of 1 m with compost media. Each column had five gas and compost-sampling ports spaced 20 cm apart along the height of the media. The airflow rate was maintained at 10 L/min, which provided Table 1. Relation among models for characterizing filter media. Time
Step
Method
Parameter
Initial
1 2 3 4 5 1
Tracer studies (eqs 7, 8) Water displacement method Pressure drop studies with the Ergun equation (eq 6) Sieve tray analysis (eq 4) Flow channel model (eqs 1, 3, 9, 11) Tracer studies (eqs 7, 8)
, tr (confirmed) dp ds, dc, a0, n, N , tr
2 3 4
Pressure drop studies with the Ergun equation (eq 6) Sieve tray analysis (eq 4) Flow channel model (eqs 1, 3, 9, 11)
dp ds, dc, a0, n, N
Final
Journal of the Air & Waste Management Association 1013
Morgan-Sagastume, Noyola, Revah, and Ergas
Figure 1. Experimental setup, tracer studies, and biofiltration system.
a superficial loading rate of 74 m3/m2/day with an empty bed residence time (EBRT) in each column of 50 sec. The air supply for the columns was controlled using a Cole Parmer mass flow controller and calibrated rotameters. The columns were operated in upflow mode. Compressed air (using a HAGEN-100 diaphragm compressor) was passed through three PVC humidification columns (0.15 m in diameter and 1.2 m in height) packed with 0.9 m of Rashig rings. The humidification columns provided close to 100% relative humidity. A small controlled flow of H2S from a gas cylinder was mixed with the main humidified airstream, which then was fed to the bottom of two of the columns (I and II), resulting in an H2S concentration of 50 parts per million volume (ppmv) or 4 g H2S/m3/hr. A low loading of H2S was chosen to avoid inhibition caused by sulfate (SO42⫺) accumulation. The third and fourth columns (III and IV) were used as controls. Only a humidified air stream was fed to column III. Neither H2O nor gas was fed to column IV. The biofilter columns were located in a plastic enclosure on the roof of the Environmental Engineering Laboratory building at the barometric pressure of Mexico City (585 mm Hg) and at ambient temperature (20 ⫾ 5 °C). The biofilter media used was mature compost derived from food, leaf, and yard waste as well as horse manure. The compost was provided by the National University Compost Plant and was prepared in outdoor windrows. 1014 Journal of the Air & Waste Management Association
The compost used for filling the biofilters was analyzed at the beginning of the experiment. Columns I, II, III, and IV were analyzed at the end of the experiment. Columns I and II were operated for 141 and 206 days, respectively, using conventional operating criteria. Media moisture content was controlled using H2O addition at the top of the columns. Column I continued its operation for an additional 65 days (from day 142 until day 206), with media mixing every two days. Compost mixing was accomplished by removing the entire bed from the column, manually homogenizing the media, and then reincorporating it into the biofilter column. Less than 15 min was required for this operation. For the last 65 days of the experiment, H2O was added to column I during the bed mixing procedure. The H2O addition rate was based on a recommended H2O-air ratio of between 1.5 and 3 mL H2O per m3 of gas.30 This resulted in a H2O addition rate of 60 mL tap water every other day. The H2S concentration was measured in the inlet and along the length of the columns using electrochemical cells (SRII-U-100, BW Technologies). The cells were calibrated every 3 months using a known concentration (25 ppmv H2S) quality calibration/test gas (Lumidor calibration kit). SO42⫺ concentration, moisture content, and alkalinity were measured by removing small samples (⬃1 g) of compost from each sample port. The SO42⫺ concentration in the filter media was measured by the Volume 53 August 2003
Morgan-Sagastume, Noyola, Revah, and Ergas photometric method using Merck Spectroquant equipment (25 300 mg/L, 180 tests No. 114791). The moisture content of the compost was determined gravimetrically.31 Alkalinity, sieve analysis, and pH of the biofilter media were measured using the method reported by Klute.32 The sieve analysis was conducted using wet compost as obtained from the columns. Tracer Studies Butane gas was used as tracer for determining the RTD curves because it has very low solubility (1.26 mM at 298 K)24 and can be easily measured by the monitoring system. The tracer was injected into the columns using a pulse injection technique.29 A continuous sample was collected, using a gas sampling pump, from the gas sampling ports of the biofilter to a carbon dioxide (CO2) detector (Beckman Industrial total organic carbon [TOC] analyzer, Model 915B). A CO2 trap (potassium hydroxide [KOH], 1 M) in the tubing (located between the gas sampler and the TOC analyzer) was used to avoid interferences caused by CO2 contained in the air. An automatic data recording system (Peaksimple II for SRI chromatographs) was connected to the TOC analyzer to reproduce the RTD curve on a screen and printer. Three tracer injections (1 mL each) per tracer study were performed, and an average RTD curve was determined. Mathematical analysis was performed using an Excel spreadsheet program to determine average gas retention time (eq 7). Each tracer study was carried out using an airflow rate of 10 L/min. To assure minimum interaction between the tracer input and compost, the compost was saturated with butane before each tracer study. This was carried out using a constant butane input into the inlet airstream until a constant butane concentration of 1.5 mg/L was reached in the biofilter outlet. This technique resulted in almost 100% recovery of the tracer when the RTD curves were analyzed. Saturation of the compost with butane also allowed
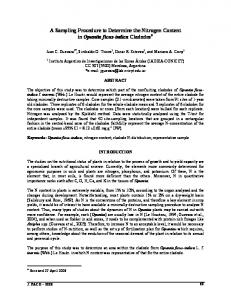
the calculation of a desorbtion curve. The butane loading was suddenly stopped, and the resulting desorbtion curve was used to calculate the quantity of butane sorbed to the compost. The difference between this value and the theoretical bed sorption capacity provided an additional estimate of the working void fraction in the bed. Pressure Drop A profile of pressure drop versus gas flow rate for the biofilters was fit to the Ergun equation (eq 6) to determine the average particle diameter of the biofilter media as a function of height. The biofilters were subjected to airflows from 10 to 70 L/min in 10 L/min increments to obtain plots of pressure drop versus gas flow rate. An H2O differential manometer was used for pressure drop measurements. The effect of the fine screen and other equipment at the bottom of each column was corrected for by subtracting the pressure drop provided by those elements from each pressure drop measurement. RESULTS AND DISCUSSION H2S Removal and SO42ⴚ Control H2S removal efficiency and compost media SO42⫺ concentration for columns I and II are shown in Figure 2. Initial H2S removal efficiency approached 100% and decreased to ⬃90% over 206 days of operation. Column I had practically the same behavior as column II during the first 141 days. However, after compost mixing was initiated, the H2S removal efficiency was maintained at close to 100% in column I. Media SO42⫺ concentration stabilized at 10 and 21 mg SO42⫺-S/g dry compost for columns I and II, respectively. SO42⫺ accumulation in the bed was caused by H2S oxidation to sulfuric acid (H2SO4). During the first 25 days of operation, the pH decreased from 7.5 to a stable value of 4.5 in both columns I and II. Degorce-Dumas et al.33
Figure 2. H2S removal efficiency and SO42⫺ accumulation (mg SO42⫺-S/g dry compost) as a function of time with and without media mixing. Volume 53 August 2003
Journal of the Air & Waste Management Association 1015
Morgan-Sagastume, Noyola, Revah, and Ergas reported that this pH range is Table 2. Experimental values for dp, , , a0, and moisture content. adequate for high H2S removal Distance Compost efficiencies. Similar observafrom Gas d Moisture a0a p tions were made by Wada et Inlet (mm) (%) (m2/m3) al.,34 who reported H2S removal close to 100% using a peat bioInitial compost sample 1.9 0.4 0.81 65 2880 filter at a controlled pH of 3.5. Column I Conventional operation over 141 days 20 0.5 0.38 0.81 31 11,300 SO42⫺ accumulation could 40 0.7 0.37 0.80 35 8400 be an important factor in the 60 1.2 0.34 0.81 40 5020 decrease in H2S removal. Smet 80 1.4 0.49 0.82 51 3250 and Van Langenhove35 noted 100 1.9 0.44 0.81 71 2690 that protons produced in a bioOperation with compost mixing over 65 days 20 1.8 0.38 0.82 51 3070 40 1.9 0.38 0.82 50 2910 filter displaced nutrient cations 60 1.7 0.38 0.82 51 3250 (e.g., sodium [Na⫹], potassium ⫹ 80 1.8 0.38 0.82 50 3070 [K ]) from the cation exchange 100 1.9 0.38 0.82 51 2910 sites on the compost material. Column II Conventional operation over 206 days 20 0.5 0.39 0.81 30 11,150 The authors found that 95% of 40 0.6 0.38 0.8 33 9680 2⫺ the SO4 was leached as the 60 1.1 0.36 0.82 39 5190 corresponding SO42⫺ salts and 80 1.7 0.49 0.82 51 2670 not as H2SO4. As a result, essen100 2.5 0.5 0.81 70 1820 tial nutrients were leached and Column III Compost column with humidified air and water flow 20 0.5 0.39 0.82 31 10,880 the pH of the biofilter media 40 0.6 0.39 0.81 32 9290 remained low. As shown in Fig60 1.2 0.4 0.82 41 4460 ure 2, the SO42⫺ concentration 80 1.7 0.48 0.81 55 2790 100 2.4 0.51 0.81 71 1860 in both biofilters was always 20 2.1 0.39 0.81 51 2650 lower than the inhibitory level Column IV Compost column with no flow 2⫺ 40 2 0.4 0.82 52 2670 of 25 mg SO4 -S/g dry com60 2.1 0.39 0.82 51 2590 post reported by Yang and 80 1.9 0.38 0.82 50 2910 36 Allen. Routine washing of the 100 1.9 0.38 0.82 50 2910 compost and compost mixing, in the case of column I, effec- a a0 was determined using eq 3. tively mitigated SO42⫺ accumuParticle Size. Based on the average particle diameter (herelation. after termed particle diameter) estimated by the pressure Between days 74 and 102, operation was suspended drop studies, there appeared to be an overall agglutinabecause of a failure in the H2S flow control, and neither tion of particles in columns I, II, and III. Column I (under H2S nor H2O were supplied to the bed. Biofilter perforconventional operation) had an increase in particle diammance was practically unaltered even though the gas feed eter of ⬃73% (0.5–1.9 mm) over 141 days. The increase in was stopped for 30 days. The biofilters recovered their particle diameter observed in column II (conventional normal H2S removal efficiency after 3 days, demonstratoperation) was close to 80% (0.5–2.5 mm) after 206 days. ing the versatility of the biofilters under shutdown situations. This operational capacity of biofilters has also been reported by Zarook et al.10
In both cases, a lack of media mixing resulted in a particle size distribution where the largest particles were located at the top of the column (gas outlet with H2O addition) and
Changes in Physical Structure The values determined for moisture content, dp, ε, , and
the smallest particles were at the bottom (gas inlet). The
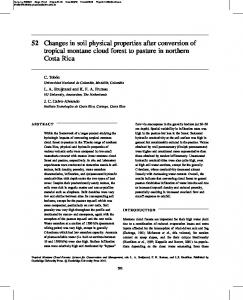
a0 for the initial compost sample as a function of biofilter height for all columns are shown in Table 2. The ratio between the values estimated by the flow channel model for the number of particles, number of channels, channel diameter, and specific surface area, and the initial compost characteristics for columns I, II, and III are shown in Figure 3.
moisture distribution. Dry compost with small particle sizes
1016 Journal of the Air & Waste Management Association
particle size distribution was closely associated with the was located at the bottom of the columns and wet compost and large particle sizes were located at the top. The addition of H2O to the top of the column did not adequately control media moisture. The constant distribution of particle size along the height of column I with media mixing is shown in Figure Volume 53 August 2003
Morgan-Sagastume, Noyola, Revah, and Ergas A small change was observed in particle diameter in the lower part (from 1.9 to 2.1 mm, 9.5%) for the biofilter column with no airflow (column IV) because of bed compaction by the bed weight itself. The difference between the initial and final column height was 6 cm. A similar amount of compaction was observed in columns II and III. Compaction in column I was completely avoided by media mixing. Sphericity. The sphericity of the particles remained nearly constant (⬃0.81 ⫾ 0.01) throughout the experiment in all of the columns, as shown in Table 2. Neither particle agglutination nor particle disintegration changes the geometric form of the particles. This result is in agreement with Karamanev et al.,37 who investigated the fractal structure of peat moss particles. They reported that a compost particle under magnification had a certain shape and when the magnification is increased, and one observes now a fragment of the first picture, the same shape can be observed, and so on. Because sphericity did not change significantly in compost, the granulometry test can be omitted from the procedure outlined in Table 1 after the initial characterization of the media.
Figure 3. Ratio between the values estimated by the flow channel model for the number of particles, N, 䡺; number of channels, n, F; channel diameter, dc, Œ; specific surface area, a0, ⌬; particle diameter, dp, E; and the initial compost characteristics for columns I (both conventional and with media mixing), II, and III. Based on experimental dp, , and (see Table 2), it was calculated that N ⫽ 510,000, n ⫽ 13,400, dc ⫽ 0.55 mm, and a0 ⫽ 2880 m2/m3 for the initial compost.
3. In this case, an average particle diameter of 1.82 ⫾ 0.08 mm was obtained, in contrast to the wide range obtained for conventional operation. Columns II (conventional operation) and III (H2O ⫹ humidified air) had similar particle size, moisture, and void fraction distributions. This shows that biomass growth and elemental sulfur (S) accumulation did not influence the physical structure of compost as much as did airflow and humidification. Volume 53 August 2003
Void Fraction. The initial void fraction of the compost was determined using both tracer studies and the water displacement method. The void fraction determined by the tracer study and water displacement method were 0.40 and 0.44 (9% difference), respectively, indicating that the void fraction estimated using tracer studies is the working void fraction rather than the entire void fraction available in the bed. The nonworking void fraction is the difference between the void fraction estimated by water displacement and tracer studies. The void fraction values reported in Table 2 were determined using tracer study measurements. The void fraction increased by 14 and 22% for columns I (conventional operation) and II, respectively. In column I with media mixing, the void fraction remained homogeneous at 0.38. The change in void fraction was closely related to changes in particle size, especially for the upper parts of the columns where H2O was added. Pressure Drop. A decrease in pressure drop was observed in column II (from 4.5 to 2.5 cm of H2O), probably because of the development of flow channels inside the filter media. Similarly, Allen and Phatak1 and Allen and Yang6 treating H2S and methyl mercaptan emissions in compost biofilters, respectively, stated that the buildup in pressure drop may be suddenly released by channeling. Pressure drop distribution profiles showed a linear relationship of pressure drop with height in column I when compost mixing was carried out. For each 20 cm of column height, Journal of the Air & Waste Management Association 1017
Morgan-Sagastume, Noyola, Revah, and Ergas an average pressure drop of 0.89 ⫾ 0.16 cm of H2O was measured. Number of Particles, Number of Flow Channels, and Specific Surface Area. The initial compost sample and column IV (no airflow) had similar internal characteristics compared with the major changes observed in columns I and II, as shown in Figure 3. As discussed previously, under conventional operation, compost drying disintegrated the compost particles, producing a large number of particles and flow channels. The greatest difference was observed in the first section of column I (20 cm height, 0.101 m diameter). In this section, the number of particles was estimated at 29 million, with an average diameter of 0.5 mm. There were 218,000 flow channels with 0.13 mm diameter. The original compost had 510,000 particles with a diameter of 1.9 mm and 13,400 flow channels with 0.55-mm diameter. As expected, the specific surface area had a huge increase, from 2880 to 11,300 m2/m3. The moisture profile in column I indicates that it was operated under a drying process. Similar behavior can be observed (see Figure 3) for column II until the fourth section, which had 65 more days of conventional operation than column I. Even if the specific surface area was increased because of particle disintegration, the potential increase in H2S degradation was limited by a lack of moisture and microbial activity. The fifth section of column II shows an inverse process may be occurring because of excess H2O addition. In this case, the particle diameter increased by 31% over the initial value. The number of particles and number of channels were 180,000 and 4300, respectively. In this case, the moisture content is higher than in the lower parts of the column; however; the specific surface area available for mass transfer decreased (1820 m2/m3). This specific surface area obtained by the flow channel model
agrees with the specific surface area estimated by Baltzis et al.38 of 1900 m2/m3 for a peat biofilter. The effect of specific surface area reduction on biofilter removal capacity was quantified using the following first-order kinetic model based on convection-diffusionreaction (CDR) phenomena presented by Ottengraf and Van den Oever:16
冋
C ge Da0LRT ⫽ exp ⫺  Tanh共兲 Cg0 HeU0␦
册
(12)
and
⫽
冑
k␦ 2 D
(13)
where Cge is the effluent H2S concentration (mol/m3), Cg0 is the H2S concentration in the inlet gas stream (mol/m3), D is the diffusion coefficient in liquid phase (m2/sec), He is the Henry constant (m3/mol), T is the temperature (K), R is the ideal gases constant (Pa m3/mol/K), ␦ is the biofilm thickness (m), k is the reaction rate constant (sec⫺1) and  is the Thiele number. This model was fit to the experimental data obtained from column I on day 206, when the column was working well under media mixing conditions, as shown in Figure 4. A biofilm thickness (␦) of 40 m was assumed based on the range of 20 –50 m reported by Baltzis et al.38 for a peat biofilter treating volatile organic compounds (VOCs). The H2S diffusivity in H2O is 1.61 ⫻ 10⫺9 m/sec and the Henry constant is 880 m3/mol, both at a temperature of 20 °C.24 The height of the bed was 1 m. The average specific surface area used was 3042 m2/m3 based on the average of the five sections of the column. The reaction rate constant (k, sec⫺1) was calibrated based on the value, which minimized the
Figure 4. Experimental data from columns I and II on day 206 of operation as a function of biofilter height. Data from column I were fit to the C-D-R model.16 Cge ⫽ outlet H2S concentration; Cg0 ⫽ inlet H2S concentration. 1018 Journal of the Air & Waste Management Association
Volume 53 August 2003
Morgan-Sagastume, Noyola, Revah, and Ergas residual sum of the squares of the error between the experimental and the model predicted concentrations. Under these conditions, a reaction rate constant of 0.26 sec⫺1 was calibrated with a correlation coefficient of 0.998. With this calibration, eq 12 predicted a removal in each section of ⬃54%, which was in agreement with the experimental results obtained. As shown in Figure 4, the H2S removal profile in column II was quite different from that in column I. Both media drying and changes in specific surface area can explain the changes in the removal profile. In the lower parts of the bed, the specific surface area increased; however, lack of moisture limited microbial activity, resulting in low H2S removal rates. In the upper parts of the bed, the moisture content was adequate for H2S degradation; however, channeling and the decrease in the specific surface area caused by particle agglutination limited removal. The presence of channels in the upper part of the column was observed visually. Deshusses and Cox39 also observed channels in regions close to the walls of a column that were produced by airflow through a column media consisting of compost and wood scrap. In column I, H2S removal efficiency was maintained at close to 100% because compost mixing destroyed channels that were formed. The gas flowed through a wider conduit network with smaller diameter channels, which improved the interaction between the gas and the filter media, improving biofilter performance. This is in agreement with Schwarz et al.,40 who found similar results applying a pore network model. The greatest removal efficiency (69%) was observed in the center of column II, at approximately the same loading rate as the first section of column I, which was in agreement with the theoretical result obtained by eq 12 (74%). This high removal efficiency can be explained by both the large specific surface area (5190 m2/ m3) and the adequate moisture conditions (39%) in this section. This indicates that the best biofilter performance can be obtained in systems with high specific surface area and adequate moisture content. Gas Distribution. The gas distribution in the biofilter media was quantified using tracer studies. The axial dispersion model response29 for columns I, II, III, and IV and the initial sample are shown in Table 3. Figure 5 shows the RTD curves obtained for columns I and II at the end of the study. The RTD curves show plug flow behavior, which was analyzed using the following axial dispersion model:
2 ⫽ 2
冉 冊 冉 冊
Dg Dg 2 ⫺2 共1 ⫺ e ⫺ 关1/共Dg/U0L兲兴兲 U0L U0L
(14)
where Dg is the molecular diffusivity in the gas phase (m2/sec), and 2 is the normalized variance (dimensionless). Volume 53 August 2003
Table 3. Axial dispersion number model response.
Column
Description
Axial Dispersion Number, Dg/U0L 10ⴚ3 (dimensionless)
Sample I I II III IV
Initial compost End of conventional operation End of study, with media mixing End of study, conventional operation With humidified air and water flow Neither water or air-H2S
10.7 8.5 10.8 8.4 8.4 10.7
Eq 7 was use to calculate the average retention time, tr, and the following expression was used for the variance:29
2 ⫽
冘 冘
t i2Cti⌬ti Cti⌬ti
⫺ tr2
(15)
The normalized variance (2) was calculated by dividing the variance (eq 15) by the square of the average time, tr (2 ⫽ 2/tr2).29 The term Dg/U0L in eq 14 is called the axial dispersion number and is the inverse of the Peclet number. It can be used to access the dispersion intensity within the system. A widely accepted value for the axial dispersion number to define plug-flow or well-mixed behavior is not available in the literature. However, complete mixing can be expected as the axial dispersion number increases.29 In columns I, II, and III (see Table 3), a decrease in the axial dispersion number was observed at the end of conventional operation, which implies reduced gas mixing. This can be explained by channeling and consequent dead zone formation. The term dead zone accounts for the portion of the medium where the fluid is stagnant. The average residence time for columns I and II were 19.1 and 17.6 sec, respectively, indicating a dead zone in column II of ⬃8%. Gas channel formation is influenced by gas flow rate, moisture content, and type of biofilter media used. Pressure drop, as well as gas distribution and media moisture, can be controlled when media mixing is used. As shown in Table 3, when media mixing was performed in biofilter I, gas distribution remained constant, avoiding channel formation. The axial dispersion number at the end of the operations in biofilter I remained constant and close to the initial value. Information about gas interaction inside the media was also provided by the butane desorption curves. At the end of each tracer study, the butane dosage was suddenly interrupted. The butane concentration at the column outlet decreased slowly because absorbed butane was desorbing. The sorbed quantity of butane was calculated Journal of the Air & Waste Management Association 1019
Morgan-Sagastume, Noyola, Revah, and Ergas
Figure 5. RTD curves obtained for biofilter II at the end of conventional operation and for biofilter I at the end of the compost mixing phase.
by integration of the area under each curve and multiplying by the gas flow used (10 L/min). Taking into account the solubility of butane in H2O (1.26 mM), the bulk density of compost (0.59 kg/L), and the moisture content (50%), the quantity of butane that could be sorbed in the 8.01 L of compost was estimated at 172 mg. The mass of butane sorbed was 151 and 171 mg for conventional operation and compost mixing, respectively. This shows that there is a dead zone of ⬃12% in column II that was not in contact with the tracer. This value is similar to the dead zone found using tracer studies, which was 8%. The desorption curve also showed the importance that media mixing has on gas distribution in the medium. CONCLUSIONS An analysis technique was proposed to estimate the changes in physical structure that a biofilter medium, such as compost, undergoes as a function of time in a biofiltration system. This experimental technique applied information from tracer studies, granulometry, and pressure drop analysis to a model that estimates number of channels, average channel diameter, number of particles, and specific surface area. The H2S initial removal efficiency for a conventionally operated biofilter decreased from 100 to 90% over 206 days of operation. Column II had practically the same behavior as column I over the first 141 days; however, when compost mixing was carried out, the H2S removal efficiency was maintained at near 100%. Variations in moisture content and specific surface area can explain experimental results that show this decrease in H2S removal as a function of time. The internal changes that occurred in the biofilters over time are closely related to moisture conditions inside the biofilter. The conventionally operated biofilters had significant internal changes, especially in the lower part of each biofilter, because of the compost drying. Compost drying resulted in a large number of disintegrated compost particles and flow channels. The greatest 1020 Journal of the Air & Waste Management Association
difference was observed in the first section of each biofilter, where the gas inlet was located. To avoid flow channel formation, as well as to achieve constant media moisture, particle size and gas distribution, void fraction, and general homogeneity, it is recommended that media mixing be carried out with controlled H2O addition. Routine washing of the compost and compost mixing effectively mitigated SO42⫺ accumulation and kept the compost at an adequate moisture content of ⬃50%. ACKNOWLEDGMENTS The authors acknowledge financial support from the Mexican National Council for Science and Technology (CONACyT, Proy. 27776-B). Morgan-Sagastume was supported by a fellowship from the American Chemical Society, Academia Mexicana de Ciencias, Fundacio´ n Me´ xico-Estados Unidos para la Ciencia, for a summer stay at the University of Massachusetts, Amherst, MA. REFERENCES 1. Allen, E.R.; Phatak, S. Control of Organosulfur Compound Emissions Using Biofiltration. Methyl Mercaptan. In Proceedings of the 86th Annual Conference & Exhibition of A&WMA, Denver, CO, June 1993; A&WMA: Pittsburgh, PA, 1993. 2. Alonso, C.; Suidan, M.T.; Sorial, G.A.; Smith, F.L.; Biswas, P.; Smith, P.J.; Brenner, R.C. Gas Treatment in Trickled-Bed Biofilters: Biomass, How Much Is Enough?; Biotechnol. Bioeng. 1997, 54, 583-594. 3. Acun ˜ a, M.E.; Pe´ rez, F.; Auria, R.; Revah, S. Microbiological and Kinetic Aspects of a Biofilter for the Removal of Toluene from Waste Gases; Biotechnol. Bioeng. 1999, 63, 175-184. 4. Chitwood, D.E.; Devinny, J.S.; Meiburg, E. Heterogeneous Flow through Biofilter Media. In Proceedings of the 93rd Annual Conference & Exhibition of A&WMA, Salt Lake City, UT, June 2000; A&WMA: Pittsburgh, PA, 2000. 5. Lacey, J.A.; Brady, D.L.; Apel, W.A. Comparison of NOx Removal Efficiencies in Compost Based Biofilters Using Four Different Compost Sources. In Proceedings of the 94th Annual Conference & Exhibition of A&WMA, Orlando, FL, June 2001; A&WMA: Pittsburgh, PA, 2001. 6. Allen, E.R.; Yang, Y. Biofiltration Control of Hydrogen Sulfide Emissions. In Proceedings of the 84th Annual Conference & Exhibition of A&WMA, Vancouver, British Columbia, Canada, June 1991; A&WMA: Pittsburgh, PA, 1991. 7. Chung, Y.C.; Chihpin, H.; Ching-Ping, T. Microbial Oxidation of Hydrogen Sulphide with Biofilter; J. Environ. Sci. Health 1996, 6, 12631278. 8. Sabo, F.; Motz, U.; Fisher, K. Development and Testing of High Efficiency Biofilters. In Proceedings of the 86th Annual Conference & Exhibition of A&WMA, Denver, CO, June 1993; A&WMA: Pittsburgh, PA, 1993. Volume 53 August 2003
Morgan-Sagastume, Noyola, Revah, and Ergas 9. Van Lith, C.; Leson, G.; Michelsen, R. Evaluating Design Options for Biofilters; J. Air & Waste Manage. Assoc. 1997, 47, 37-48. 10. Zarook, S.M.; Shaikh, A.A.; Ansar, Z. Development, Experimental Validation and Dynamic Analysis of a General Transient Biofilter Model; Chem. Eng. Sci. 1997, 52, 759-773. 11. Wubker, S.M.; Laurenzis, A.; Werner, U.; Friedrich, C. Controlled Biomass Formation and Kinetics of Toluene Degradation in a Bioscrubber and in a Reactor with Periodically Moved Trickle-Bed; Biotechnol. Bioeng. 1997, 55, 686-692. 12. Auria, R.; Frere, G.; Morales, M.; Acun ˜ a, M.E.; Revah, S. Influence of Mixing and Water Addition on the Removal Rate of Toluene Vapors in a Biofilter; Biotechnol. Bioeng. 2000, 68, 448-455. 13. Morgan-Sagastume, F.; Sleep, B.E.; Allen, D.G. Effects of Biomass Growth on Gas Pressure Drop in Biofilters; J. Environ. Eng. 2001, 127, 388-396. 14. Bohn, H. Consider Biofiltration for Decontaminating Gases; Chem. Eng. Prog. 1992, April, 34-40. 15. Higuchi, T.; Okazawa, S.; Kinoshita, H.; Sakamoto, T. A New Design for Biological Treatment of Gaseous Pollutants: Biofiltration of Hydrogen Sulfide Using Parallel-Moving Biosheet. In Proceedings of the 94th Annual Conference & Exhibition of A&WMA, Orlando, FL, June 2001; A&WMA: Pittsburgh, PA, 2001. 16. Ottengraf, S.P.P.; Van den Oever, A.H.C. Kinetics of Organic Compound Removal from Waste Gases with a Biological Filter; Biotechnol. Bioeng. 1983, 25, 3089-3102. 17. Kirchner, K.; Hauk, G.; Rehm, H.J. Exhaust Gas Purification Using Immobilized Monocultures (Biocatalysts); Appl. Microbiol. Biotechnol. 1987, 26, 579-587. 18. Abumaizar, R.J.; Smith, E.H.; Kocher, W. Analytical Model of Dual Media Biofilter for Removal of Organic Air Pollutants; J. Environ. Eng. 1997, 123, 606-614. 19. Zarook, S.; Baltzis, B.C.; Oh, Y.S.; Bartha, R. Biofiltration of Methanol Vapor; Biotechnol. Bioeng. 1993, 41, 512-524. 20. Shareefdeen, Z.; Baltzis, B.S. In Advances in Bioprocesses Engineering; Galindo, E., Ramirez, T., Eds.; Kluwer Acad. Press: Dordrecht, The Netherlands, 1994; pp 397-404. 21. Deshusses, M.A.; Hamer, G.; Dunn, I.J. Behavior of Biofilters for Waste Air Biotreatment. 1. Dynamic Model Development; Environ. Sci. Technol. 1995, 29, 1048-1058. 22. Dullien, F.A.L. Porous Media: Fluid Transport and Pore Structure; Academic: San Diego, CA, 1992. 23. McCabe, W.L.; Smith, J.C.; Harriott, P. Unit Operations of Chemical Engineering; McGraw Hill International Edition: New York, NY, 1993. 24. Perry, R.H.; Green, D. Perry⬘s Chemical Engineers Handbook; McGrawHill International: New York, NY, 1988. 25. Levenspiel, O. Engineering Flow and Heat Exchange; Plenum Press: New York, 1998. 26. Ergun, S. Fluid Flow through Packed Columns; Chem. Eng. Prog. 1952, 48, 89-94. 27. Gostomski, P.A.; Liaw, L.P. Air Permeability of Biofilter Media. In Proceedings of the 94th Annual Conference & Exhibition of A&WMA, Orlando, FL, June 2001; A&WMA: Pittsburgh, PA, 2001. 28. Madamba, P.S.; Driscoll, R.H.; Buckle, K.A. Bulk Density, Porosity and Resistance to Airflow of Garlic Slices; Drying Technol. 1994, 12, 937954. 29. Levenspiel, O. Chemical Reaction Engineering; John Wiley: New York, 1972; pp 253-325. 30. Leson, G.; Winer, A.W. Biofiltration: An Innovative Air Pollution Control Technology for VOC Emissions; J. Air & Waste Manage. Assoc. 1991, 41, 1045-1054.
Volume 53 August 2003
31. Parent, L.E.; Caron, J. In Soil Sampling and Methods of Analysis; Carter M., Ed.; Canadian Society of Soil Science; Lewis Publishers: Manitoba, Canada,1993; pp 441-458. 32. Klute, A. Methods for Soil Analysis; American Society of Agronomy, Soil Science Society of America: Madison, WI, 1986; p 12-2.6.5. 33. Degorce-Dumas, J.R.; Kowal, S. Le Cloirec, P. Microbial Oxidation of Hydrogen Sulphide in a Biofilter; Can. J. Microbiol. 1997, 43, 264-271. 34. Wada, A.; Shoda, M.; Kubota, H.; Kobayashi, T.; Katayama-Fujimura, Y.; Kuraishi, H. Characteristics of H2S Oxidizing Bacteria Inhibiting a Peat Biofilter; J. Ferment. Technol. 1986, 64, 161-167. 35. Smet, E.; Van Langenhove, H. Abatement of Volatile Organic Sulfur Compounds in Odorous Emissions from the Bio-industry; Biodegradation 1998, 9, 273-284. 36. Yang, Y.; Allen, E.R. Biofiltration Control of Hydrogen Sulfide I. Design and Operational Parameters; J. Air & Waste Manage. Assoc. 1994, 44, 863-868. 37. Karamanev, D.G.; Be´ langer, M.C.; Chavarie, C.; Chaouki, J.; Mayer, R. Hydrodynamic Characteristics of a Trickling Bed of Peat Moss Used for Biofiltration of Wastewater; Can. J. Chem. Eng. 1994, 72, 411-416. 38. Baltzis, B.C.; Wojdyla, S.M.; Zarook, S.M. Modeling Biofiltration of VOC Mixtures under Steady-State Conditions; J. Environ. Eng. 1997, 123, 599-605. 39. Deshusses, M.A.; Cox, H.H.J. The Use of CAT Scanning to Characterize Bioreactors for Waste Air Treatment. In Proceedings of the 91st Annual Conference & Exhibition of A&WMA, San Diego, CA, June 1998; A&WMA: Pittsburgh, PA, 1998. 40. Schwarz, B.C.E.; Nukunya, T.; Devinny, J.S.; Tsotsis, T.T. A Pore Network Model of Biofilter Clogging. In Proceedings of the USC-TRG Conference on Biofiltration, Los Angeles, CA, October 10-20, 2000; pp 167– 174.
About the Authors Juan M. Morgan-Sagastume is a Ph.D. student and research assistant, and Adalberto Noyola is a researcher and subdirector of the Institute of Engineering at National Autonomous University in Mexico City, Mexico. Sergio Revah is a head researcher in the Processes and Hydraulics Department at Metropolitan Autonomous University in Iztapalapa, Mexico. Sarina J. Ergas is an associate professor in the Department of Civil and Environmental Engineering at the University of Massachusetts in Amherst, MA. Address correspondence to: Juan M. Morgan-Sagastume National Autonomous University, Apdo. Postal 70-472, Coyoaca´ n, 04510, Mexico City, Mexico; fax: (5255) 5616-27-98; email:
[email protected].
Journal of the Air & Waste Management Association 1021