PEDAGOGICAL AND CURRICULAR THINKING OF PROFESSIONAL ASTRONOMERS TEACHING THE HERTZSPRUNG-RUSSELL DIAGRAM IN INTRODUCTORY ASTRONOMY COURSES FOR NON-SCIENCE MAJORS
by Erik Brogt ___________________________ Copyright © Erik Brogt 2009
A Dissertation Submitted to the Faculty of the DEPARTMENT OF TEACHING AND TEACHER EDUCATION In Partial Fulfillment of the Requirements For the Degree of DOCTOR OF PHILOSOPHY In the Graduate College THE UNIVERSITY OF ARIZONA
2009
2 THE UNIVERSITY OF ARIZONA GRADUATE COLLEGE As members of the Dissertation Committee, we certify that we have read the dissertation prepared by Erik Brogt entitled Pedagogical and Curricular Thinking of Professional Astronomers Teaching the Hertzsprung-Russell Diagram in Introductory Astronomy Courses for Non-Science Majors and recommend that it be accepted as fulfilling the dissertation requirement for the Degree of Doctor of Philosophy _______________________________________________________________________
Date: April 9, 2009
Dr. Kathy Carter _______________________________________________________________________
Date: April 9, 2009
Dr. Walter Doyle _______________________________________________________________________
Date: April 9, 2009
Dr. Debra Tomanek
Final approval and acceptance of this dissertation is contingent upon the candidate’s submission of the final copies of the dissertation to the Graduate College. I hereby certify that I have read this dissertation prepared under my direction and recommend that it be accepted as fulfilling the dissertation requirement. ________________________________________________ Date: April 9, 2009 Dissertation Director: Dr. Kathy Carter
3
STATEMENT BY AUTHOR This dissertation has been submitted in partial fulfillment of the requirements for an advanced degree at The University of Arizona and is deposited in the University Library to be made available to borrowers under rules of the Library Brief quotations from this dissertation are allowed without special permission, provided that accurate acknowledgement of source made. Requests for permission for extended quotation from or reproduction of this manuscript in whole or in part may be granted by the copyright holder. SIGNED: Erik Brogt
4 ACKNOWLEDGEMENTS As many writers of dissertations have said before me, and many others will undoubtly say this behind me, a dissertation is not written alone. Rather, it is the product of an multi-year interaction among many people, personalities, and viewpoints. I have been fortunate to have had an outstanding group of people around me, who shaped and pushed my thinking into regions I never thought I would explore when I arrived in the United States five-and-a-half years ago. I would like to thank first of all my dissertation committee: Kathy Carter, Walter Doyle, and Deb Tomanek for their support, critical feedback, and overall help to make this dissertation in what it is today. Thank you, participants, for your time, effort and willingness to be a part of this study. Thanks to my parents, my brother Hugo, and my grandfather for their moral support from 5500 miles away and the opportunities to speak my native tongue every now and again. Mary McCaslin, thank you so much for opening the world of educational psychology and educational theory to me. It has made me look very differently at science education, and I’m a richer scholar as a result. Thank you, faculty, staff, and graduate students in Steward Observatory, for providing me with a science home base so I could remain involved in astronomy. Mijn Famili, het doet Di Don een buitengewoon genoegen u allen te bedanken voor de steun, brakke grappen, en lange conversaties die de afstand tussen Stad en Barbarij deden vervagen. De stunt die jullie uithaalden op mijn dertigste verjaardag blijft het absolute hoogtepunt in mijn verblijf aan deze zijde van de plas. The long conversations, about work and decidedly not about work, I have had with my friends, colleagues, and fellow science eddies have been extremely useful, valuable, and most of all fun. You have made me feel at home in the US, so thank you Erin, Jon, Erika, Sam, Jessie, Audra, Deb, Elisabeth, Pebble, Athena, Chris, Delphine, Matthew, Lindsey, Sanlyn, Rob, Baohua, and Amy. Thank you, gaming group, Jeff, Karen, Jackie, Paul, Tony, Tom, Scott, Patrick, Karen, and Krystal, for providing the very necessary diversion from being chained to a desk and writing. Erin, thank you so much for your time and effort in proof reading and copy editing my work, as well as the many lovely brownie enriched dinners. And last, a very special thank-you to Sanlyn. Over the last couple of years, you have become more and more like a sister to me and you have been instrumental in keeping me going when the going got really tough. I could not have done this without you. Thank you so much for all your support and friendship.
5 DEDICATION
This work is dedicated to Chris Sterken, whose mentoring in the science, the art, and the academic profession of astronomy shaped me as an astronomer, and to the memory of “oom” Jan Schröder, who taught me the principles of teaching physics and initiated my journey toward becoming a science education researcher.
6 TABLE OF CONTENTS LIST OF TABLES ............................................................................................................ 11 LIST OF FIGURES .......................................................................................................... 12 ABSTRACT...................................................................................................................... 13 CHAPTER 1: INTRODUCTION ..................................................................................... 14 1.1 Purpose of the study ................................................................................................ 14 1.2 Motivation for the study.......................................................................................... 15 1.3 Setting and participants ........................................................................................... 21 1.4 Methodology ........................................................................................................... 23 1.5 Definition of Terms................................................................................................. 24 1.6 The Hertzsprung-Russell diagram .......................................................................... 26 1.7 Summary and Outlook on this Dissertation ............................................................ 33 CHAPTER 2: REVIEW OF THE LITERATURE ........................................................... 34 2.1 Overview ................................................................................................................. 34 2.2 Faculty..................................................................................................................... 35 2.3 Faculty as researchers and as teachers .................................................................... 37 2.3.1 Views on content ............................................................................................. 37 2.3.2 Tension between teaching and research duties ................................................ 38 2.4 Faculty beliefs ......................................................................................................... 39 2.4.1 The difference between knowledge and belief ................................................ 40 2.4.2 Sources of educational beliefs ......................................................................... 42 2.5 Faculty beliefs about their role as instructors ......................................................... 44 2.5.1 Influences on beliefs ........................................................................................ 44 2.5.2 The link between beliefs, intentions, and classroom practice.......................... 45 2.5.3 Congruence between world view and practice ................................................ 49 2.5.4 Types of knowledge influencing tertiary education ........................................ 52 2.6 Faculty pedagogical content knowledge ................................................................. 53 2.6.1 Definition of pedagogical content knowledge ................................................. 53 2.6.2 Different types of pedagogical content knowledge ......................................... 56 2.6.3 Conceptualization of pedagogical content knowledge .................................... 57 2.6.4 Development of pedagogical content knowledge ............................................ 60 2.7 Measuring instructor beliefs and pedagogical thinking .......................................... 62 2.8 Conclusions ............................................................................................................. 64 CHAPTER 3: METHODOLOGY .................................................................................... 65 3.1 Introduction ............................................................................................................. 65 3.2 A general overview of the time line and the methods used in this dissertation ...... 66 3.3 Positionality ............................................................................................................ 70 3.4 Participants profiles and course history .................................................................. 72 3.4.1 Participant profiles ........................................................................................... 72 3.4.2 History and impact of the nats102 course ........................................................ 76 3.5 Details about the different methods ........................................................................ 78 3.6 The first interview ................................................................................................... 79 3.6.1 Background and implementation ..................................................................... 79
7 3.6.2 Purpose............................................................................................................. 80 3.7 Cognitive task I: Lesson plan.................................................................................. 83 3.7.1 Background and implementation ..................................................................... 83 3.7.2 Purpose............................................................................................................. 84 3.8 Cognitive task II: Concept map .............................................................................. 84 3.8.1 Background and implementation ..................................................................... 84 3.8.2 Purpose............................................................................................................. 85 3.9 Cognitive task III: Pathfinder network map ratings................................................ 86 3.9.1 Background and implementation ..................................................................... 86 3.9.2 Purpose............................................................................................................. 87 3.10 Cognitive task IV: Stereotypical student statements ............................................ 88 3.10.1 Background and purpose ............................................................................... 88 3.10.2 Implementation .............................................................................................. 88 3.11 Second interview................................................................................................... 92 3.11.1 Background and implementation ................................................................... 92 3.11.2 Purpose........................................................................................................... 93 3.12 Analysis methods .................................................................................................. 95 3.12.1 First and second interview ............................................................................. 95 3.12.2 Cognitive Tasks ............................................................................................. 99 3.12.3 Case study development and theme identification ...................................... 101 3.13 Considerations and deliberations concerning the methods ................................. 102 3.13.1 Qualitative research ..................................................................................... 103 3.13.2 Case studies.................................................................................................. 104 3.13.3 Minimizing the potential risk of over-interpretation of data ....................... 106 3.13.4 Interview approach ...................................................................................... 107 3.13.5 Why so many participants? .......................................................................... 109 CHAPTER 4: FINDINGS FROM THE INDIVIDUAL CASE STUDIES .................... 110 4.1 Introduction ........................................................................................................... 110 4.2 The case of Hugh .................................................................................................. 112 4.2.1 General course mechanics for nats102 .......................................................... 113 4.2.2 General course goals for nats102 ................................................................... 115 4.2.3 Students in the course and classroom environment ....................................... 117 4.2.4 Teaching nats102 in the ideal world .............................................................. 119 4.2.5 Student insecurity .......................................................................................... 120 4.2.6 The difference between teaching nats102 and astro250 ................................ 122 4.3 Hugh’s approach to teaching the HR diagram ...................................................... 123 4.3.1 Goals for and approach to teaching the HR diagram ..................................... 123 4.3.2 Cognitive task I: Lesson plan......................................................................... 125 4.3.3 Cognitive task II and III: Concept map and Pathfinder network map ........... 132 4.3.5 Common student problems and stereotypical student statements ................. 136 4.4 Concluding remarks on the case of Hugh ............................................................. 138 4.5 The case of Jeff ..................................................................................................... 140 4.5.1 General course mechanics for nats102 .......................................................... 141 4.5.2 General course goals for nats102 ................................................................... 143
8 4.5.3 The students in nats102.................................................................................. 147 4.5.4 The difference between teaching nats102 and astro250 ................................ 148 4.5.4 Being an effective teacher.............................................................................. 149 4.5.5 Teaching nats102 in the ideal world .............................................................. 151 4.6 Jeff’s approach to teaching the HR diagram ......................................................... 151 4.6.1 Goals for and approach to teaching the HR diagram ..................................... 151 4.6.2 Cognitive task I: Lesson plan......................................................................... 153 4.6.3 Cognitive task II and III: Concept map and Pathfinder network map ........... 158 4.6.4 Most common student difficulties and stereotypical student statements ....... 161 4.7 Concluding remarks about the case of Jeff ........................................................... 165 4.8 The case of Linda .................................................................................................. 168 4.8.1 Course history ................................................................................................ 169 4.8.2 General course goals for the nats102 course ................................................. 170 4.8.3 Students in the nats102 course ....................................................................... 171 4.8.4 General course mechanics for nats102 .......................................................... 172 4.8.5 The difference in teaching nats102 and astro250 .......................................... 175 4.8.6 Teaching nats102 in the ideal world .............................................................. 176 4.9 Linda’s approach to teaching the HR diagram ..................................................... 177 4.9.1 Goals for and approach to teaching the HR diagram ..................................... 177 4.9.2 Cognitive task I: Lesson plan......................................................................... 179 4.9.3 Cognitive task II and III: Concept map and network map ............................. 182 4.9.4 Common student problems and stereotypical student statements ................. 185 4.10 Concluding remarks about the case of Linda ...................................................... 188 4.11 The case of Paul .................................................................................................. 190 4.11.1 Course mechanics and course goals for nats102 ......................................... 191 4.11.2 Technology in the classroom ....................................................................... 195 4.11.3 Students in the course and classroom environment ..................................... 198 4.11.4 The difference between teaching nats102 and astro250 .............................. 199 4.11.5. Teaching nats102 in the ideal world ........................................................... 200 4.12 Paul’s approach to teaching the HR diagram...................................................... 201 4.12.1 Goals for and approach to teaching the HR diagram ................................... 201 4.12.2 Cognitive task I: Lesson plan....................................................................... 203 4.12.3 Cognitive task II and III: Concept map and Pathfinder network map ......... 206 4.12.4 Common student problems and stereotypical student statements ............... 209 4.13 Concluding remarks about the case of Paul ........................................................ 214 4.14 The case of William ............................................................................................ 217 4.14.1 General course goals for nats102 ................................................................. 217 4.14.2 General course mechanics for nats102 ........................................................ 218 4.14.3 Students in the course and classroom environment ..................................... 222 4.14.4 Teaching nats102 in the ideal world ............................................................ 224 4.14.5 The difference between teaching nats102 and astro250 .............................. 225 4.15 William’s approach to teaching the HR diagram................................................ 226 4.15.1 Goals for and approach to teaching the HR diagram ................................... 226 4.15.2 Cognitive task I: Lesson plan....................................................................... 228
9 4.15.3 Cognitive task II and III: Concept map and Pathfinder network map ......... 235 4.15.4 Common student problems and stereotypical student statements ............... 240 4.16 Concluding remarks about the case of William .................................................. 244 4.17 Concluding remarks about the individual case studies ....................................... 248 CHAPTER 5: IDENTIFICATION AND DISCUSSION OF THEMES EMERGING FROM THE INDIVIDUAL CASES .............................................................................. 249 5.1 Introduction ........................................................................................................... 249 5.2 Emerging themes .................................................................................................. 250 5.3 Assumptions about the students, student learning, and the learning environment 251 5.3.1 Interpretive comments ................................................................................... 253 5.4 Instructional goals ................................................................................................. 254 5.4.1 General course goals ...................................................................................... 254 5.4.2 Impact of science on the world ...................................................................... 257 5.4.3 The differences in goals between nats102 and astro250................................ 258 5.4.4 Interpretive comments ................................................................................... 260 5.5 General instructional strategies ............................................................................. 262 5.5.1 Assessment..................................................................................................... 262 5.5.2 Classroom techniques .................................................................................... 264 5.5.3 Teaching nats102 in the ideal world .............................................................. 265 5.5.4 Interpretive comments ................................................................................... 266 5.6 Pathfinder network map ........................................................................................ 269 5.7 The Hertzsprung-Russell diagram within the nats102 course .............................. 275 5.8 Instructional goals for teaching the HR diagram .................................................. 277 5.8.1 Serving process goals..................................................................................... 277 5.8.2 Serving affect goals: Role models ................................................................. 279 5.8.3 Interpretive comments ................................................................................... 280 5.9 The use of reinforcement techniques in teaching the HR diagram ....................... 281 5.9.1 Lecture-Tutorials and in-class exercises ........................................................ 282 5.9.2 Think-pair-share............................................................................................. 283 5.9.3 Mastering Astronomy and (digital) labs ........................................................ 284 5.9.4 Analogies ....................................................................................................... 284 5.10 The use of analogies to help students overcome difficulties .............................. 285 5.10.1 The height versus weight analogy ............................................................... 286 5.10.2 The gas mileage analogy.............................................................................. 288 5.10.3 The stove burner analogy ............................................................................. 289 5.10.4 Interpretive comments ................................................................................. 290 5.11 Comparing and contrasting Hugh and Linda ...................................................... 291 5.11.1 Course goals for nats102.............................................................................. 292 5.11.2 Time for teaching ......................................................................................... 293 5.11.3 The teaching of Linda and Hugh ................................................................. 294 5.11.4 Interpretive comments ................................................................................. 296 5.12 General concluding comments regarding the themes ......................................... 297 CHAPTER 6: CONCLUSIONS AND FUTURE WORK .............................................. 298 6.1 Introduction ........................................................................................................... 298
10 6.2 Summary of the findings....................................................................................... 299 6.3 Relations to the literature on instructor beliefs ..................................................... 302 6.4 Relations to the literature on pedagogical content knowledge ............................. 306 6.5 The morality of teaching ....................................................................................... 308 6.6 Methodological comments .................................................................................... 310 6.6.1 Conclusions regarding the Pathfinder network task ...................................... 310 6.6.2 Concept maps and lesson plans as pedagogical tools .................................... 313 6.7 Impact of this dissertation ..................................................................................... 314 6.8 Implications for research....................................................................................... 316 6.8.1 The use of analogies and metaphors .............................................................. 316 6.8.2 Pedagogical content knowledge of science faculty ....................................... 317 6.8.3 Implication for the use of diagnostic tests to assess course effectiveness ..... 320 6.9 Implications for practice ....................................................................................... 323 6.10 Final concluding remarks .................................................................................... 326 APPENDIX A: INSTITUTIONAL REVIEW BOARD APPROVAL MATERIALS .. 327 A.I: APPROVAL AND AMENDMENT FORM ....................................................... 327 A.II: SITE AUTHORIZATION.................................................................................. 329 A.III: RECRUITMENT EMAIL / LETTER .............................................................. 330 A.IV: PARTICIPANT INFORMATION SHEET ...................................................... 331 A.V: CONSENT FORM ............................................................................................. 333 APPENDIX B: DATA GATHERING PROTOCOLS ................................................... 336 B.I: FIRST INTERVIEW QUESTIONS .................................................................... 336 B.II: SECOND INTERVIEW QUESTIONS .............................................................. 339 B.III: LESSON PLAN COGNITIVE TASK .............................................................. 349 B.IV: CONCEPT MAP COGNITIVE TASK ............................................................ 350 B.V: PATHFINDER TASK........................................................................................ 352 APPENDIX C: PHYSICS OF THE HERTZSPRUNG-RUSSELL DIAGRAM ........... 362 The horizontal axis: determining temperature ............................................................ 362 The vertical axis: determining luminosity .................................................................. 365 Stars on the HR diagram ............................................................................................. 368 APPENDIX D: IN-CLASS EXERCISE IN THE COURSES OF LINDA AND HUGH ......................................................................................................................................... 373 REFERENCES ............................................................................................................... 375
11 LIST OF TABLES Table 1: Components of PCK, adopted from Lee and Luft (2008, p. 1352) .................... 59 Table 2: Purpose of the different data sources .................................................................. 68 Table 3: Overview of the use of different data sources to answer the research question . 69 Table 4: Example of linked codes regarding decisions for the general course ................. 98 Table 5: Properties of the interview guide approach, from Patton (1990), p. 288.......... 107 Table 6: Legend for the data sources cited in the case studies ....................................... 112 Table 7: Highlights from the individual cases ................................................................ 250 Table 8: Course assessment overview ............................................................................ 263 Table 9: Classroom activities .......................................................................................... 265 Table 10: Summary of the internal coherence measures of the participants’ maps........ 271 Table 11: Network map proximity correlations .............................................................. 272 Table 12: Number of links in common ........................................................................... 273 Table 13: Number of links in common, corrected for chance ........................................ 273 Table 14: Similarity of the maps to one another ............................................................. 274 Table 15: Similarity of the maps to one another, corrected for chance .......................... 274 Table 16: Use of analogies in the stereotypical student statements and the concept of a graph ....................................................................................................................... 286
12 LIST OF FIGURES Figure 1: Example of a Hertzsprung-Russell diagram...................................................... 28 Figure 2: Concept map made by Hugh ........................................................................... 133 Figure 3: Hugh’s Pathfinder network map...................................................................... 135 Figure 4: Concept map made by Jeff .............................................................................. 160 Figure 5: Jeff’s Pathfinder network map ........................................................................ 161 Figure 6: Concept map made by Linda ........................................................................... 183 Figure 7: Linda's Pathfinder network map ...................................................................... 185 Figure 8: Concept map made by Paul ............................................................................. 208 Figure 9: Paul's Pathfinder network map ........................................................................ 209 Figure 10: Concept map made by William ..................................................................... 237 Figure 11: William’s Pathfinder network map ............................................................... 240 Figure 12: Erik’s Pathfinder network map...................................................................... 271 Figure 13: Schematic of using parallax to determine distance to a star.......................... 366 Figure 14: Determining masses of stars using a binary system ...................................... 369
13 ABSTRACT This qualitative study explores the pedagogical and curricular thinking of five professional astronomers, faculty at a university, about teaching the Hertzsprung-Russell diagram in introductory astronomy courses for non-science majors. Data sources for this study included two semi-structured interviews per participant, in which they were asked about teaching the Hertzsprung-Russell diagram, as well as about the introductory course in general. In addition, participants were asked to complete four cognitive tasks; the creation of a lesson plan, a concept map on how they would like their students to think about the Hertzsprung-Russell diagram at the end of the course, a Pathfinder network rating task, and responding to stereotypical student statements regarding the HertzsprungRussell diagram. The data was analyzed using a case study approach, followed by a discussion of themes that emerged from the data. Results indicate that participants had primarily affect and process goals for the course, rather than content goals. In addition, they wanted students to view the HR diagram as a part of a flow chart, where input physics (both observed and inferred properties of stars) leads to the construction of the HR diagram, which in turn is used to make inferences about stellar evolution. Participants identified several student difficulties with the HR diagram, among which interpreting a graph was the most pertinent. In several stereotypical student statements, participants responded using the exact same analogies to explain the concepts to the students. This may be indicative of some underlying pedagogical content knowledge.
14 CHAPTER 1: INTRODUCTION 1.1 Purpose of the study The act of teaching means making decisions about curriculum, content and pedagogy on a regular basis. For most instructors, becoming proficient in these different facets of teaching requires several years of development and experience. Instructors at the K-12 level are required to show proof of competence, by formally obtaining a teaching license, before they are allowed in classrooms to teach students. Instructors at the university level, especially the tenure-line faculty, are hired based on their expertise and prowess as researchers, not on their teaching credentials (Fernández-Baboa & Stiehl, 1995; Menges & Austin, 2001; Walczyk & Ramsey, 2003; Weiss, 1992). They often do not have formal preparation in teaching (Menges & Austin, 2001; Walczyk, Ramsey, & Zha, 2007), and usually go from their graduate work via a postdoctoral position into a faculty job (Ivie, Guo, & Carr, 2005; Metcalfe, 2008). Yet, these instructors typically have teaching responsibilities, from advanced courses for graduate students to introductory courses for non-major undergraduate students. Because of this wide variety of teaching responsibilities, these instructors have to make a wide variety of curricular and pedagogical decisions. For example: In how much depth is a topic covered in a particular course, and how should the content be represented to the students? This dissertation aimed to investigate the answers to questions similar to the ones in the example above. It examined how five professional astronomers, who were faculty at a university, think about curriculum and pedagogy when teaching one specific topic, the Hertzsprung-Russell diagram, in an introductory level astronomy course for non-
15 science majors. Why this particular situation was investigated as the topic of this study is motivated in the next section.
1.2 Motivation for the study In its core, this study was about the pedagogical thinking of an academic discipline. The study builds on earlier work done on the pedagogical thinking of faculty and can be seen as a logical next step in research. Veal and Kubasko (2003) showed that the same concept, evolution in the case of their study, can be taught very differently depending on the background of the instructor, in that case a biology and a geology instructor. This indicates that teaching of a topic is in part dependent on the (professional) background of the instructor. Southerland, Gess-Newsome, and Johnston (2003) showed that different views on the same concept in a course that was team taught led to differences in enactment. In the study of Southerland et al. different views on the nature of science showed through in different college instructors, co-teaching the same course where the nature of science was the central concept. This indicates that faculty members’ personal views and beliefs about the representation of content are a factor in teaching. These two studies all comprised of faculty members from different disciplines. Quinlan (1999) on the other hand examined faculty within one discipline, namely history, and found that there were more diverse and differing ideas about teaching when the participants talked about the introductory course.
16 This study combines several factors of the studies above. The participants are all astronomers, constraining the study to one discipline in the same way Quinlan (1999) did, and likewise was limited to the introductory course level. It looked at a single topic, like in the Veal and Kubasko (2003) and Southerland et al. (2003) studies. The extension of the studies listed above is that rather than talking about teaching the introductory course in general, it focused on a) an introductory course specifically designed for non-science majors and b) the teaching of a complex piece of content in that introductory course. This piece of content, the Hertzsprung-Russell diagram allows itself to be taught in multiple ways and its understanding is dependent on understanding a set of interacting complex physical laws. As such, it could conceivably create a pedagogical dilemma for the participants, and the decisions they make with respect to what aspects of the diagram to convey and how to approach this provides a window into the pedagogical thinking of the faculty members. Pedagogical thinking, and in particular pedagogical content knowledge (Shulman, 1986b, 1987, 2004), the craft knowledge of teaching the content, is difficult to capture, because the construct is in part internal to the instructor (Baxter & Lederman, 1999). This study was designed to be the most extreme case of looking at what kinds of problems content experts with little formal training in pedagogy face when teaching complex content to novices with no inherent stake in the content. As such it is most likely to yield results that will teach us something about how pedagogical thinking in a scientific discipline arises, and what pedagogical content knowledge, if any, permeates the community of the scientific discipline, in this case astronomy. In other words, what
17 kind of pedagogical understandings, if any, (spontaneously) arise when experts without formal training in pedagogy teach complex content to novices? In the paragraphs below, the reasons for choosing the course, instructor population, and content are explained in some more detail. Why were university astronomy faculty members, who are teaching non-science major undergraduate students the Hertzsprung-Russell diagram, the topic of this study?
Why look at university faculty? As mentioned, university faculty members generally have limited training in teaching and pedagogy. An important part of the art of teaching is the concept of pedagogical content knowledge (Shulman, 1986b, 1987, 2004). Pedagogical content knowledge, usually abbreviated as PCK, is a form of specialized craft knowledge to translate content (astronomy) knowledge into curricular events suitable for teaching (Carter, 1990; Doyle, 1992; Van Driel, Verloop, & De Vos, 1998). The vast majority of research on pedagogical content knowledge has focused on the K-12 arena (FernándezBaboa & Stiehl, 1995). The literature on pedagogical content knowledge at the university level is focused mostly on general beliefs about teaching and learning (e.g. Samuelowicz & Bain, 2001) either across academic departments or within a single department (see e.g. Quinlan, 1999, for an example of the latter). There exists virtually no research on pedagogical content knowledge of specific content areas in higher education, which creates a gap in the literature.
18 Studying the way content is represented at the college level is particularly interesting, because instructors in higher education typically have content knowledge of the material at the Ph.D. level. They are experts in the sense of the expert-novice model (see e.g. Sternberg, 2005, for a review), and as such are likely to have an organization of knowledge about astronomy that is very different than the organization of knowledge of a novice in the field, i.e. an undergraduate non-science major student. Therefore, though it is generally agreed in the literature that one cannot have pedagogical content knowledge without content knowledge, it may be difficult for an instructor to craft educational events tailored to a novice population. Yet most instructors in college or university settings have considerable practical experience teaching, and have arguably developed their own craft knowledge about how to teach the content. By studying the reasoning behind their teaching, we can learn something about the development of pedagogical content knowledge in the absence of formal training in teaching. Why the introductory astronomy course? The motivation for picking the introductory astronomy course, rather than a course for majors, was based on Quinlan’s (1999) study of history faculty, which found that participants had more diverse and differing ideas about teaching when talking about the introductory course. This finding seems to suggest that looking at the introductory course offers a better window into the faculty members’ thinking about teaching, as differences in ideas are more likely to be found at the introductory level. As such, the introductory course offers a higher resolution view into pedagogical thinking than courses for majors. In this study, the difference in thinking was potentially enlarged
19 because of using the introductory class for non-majors. The population of non-science majors is perhaps substantially different from the population of astronomers – who devote their lives to science and mathematics – both in attitude toward, and aptitude in, astronomy. The students have no inherent stake in the content, as they are not majors. The contrast between the instructor and the student in this course is potentially large, making the pedagogical and curricular reasoning of faculty in such a course very interesting to study. Why the Hertzsprung-Russell diagram? As mentioned earlier in this section, relatively little previous research has been done on the structure of pedagogical content knowledge of specific content disciplines in higher education, such as astronomy. Within a content discipline, there is a plethora of topics to choose from. In introductory astronomy courses, a wide variety of topics is covered (Slater, Adams, Brissenden, & Duncan, 2001). To make this study manageable, the pedagogical and curricular thinking of individual faculty members concerning a single topic within the introductory course were examined. The reason for picking the Hertzsprung-Russell (HR) diagram was two-fold. First, it is a diagram that summarizes a large amount of stellar physics, primarily the properties of light and the properties of stars. The properties of light is the most commonly taught topic in an introductory astronomy course (Slater et al., 2001), meaning that the HR diagram is very likely to be taught in some form or another in any given introductory astronomy course. A background of the HR diagram is presented in section 1.6 and a more detailed discussion of the physics of the HR diagram is given in appendix C.
20 The second motivation for choosing the HR diagram is that the topic is relatively complex, and as such lends itself to a variety of pedagogical approaches. This means that the HR diagram can potentially be used as a high resolution tool to differentiate pedagogical thinking among instructors. The pedagogical and curricular choices made by the instructor while teaching about this specialized concept provided a window into the instructor’s mind about the teaching and learning of astronomy.
Research question As noted, pedagogical content knowledge is a concept that is difficult to measure. The results from the literature helped guide the setting of the study to studying professional astronomers teaching the Hertzsprung-Russell diagram to non-science major students in an introductory level class. This setting maximized the chances that differences in pedagogical thinking could be detected. Looking at one specific setting also served to constrain the number of free parameters. Under the assumption that (science) education is an interaction between instructors, students, curriculum, and setting, the latter three parameters are kept as constant as possible, which allows for detected differences to be ascribed to differences in instructor and instructional (pedagogical) thinking. The goal of this dissertation was to examine astronomy instructors’ ideas about how they teach the concept of the HR diagram, and why they teach it in that particular way. The aim was also to see whether there were patterns underlying the teaching
21 approaches of the different instructors. This led to the following research question for this dissertation: What is the pedagogical and curricular thinking of professional astronomers when teaching the Hertzsprung-Russell diagram and to what ideas is this thinking related?
To explore this research question, five introductory courses taught by professional astronomers at a large university in the southwest of the United States were investigated. Although it is common in the literature to not identify the university at which a study took place, some of the results in chapter 4 and 5 (of one participant in particular) are directly, and explicitly linked to the city in which the university is located. This fact made attempts to de-identify the university meaningless, and for this reason both the university and department are named in the next section, deviating from the convention in the literature. Naturally, the anonymity of the participants themselves was maintained, in accordance with Institutional Review Board requirements. The setting and the participants are briefly discussed in the next section.
1.3 Setting and participants Participants in this study were professional astronomers at Steward Observatory, the department of astronomy of the University of Arizona, a very high research activity (Carnegie classification, formerly known as R-1) university in the southwest of the United States. The department houses over 300 faculty, staff, technicians, postdoctoral
22 fellows, and graduate students. Not everyone in the department has teaching responsibilities, as the department has a standing rule that all courses, including the introductory course for non-science majors, be taught by faculty, rather than graduate students. Graduate students do have to serve as a teaching assistant for at least two semesters as a graduation requirement, but do not have instructor-of-record responsibilities. Each semester, faculty and staff teach multiple sections of the nats102 course, as the introductory astronomy course for non-science majors is called. Nats102 is a three credit unit course without a lab component and fulfills a general education science requirement at the university. The course sections have a large enrollment (up to 150 students per section) and are typically taught by a faculty member assisted by a single graduate teaching assistant. Each instructor is free to choose the textbook, content, and assessments as he or she sees fit, in accordance with the concept of academic freedom. Faculty and staff take turns in teaching nats102, although about eight are teaching the course regularly (yearly or biannually), out of about 30 faculty and staff with teaching responsibilities. Five of these instructors agreed to become participants in the study. Criteria for inclusion were that a participant was either currently teaching the nats102 course, or had taught it within the last two years. A brief academic profile of each participant is given in section 4 of chapter 3. What the participants were asked to do in this study is the topic of the next subsection.
23 1.4 Methodology Based on the research question, the exploratory nature of the study, and the number of participants, a qualitative methodology was deemed the most useful approach for this study. The study was divided in three broad parts and sequenced chronologically over the semester in which the data were taken. Participants were interviewed at the beginning of the semester to obtain their general ideas about teaching introductory astronomy to non-science majors. Course syllabi were collected as well for document analysis. The interview was followed later in the semester by several written cognitive tasks to obtain information about the priorities of content representation and desired student outcomes. The third, and final part of the data collection consisted of a second interview with the participants in which they reflected on the first interview and the cognitive tasks. In this interview, participants were probed more deeply about their curricular and pedagogical decision strategies. Analysis procedures consisted of descriptive coding of the interview data, in which relatively low-level questions were asked of the data. These descriptive codes were then combined by asking higher-level, more interpretive questions to help answer the research question. The coding was done in an iterative fashion, meaning that codes were developed while going through the data, and the data was reanalyzed as soon as it was found that a complete set of codes had been found for a specific (descriptive or interpretive) question. The methodology, methods, protocols, and analysis procedures are discussed in detail in chapter 3 of this dissertation.
24 1.5 Definition of Terms In this dissertation, several phrases and terms are used throughout the manuscript with a specific meaning. To ensure readability for readers from education and astronomy alike, and for the purposes of clarification and operationalization, a short definition of these terms is given below. Beliefs In this study, the word “beliefs” is used to denote convictions that are not substantiated by evidence. Beliefs differ from knowledge in the sense that knowledge requires a measure of verifiability, the “truth condition” as it is known in philosophy (Lehrer, 1990; Southerland, Sinatra, & Matthews, 2001). In chapter 2, the concept of faculty beliefs is discussed in more detail. Faculty When the word “faculty” is used in this dissertation, it is synonymous with professional astronomer with teaching responsibilities. It is not meant to indicate academic rank or people in tenure lines. Participants in this study held different academic ranks, and not all of them were in tenure-line positions. No formal training in education When in this dissertation the phrase “no formal training in education” is used, it means that the participants did not have formal coursework at the college or university level in pedagogy or teaching. It does not mean that instructors have not participated in workshops on teaching or pedagogy, Nats102
25 Nats102 is the name of the three credit unit, introductory astronomy course for non-science majors. It is typically taken in the freshman or sophomore year and is analogous to similar courses across the country. Although the course may have different names depending on the institution, a generic name for the course is “astro101”. Astro101 is usually a 3-credit course, though it can sometimes include a separate 1 unit lab section, taking the course to 4 credits. Pedagogical and curricular thinking Pedagogical and curricular thinking should not be seen as two distinct entities. Where curriculum is present, pedagogy is invariably involved and vice versa (Doyle, 1992). In this dissertation, I use the word curriculum in its definition of “interpretation of content for pedagogical purposes”, which shows the link between the two concepts. Pedagogical and curricular thinking is thus the reasoning about the selection of content concepts with respect to the HR diagram, choices with respect to the representation of those concepts given the Nats102 student audience and instructional setting, and choices regarding the academic tasks and assessments. Pedagogical knowledge Pedagogical knowledge is defined as both the knowledge about motivations, expectations, dispositions and attitudes of students with respect to the learning process, and the knowledge of the enactment of curriculum and classroom management. Professional astronomer
26 A professional astronomer is defined as a person holding a Ph.D. or an equivalent degree in astronomy or a related science and whose primary work responsibilities are in the area of astronomical research as part of a university or research institution. Teaching strategies Teaching strategies are defined as the aggregate of actions, methods and strategies employed by an instructor to enact a piece of curriculum. They can be either ad-hoc, dealing with an educational event on the spot, or part of a thought-out, general approach to instruction. Undergraduate non-science major Undergraduate non-science major refers to college students who have not yet received a bachelor’s degree and who have either not yet declared a major or have a declared major in fields other than the natural sciences.
1.6 The Hertzsprung-Russell diagram As mentioned earlier, the HR diagram is a complex piece of content in an introductory astronomy course. It was the intention that this dissertation would be readable for audiences in both the fields of education and astronomy. Since the HR diagram is central to the study and some of the participants’ data is laced with astronomical jargon, it is useful to introduce those readers unfamiliar with stellar astrophysics to the HR diagram and some of its associated science concepts. A more detailed background of the physics in the diagram is presented in appendix C of the dissertation.
27
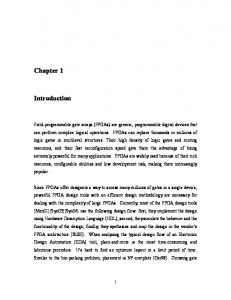
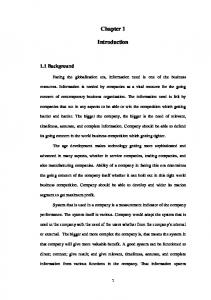
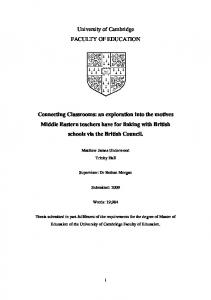
The HR diagram was developed by Enjar Hertzsprung and Henry Norris Russell circa 1911 (Comins & Kaufmann, 2003). In Figure 1 an example of the HR diagram is given. The diagram depicts the relationship between (a) surface temperature and (b) luminosity (actual brightness) for an aggregate of stars. Note that on the horizontal axis (the top and bottom edges of the diagram) temperature and spectral class are used interchangeably, as do luminosity and absolute magnitude on the vertical axis (the right and left side of the diagram). In a typical textbook example of the HR diagram, three populations of stars are usually shown: the main sequence (the rough diagonal from top left to bottom right), the giants in the top right above the diagonal and the white dwarfs in the bottom left below the diagonal. Note that this is not a map of the sky, but a classification of types of stars. These three populations have distinct properties and represent actually different evolutionary stages of stars. Though only the temperature and luminosity are plotted in the diagram, a larger set of related concepts in stellar astronomy can be inferred from the HR diagram, in part due to the positions of stars in the diagram (the fact that stars are not evenly distributed, but are distributed in very distinct patterns), and in part due to laws of physics concerning electromagnetic radiation. For example, two properties of stars that can be inferred from the diagram using the laws of physics are the star’s mass and its size. The fact that most of the stars are distributed on the main sequence is an indicator that the main sequence seems to be a stable configuration, and the fact that certain parts of the diagram are unoccupied by stars hints at physical laws that prevent stars from
28 being there. All these inferences have been instrumental in advancing the understanding of stellar astrophysics and the properties of stars. Below, the background on some of the astrophysical concepts related to the HR diagram is explored, starting with the axes of the diagram.
Figure 1: Example of a Hertzsprung-Russell diagram Image from http:/ /imagine.gsfc.nasa.gov/docs/teachers/lifecycles/Image31.gif
The horizontal axis, spectral class and temperature In most textbook examples of the HR diagram, the horizontal axis denotes temperature, meaning the temperature of the surface of the star. The Sun for example, has a temperature of slightly under 6,000 Kelvin (10,000 degrees Fahrenheit). A star’s temperature can be derived from its spectrum (the chemical finger print), using Wien’s law (see appendix C for the physics behind this). The odd sequence of letters to denote spectral type of a star has historical reasons. Spectra of stars were first systematically analyzed in the 1890s at Harvard by Edward Pickering and Williamina Fleming, who
29 categorized spectra as A B C D etc, based on the features of the element hydrogen in the spectra. However, it turned out that this ordering system was not correct and in 1901, Annie Jump Cannon reordered the sequence. Rather than using the features of the element hydrogen, she used temperature to order the spectra. The only letters of the original sequence that remained in Jump Cannon’s system were O B A F G K M, which is the spectral classification system that is still in use today. Annie Jump Cannon, who was among the first females to achieve recognition in astronomy, is today justly regarded as one of the founders of stellar astrophysics.
The vertical axis, absolute magnitude and luminosity Luminosity is the most commonly used quantity on the vertical axis of the HR diagram. Luminosity in the astronomical definition is the total energy given off by a star over all wavelengths. To avoid large numbers, it is customary in the HR diagram to express the luminosity in solar luminosities, that is, in units of the total energy the Sun gives off. Note that the luminosity axis on the HR diagram is logarithmic in nature: each mark on the axis is a factor of 10. Instead of luminosity, one can also use a star’s absolute magnitude, which is a measure of how bright a star would be if it were put at a certain distance from Earth. There is a difference between how bright a star appears in the sky, and how bright a star actually is, which depends on the distance (a star can appear bright because it actually is bright, or because it is close to Earth), hence the need for defining a fixed distance. The magnitude system is a left-over from the very early days (classical times) of astronomy. In appendix C the system is discussed in more
30 detail. As mentioned earlier, several other properties of stars can be derived from the HR diagram. Below, three of these properties, stellar radius or size, stellar mass, and the lifetime of a star, are discussed.
Deriving stellar size from the HR diagram The total amount of energy a star radiates, its luminosity, depends on two quantities. The first quantity is how hot the star is; the hotter the star, the more energy it gives off. The second quantity is the size of the star; the bigger it is, the more energy it will give off. Knowing the luminosity and the temperature of a star will thus allow us to solve for the size of the star. For example: if a star is very luminous, but very cool (a star in the “giant” region of the HR diagram), it must be very big to still be able to radiate so much energy. Conversely, if a star is very hot, but very dim (a white dwarf), it has to be tiny to not radiate much energy at that high temperature. The Stefan-Boltzmann law, which puts the relation between stellar size, temperature, and luminosity into a mathematical form, is discussed in appendix C.
Deriving mass from the HR diagram For stars on the main sequence, relative masses can be estimated based on some physical reasoning. A star is a large ball of gas that seems to be stable in size, temperature, and luminosity. Yet within a star two opposing forces are battling for control. The force of gravity tries to compact the star, whereas the radiation energy generated in the star tries to blow the star apart. For a star to be stable, those forces have
31 to be in equilibrium. This means that if a star is more massive, the force of gravity is larger, and more radiation energy is subsequently needed keep the star’s balance. More radiation energy means a higher luminosity. This in turn means that for main sequence stars, more luminous stars are also heavier. This argument is not valid for stars that are not on the main sequence, for reasons that are beyond the scope of this section.
Deriving stellar life times from the HR diagram Based on the considerations that main sequence stars must generate energy to remain stable, one can ask how long this situation can endure. How long can a star “live” in this equilibrium, and what type of star, if there are any differences, will be able to live longest? More massive stars must generate more energy to remain stable than less massive stars, but have more fuel available. It turns out however, that luminosity, the amount of energy generated per second, depends on mass in a strongly non-linear fashion. For example, a star with twice the mass of the Sun will not be twice as luminous as the Sun, but 11 times as luminous. So even though more massive stars have more fuel available to them, they will deplete it much more rapidly because they are so much more luminous. This means that very hot, luminous stars (the O type in the HR diagram) will not be able to be in equilibrium very long, whereas the cool, dim stars (the M type in the HR diagram) can maintain their equilibrium situation much longer. Again, this argument is valid only for main sequence stars. The fact that massive stars cannot be in equilibrium that long has interesting applications. When such stars are observed in the universe (and they are easy to detect,
32 because they are so bright) we know for certain that they must have recently formed. Massive stars also have spectacular ways to announce that they have run out of fuel; they explode in massive supernova explosions, when they temporarily become as bright as about hundred billion Sun like stars, and (depending on the mass of the star) become exotic objects like neutron stars or black holes. These supernova explosions are easy to detect, even from considerable distances, and they have a huge influence on their surroundings.
As may have become clear in this section, the HR diagram not only summarizes properties of stars, but can also be used to make inferences about other properties of stars and how long stars will be able to maintain an equilibrium state. How a star becomes a star, what happens during its time on the main sequence, and what happens after it runs out of fuel are topics of stellar formation and evolution. Here, it suffices to say that typical “normal” stars like the Sun are main sequence stars, and the vast majority of stars (in the order of 90 percent) are main sequence stars. White dwarfs and giants, the two other populations besides the main sequence on the HR diagram, are the result of stars evolving. In summary, the HR diagram is a graphical representation of fundamental aspects of stellar astronomy and contains large amounts of, mostly hidden, physics. To adequately understand the HR-diagram, students need to have a familiarity with most of the concepts listed above and be able to see the complex way in which these concepts interact.
33
1.7 Summary and Outlook on this Dissertation Chapter 1 was intended as a roadmap for the dissertation and has provided the rationale and motivation for the study, sketched the setting and the participant recruitment process, outlined the basic methodology, and provided some of the working definitions of common terminology that are used throughout this manuscript. In chapter 2, the relevant literature pertaining to this dissertation is discussed. Chapter 3 outlines the methodology of this dissertation and discusses the various protocols used to collect, and analyze, the data on which the conclusions will be built. Results of the data collection and analysis are presented in chapter 4 and 5. Chapter 4 is devoted to the individual case studies, whereas chapter 5 deals with the themes emerging from these cases. Discussion of the results, conclusions drawn from the data, and possible directions for future research are discussed in chapter 6.
34 CHAPTER 2: REVIEW OF THE LITERATURE 2.1 Overview In this chapter an overview of the relevant literatures that informed this dissertation study is provided. The three main areas of focus are •
Faculty beliefs about research and teaching in higher education
•
How beliefs about teaching influence the practice of teaching
•
Pedagogical content knowledge in faculty
Also provided is a short review of the literature on lesson plans, concept maps, and Pathfinder, a software package to generate network maps, as those were the tools that were used to elicit beliefs and pedagogical content knowledge of the participants. The various areas of focus presented above are separate fields of study in their own right, and as such this literature review can only present the highlights that are relevant to this dissertation, rather than in-depth analyses of the fields concerned. The literature review focuses primarily on the viewpoint of the instructor, rather than the student, as the research question for this dissertation was focused on the instructor. In section 2.2 and 2.3, the role of faculty in universities and their roles as both researchers and teachers is highlighted. In section 2.4 and 2.5, the concept of faculty beliefs with regards to educational issues is explored. Section 2.6 discusses pedagogical content knowledge, the knowledge of teaching a particular content to a particular audience. Finally, in section 2.7, a background is given on the measurement tools that were used in this dissertation.
35 2.2 Faculty Instructors in higher education are markedly different than instructors in the K-12 realm. Menges and Austin (2001) identified the following areas of differences: the purpose of higher education versus K-12; the different roles, responsibilities, and mission of K-12 and higher education in society; the different responsibilities of professors in higher education and instructors in K-12; the difference in age, experience, and maturity of the students; and the fact that professors in higher education are primarily geared toward and trained in the discipline in which they are working, and are generally not trained as teachers. For this dissertation, the latter point is important and will be expanded on below in a bit more detail. Instructors in Research-I institutions of higher education are not typically hired because of their teaching credentials, but because of their research capabilities (Walczyk & Ramsey, 2003; Weiss, 1992). To be hired in a faculty position in astronomy for example, a Ph.D. in astronomy or related area is a requirement, as well as several years of postdoctoral work (Ivie et al., 2005; Metcalfe, 2008). University faculty have many responsibilities, commonly categorized in three areas: research, teaching, and service. The relative weight of these three areas can differ from institution to institution. Where a small liberal arts college may emphasize the teaching aspect of the job more, a ResearchI university will place more emphasis on the research component. A common workload schedule for faculty in Research-I universities is a 40-40-20 commitment to research, teaching, and service, although this of course depends on the negotiations between a department and an individual faculty member. To be considered for tenure and
36 promotion at most Research-I institutions, the emphasis is on research output and grants or other sources of external funding obtained for the institution, not on teaching quality. Logically, researchers who are up for such a tenure review would value time spent on research as more valuable than time spent on teaching. Besides the institutional emphasis on research, most faculty have had limited experiences with teaching before they become tenure-track faculty (Austin, 2002; Kugel, 1993; Menges & Austin, 2001). Moreover, a large majority have never received any training in pedagogy or education (Austin, 2002; Kane, Sandretto, & Heath, 2002; Walczyk et al., 2007) and as a consequence, most of them learn to teach on-the-job. Lenze and Durham (1999) examined the knowledge about students in faculty members who had limited teaching experience. In a longitudinal study, they asked their participants what they considered to be necessary knowledge of students for teaching, how they dealt with students’ difficulties, and why they dealt with those difficulties in the way that they did. The 35 faculty in this study spoke about the need to know the academic preparation and reasons why students took the class to be able to pitch the course to the level and needs of the students, yet spoke little about student learning and student difficulties. Probing deeper in how faculty dealt with students’ problems about the content, Lenze and Dunham (1999) found that these faculty members had a limited amount of strategies, focusing mostly on teacher-centered pedagogies (repeating part of the lecture, explaining in a different way, referral to office hours) with limited student involvement, though some had experimented with more learner-centered techniques, like for example group work.
37 2.3 Faculty as researchers and as teachers 2.3.1 Views on content Generally speaking, and ignoring service commitments for now, university faculty can be seen as both researchers and teachers. This dualistic role can create a tension because science content seen from a researcher’s and a teacher’s perspective is very different. This dichotomy has been known for a long time. In the classical The Child and the Curriculum, Dewey (1902) points out that for the researcher and the instructor have two different views on the content. For the researcher, the content is organized in such a way as to allow the expansion of the content. New data can lead to new interpretations and one always has to keep an open mind. For the teacher the content is organized in such a way as to allow the representation of the content. For a teacher, the content is organized around a teaching perspective, and how to help students understand the content, whereas for a researcher, the content is organized from a the perspective of advancing the field (Cochran, King, & deRuiter, 1991). Lortie (1975), in his classic study Schoolteacher, observed that the working environment of a teacher is not organized to build the intellectual capital of the field of education, in other words, to move the field forward academically. This tension creates an interesting dilemma for higher education faculty, where the researcher also is the teacher, especially with regards to content representation and in turn to teaching approaches. Is it needed that instructors put off their researcher hat when they teach, or can an instructor’s teaching benefit from his or her background and expertise in research?
38
2.3.2 Tension between teaching and research duties The interaction between research and teaching is rather complex. Marsh and Hattie (2002) review arguments concerning the potential conflict between research and teaching responsibilities. They build on earlier work (Hattie & Marsh, 1996) which found two beliefs in faculty: those who believe that research and teaching are complementary activities, and those who believe they are antagonistic. Arguing the complementary side, researchers who are teachers are likely to know the current frontiers of the field, and teachers who are researchers are forced to present their field in a manner that allows students to see where the faculty member’s specialty falls. Arguing the antagonistic side, it can be said that time spent on teaching is time not spent on research, and research activity is ultimately what the university rewards (Marsh, 1987). Hattie and Marsh (1996) found an overall correlation between research and teaching of 0.06, based on a meta-analysis of 58 studies spanning a variety of academic disciplines, indicating that there research and teaching are decoupled. However, as they (Hattie & Marsh, 1996; Marsh & Hattie, 2002) point out, this correlation is a balance of positive and negative influences, and discuss a large number of variables that can potentially mediate the relation between research and teaching. Variables are for example personal teaching and research ability, satisfaction in doing research and teaching, personal goals, time constraints, time spent on doing teaching and research, extrinsic (departmental, college) rewards for teaching and research, and the beliefs about the nexus between research and teaching. Hattie and Marsh argue that both groups, those who see research and teaching
39 as complementary, and those who see it as antagonistic, can be correct, depending on whether or not research and teaching are used as mutually reinforcing activities, and how the factors mentioned above weigh in a particular situation. For example, Smeby (1998), investigating the role between teaching and research in Norway, found that faculty believe that teaching has a positive influence on their research, but that this is mostly true for graduate courses. He also found that faculty members believe research is more important for teaching than teaching is for research. In another example, Ramsden and Moses (1992) found no relationship between high research output and the effectiveness of undergraduate teaching, arguing against the idea that putting time into teaching is detrimental to the research activity and productivity.
2.4 Faculty beliefs The beliefs of instructors that surface as a result of the tension between research and teaching responsibilities outlined in the previous section is just one of the many beliefs faculty hold with respect to instruction. Before this can be explored in more detail, it is important to more precisely define what is meant by the word “belief”. The phrase was briefly defined in chapter 1, section 5. In this section, the definition of the word in the context of this dissertation is specified in more detail.
40 2.4.1 The difference between knowledge and belief The phrase “belief” in education has been used in a wide variety of definitions. Several review articles in the last two decades have summarized the various definitions and tried to elucidate the construct (Jones & Carter, 2007; Nespor, 1987; Pajares, 1992; Richardson, 1996). Jones and Carter (2007), in a review chapter on attitudes and beliefs in science teachers, summarize the myriad of (implicit and explicit) definitions used in the literature. The definitions vary from equating thoughts to beliefs (Southerland et al., 2001), via tacit and often unconscious assumptions (Kagan, 1992), via statements that are felt to be true (Richardson, 1996), to espoused theories of action (Kane et al., 2002). Among these different definitions in the literature, Smith and Siegel (2004) identified five relationships between knowledge and beliefs that are used in the literature. 1. Knowledge and beliefs are separate constructs with reciprocal impact. 2. Beliefs are integral parts of schema and subsumed in the knowledge construct. 3. Knowledge and beliefs are inseparable and no attempt is made to distinguish between them. 4. The phrase beliefs refers to naïve conceptions, whereas the phrase knowledge implies the presence of scientifically accepted constructs. 5. The terms belief and knowledge are used interchangeably, assuming the difference is interpreted within the context.
Clearly, not all literature makes a clear distinction between what constitutes knowledge, and what constitutes a belief. Though in practice the two can become
41 blended, like in the case where a belief is so deeply rooted as to become axiomatic; unquestionable true statements, and as such become a form of “factual” knowledge. This can be expressed in phrases like “I just know this to be true”, without (much) supporting evidence. Pajares (1992) uses the example of a teacher who “knows that boys are better at math than girls” to illustrate this blend between belief and knowledge. A common agreement on what constitutes a belief in education is quite relevant, as researchers try to link instructor beliefs on teaching and learning to educational practice, for example Appleton and Asoko (1996), who found in a case study on a single elementary school teacher that beliefs about teaching and learning have an influence on classroom practice, Yung (2001), who found marked differences in the way students were assessed based on the views on “fairness” of the instructor involved, and Fang (1996) in a review of the literature. It is not the intention of this section to wade into the complex philosophy of beliefs, as that is outside the scope of this dissertation. However, it is relevant that a definition of belief is offered. For the purpose of this dissertation, a distinction is made between knowledge and belief, following Pajares (1992) and Nespor (1987), who among others, differentiate belief and knowledge in the sense that belief is affective, emotive, and subjective (based on judgment and evaluation), whereas knowledge is cognitive, based on objective fact (the “truth condition” (Lehrer, 1990)), and more clearly defined and bounded (and as such easier subject to reasoned change. Pajares (1992) noted, among other researchers, that beliefs are quite resistant to change, although Pickering (2006), in a study of four novice university lecturers enrolled in a university teaching
42 program, mentioned that with experience, beliefs can be disturbed, creating tensions between beliefs.
2.4.2 Sources of educational beliefs In a chapter in the second edition of the Handbook of Research on Teacher Education, Richardson (1996) summarized research on three sources of instructor beliefs: personal experience, experience with schooling and instruction, and experience with formal knowledge, subject and pedagogy. The first of these sources, personal experience, are life decisions combined with cultural, demographic, and moral background, which help form a person’s world view. This world view subsequently influences how a person sees learning and schooling. The second source, experience with schooling and instruction, is closely related to what Lortie (1975) refers to as the “apprenticeship of observation”. Before becoming instructors themselves, teachers (and faculty) have gone through a lengthy period of instruction themselves, whether those are the years leading to pre-service teaching for a new elementary or secondary school teacher, or all the way through graduate school and postdoctoral work for the new faculty member. In those years, they will have seen teaching and schooling, which will have given them an idea about “how teaching should be done”. This naturally influences the way they think about teaching and learning. The third source of educational beliefs, the experience with formal knowledge, refers to not only subject matter knowledge in a particular domain, but also with the formal knowledge regarding pedagogy. Grossman (1990), among others, noted differences in classroom practice between teachers who had, and who had
43 not had formal training in pedagogy. While faculty will typically not have formal training in pedagogy, some may have more knowledge than others, depending on whether they attended professional development opportunities. While this latter source of beliefs is most likely not as strong as the previous two, it cannot be discounted as an influence on faculty beliefs. A substantial part of this research is qualitative in nature and consists of case studies of instructors. Knowles (1992), in case studies of secondary school teachers, discusses the importance of instructors’ biographies on the formation of their image of themselves as teachers. His biographical transformation model stresses how early experiences, teacher role models (both positive and negative), and previous teaching experiences are interpreted and reflected upon. These reflections lead to meaningmaking of the events and influence the development of the image of oneself as an instructor, as a member of the teaching community. This model is different from Lortie’s concept of the apprenticeship of observation (Lortie, 1975), the idea that you teach in the way you were taught, as Knowles’ model assumes discourse in the development as an instructor, rather than working in relative isolation as Lortie described, and allows for more reflection and interpretation of salient educational events. However, Austin (2002), who examined the socialization process academics go through in graduate school as a preparation for the professoriate, claimed that the apprenticeship of observation is still strong in academia. From these sources, the reason for blending of knowledge and belief is understandable. Experiences, and the memory of experiences, do not necessarily give an
44 accurate picture of the intensity or frequency of an event. Intense experiences are more salient, and thus more likely to stick in memory, than less intense ones. If such an experience deals with an event that does not occur that often, it still may be remembered as “something that happens all the time”, because the memory is so strong.
2.5 Faculty beliefs about their role as instructors 2.5.1 Influences on beliefs Now that the phrase “belief” is put in the context of this dissertation study, the nature of the educational beliefs in faculty regarding their role as instructors can be examined. Pajares (1992) noted that educational beliefs should be made content specific in order to operationalize them, as beliefs tend to be context independent. This operationalization of educational beliefs will be different for each discipline. Quinlan (1999) examined eight academic historians’ educational beliefs. She found that her participants showed common ground in their beliefs on the goals of history education (understanding the present as it is built on patterns of the past, promotion of critical thinking, understanding connections between events), their beliefs about students (lacking in cultural literacy, relatively high variation in academic preparedness), and their beliefs about the role of the instructor (being a stimulus, though often in a didactic manner of instruction). However, Quinlan also found differences in the instructors, in areas dealing with the nature of the discipline, which highlighted the differences that exist in the scholarly field of history,
45 and concluded that educational beliefs were linked to the scholarly conceptions of the field. In a sense, the dependence of operationalization on discipline means that the culture of the discipline shapes the educational beliefs of its practitioners. Besides the culture of the discipline, external factors such as departmental culture and institutional expectations (e.g. the difference in focus on teaching between a Research-I institution and a liberal arts college) also shape the educational beliefs (Kember, 1997; Pickering, 2006). Of course, as was noted in the previous subsection, external factors are not the only things that influence instructor beliefs. Internal factors like experience and conceptions of teaching and learning are factors to be taken into account as well in how someone sees him or herself as an instructor (Dall'Alba, 1991; Kember, 1997; Pratt, 1992; Prosser, Trigwell, & Taylor, 1994; Samuelowicz & Bain, 2001). Several of the studies listed here are discussed in more detail elsewhere in this chapter.
2.5.2 The link between beliefs, intentions, and classroom practice Most of the research on the relationship between instructor beliefs and instructor practice has been done in the K-12 realm, for example in reviews by Calderhead (1996), Richardson (1996), Fang (1996) and Pajares (1992). In higher education, the literature on this topic is comparatively more sparse (see e.g. Kane et al., 2002), though interesting work has been done in the area of professional development of faculty and the link between conceptions of teaching and instructor improvement. Offerdahl (2008), in a case study of three faculty, found three factors associated with change in instructor thinking, namely pedagogical dissatisfaction, opportunities for reflection with a “knowledgeable
46 other”, and experimentation with assessment techniques. Pedagogical dissatisfaction was the main driver for the faculty member completely overhauling his instructional method in a case study by Brogt (2007b). The link to professional development and instructor improvement may link back to the fact that most instructors in tertiary education have little formal training in pedagogy (Walczyk et al., 2007), yet nearly all faculty have teaching responsibilities, and they make pedagogical and curricular decisions that impact their students on a daily basis. All faculty, for no other reason than being exposed to education, teaching and learning, have knowledge, ideas and beliefs about education, teaching and pedagogy, similar to the school teachers who were the subject of Lortie’s famous work (Lortie, 1975). So how do those views influence teaching practice? The beliefs instructors have about faculty influences their practice in the classroom. In a study on 20 faculty in Australia, Burroughs-Lange (1996) found that many of the faculty saw their role as didactic, i.e. transmitters of knowledge. A similar result was obtained by Jacobs and Gravett (1998) in a study of 19 faculty in South-Africa. Martin, Prosser, Trigwell, Ramsden, and Benjamin (2000) in a study with 26 university teachers in Australia found a relationship between an instructor’s intentions and practice. They noted that two views on knowledge were prevalent in the instructors; those who saw knowledge as given, and those who saw knowledge as being constructed. Martin et al. found that that instructors who viewed knowledge as given adopted more teachercentered approaches whereas instructors who viewed knowledge as being constructed by the students adopted more student-centered approaches. The instructors’ intentions for the class were also closely aligned with the expectations for student learning, and that
47 when focused on a specific topic, the intentions and teaching practice were closely associated. Kember and Kwan (2000) studied 17 lecturers of various experience and academic rank and found that their participants fell into two categories: instructors who viewed teaching as transmissive and instructors who viewed teaching as facilitating. Further, they found that the former category of instructors primarily used teachercentered methods of instruction whereas the latter used more learner-centered approaches. Trigwell and Prosser (1996) examined the connection between university science instructors’ intention and approaches to teaching. They found that a conceptual change intention was associated with a student-centered strategy, and an information transfer intention was associated with a teacher-centered strategy. A similar result was found by Van Driel, Bulte and Verloop (2007), who surveyed over 300 secondary chemistry teachers in the Netherlands. They found two belief structures: a content oriented belief that was associated with the teaching of fundamental, theoretical concepts, and a learner-centered educational belief that was associated with a curricular belief that emphasized the learning of knowledge in chemistry in relation to society. In addition, a number of participants showed a mixture of the two dominant belief structures. This split in two distinct belief structures was a result that was also found by Kember (1997) in a synthesis of the research. Kember subdivided the two belief structures into two more structures. The teacher-centered, content-oriented structure can be divided into “transmitting structured knowledge” and “imparting information”, and the student-centered, learning-oriented structure can be divided into “facilitating
48 understanding” and “conceptual change, intellectual development” strands. Kember (1997) and Kember and Kwan (2000) argue for a third major, intermediate category of belief structures that links the teacher-centered, content-oriented category with the student-centered, learning-oriented category. This intermediate category is characterized by some student-teacher interaction. Data by Samuelowicz and Bain (2001), in a study with 39 faculty spread over 9 disciplines, provided support for the existence of such an category. However, Devlin (2006) challenges the primacy of the conceptions of teaching in the improvement of teaching and student learning. She discussed the assumptions underpinning the importance of conceptions of teaching (the causal relationship between teaching conceptions, teaching practice, and student learning; teaching improvement depends on a student-centered conception of teaching; the limits of a skill-based approach to teacher development) and notes that these assumptions are not necessarily supported by the currently available evidence. For example, she states we really do not know from the available research evidence whether changes in conceptions must come before changes in practices; vice versa or whether changes in both conceptions and practice might occur together over a period of development and beyond in no fixed order. (Devlin, 2006, p.117) Though a hierarchical model, in which ideas change before practice does, seems to make intuitive sense, it is important that such intuitions are backed up by the research evidence. Another possible obstacle in this set of ideas is the scope of the conceptions of teaching. In a phenomenographic study interviewing 20 higher education instructors in
49 four different areas (English, medicine, physics, and economics), Dall’Alba (1991) identified seven qualitatively different conceptions of teaching: •
teaching as presenting information
•
teaching as transmitting information
•
teaching as illustrating the application of theory to practice
•
teaching as developing concepts/principles and their interrelations
•
teaching as developing the capacity to be expert
•
teaching as exploring ways of understanding from particular perspectives
•
teaching as bringing about conceptual change,
It should be noted that these different conceptions about teaching focus on content. No motivational or affective goals for teaching (exciting students about the material, promoting students’ self-efficacy, etc.) are present. In the literature in this section, there is also evidence for faculty seeing themselves as gatekeepers of the discipline. They set high standards for success and failure and students are measured against those standards. However, in introductory classes for non-science majors, where students are unlikely to pursue the content area further in advanced classes (or major in the area), the question which gate is being kept becomes an interesting one.
2.5.3 Congruence between world view and practice Stark (2000) investigated the decision making and course planning of college faculty who are teaching introductory courses in a three year study. The study consisted
50 of three phases. In the first, 89 faculty members were interviewed about course planning. The results were used to create the Course Planning Survey, which asks questions about the nature of the field, purpose of education, content sequence, and course planning. In the second phase of the study this instrument was administered to 2300 faculty members, and in the third phase the Course Planning Survey was used with a smaller sample of faculty members who instead of preparing an introductory course, were asked to plan for an advanced course. Stark (2000) found that instructors’ beliefs about students and about the discipline itself are a strong influence on course and lesson planning. The influence of these beliefs was also found by Southerland, Gess-Newsome and Johnston (2003). They examined three college science teachers who co-designed and coinstructed a general education college science course, emphasizing the nature of science throughout the curriculum. Southerland et al. found that the personal views of the faculty members concerning the nature of science would shine through in their teaching, even if those views were not aligned with the course’s view on the nature of science. When the views of the faculty member aligned with the course, it did also not necessarily mean that those beliefs were easily translated into practice, with one of the mitigating factors being a lack of pedagogical content knowledge. So while the faculty members did have sophisticated views, they did not always get put into classroom practice, which can be interpreted as content knowledge not being sufficient for teaching, but pedagogical content knowledge (Shulman, 1986b, 1987) being needed as well. In section 2.6 the concept of pedagogical content knowledge is discussed in more detail.
51 Also examining the views on the nature of science, this time in elementary teachers in the United Kingdom, Lunn (2002) found that views of science expressed by teachers and those inferred from their classroom practice were largely consistent. Although in this dissertation no observations were done (see chapter 3 for more details), it is interesting to note that some work has been done in the observational aspects of approaches to teaching. Magnusson, Krajcik and Borko (1999) compiled an overview of different approaches to teaching, their subsequent learning goals and observables in the classroom setting. Martin, Prosser, Trigwell, Ramsden and Benjamin (2000) found similar results as the studies above. They examined 26 faculty members in a phenomenogric study and found that instructor intentions and expectations of students have a large influence on teaching practice, and that when teaching a specific topic, intentions and teaching practice are closely aligned. In addition, Martin et al. noticed that if instructors have a tranmissive view of teaching, they view knowledge as something external to the student, whereas instructors who have a more student-focused approach to teaching focus more on the students’ knowledge structures. In a more recent study using participants from a similar population as the participants in this study, college astronomy faculty, Dokter (2008) found that college instructors taught in manners consistent with their views of teaching, and implemented curricular materials given to them in a workshop that advocated a specific implementation (Brogt, 2007c) in ways that were more consistent with how they viewed teaching and student learning. In other words, instructors teach the concepts, and
52 curricularize the content, in a way that is consistent with their own world view on teaching and learning. This also means that two teachers who hold different worldviews can teach the same concept quite differently. These arguments lend credence to the statement that instructors are shaped by both their experiences as a student, and their specific training as a researcher in their academic discipline. Though it appears that instructors, regardless of the level at which they teach, teach in a manner consistent with their world view and their practices in the classroom reflect that. As this dissertation deals with teaching and beliefs in tertiary education, the next subsection will focus specifically on the knowledge structures that influence teaching in higher education.
2.5.4 Types of knowledge influencing tertiary education Rahilly and Saroyan (1997a; 1997b) surveyed 102 inexperienced, experienced, and award winning instructors using the Critical Incident Questionnaire, in which participants were asked about instances of poor and exemplary teaching. They noticed qualitative differences in the responses of the instructors, with more inexperienced teachers citing as an example of exemplary teaching the execution of a well thought-out teaching plan, whereas award winning teachers cited instances in which they could be flexible and adapt their teaching on the fly based on their “feel” for the classroom. This result is similar to what McAlpine and Weston (2000), who asked six instructors (three math educators and three mathematicians) who were considered exemplary to reflect on their teaching. They found that instructors who were considered exemplary held, and used, considerable knowledge about learners, both about individual learners and about learners as a group.
53 Rahilly and Saroyan (1997a; 1997b) also found that four types of knowledge influence the higher education classroom: pedagogical content knowledge, content knowledge, current knowledge of learners, and knowledge of learners’ backgrounds and appropriate pedagogy. They further conclude that university professors base their teaching primarily on content knowledge, but that professors’ knowledge base is differently organized than the knowledge base of instructors at other levels of education, and that the definition of content knowledge in higher education is more than declarative knowledge. This dissertation is about exploring the curricular and pedagogical thinking of faculty regarding teaching one particular topic to one particular audience. The “how” and “why” they teach that content to that audience in the way chosen, is the domain of one of the facets mentioned by Rahilly and Saroyan (1997a; 1997b), namely pedagogical content knowledge. In the next section, the concept of pedagogical content knowledge is explored in detail.
2.6 Faculty pedagogical content knowledge 2.6.1 Definition of pedagogical content knowledge Closely tied to the faculty beliefs about content representation is the actual knowledge on how to represent a body of knowledge to a particular audience. In the literature, this type of knowledge is referred to as Pedagogical Content Knowledge, or PCK for short, and is distinct from Content Knowledge, and Pedagogical Knowledge.
54 PCK was introduced by Shulman (1986b; 1987) and can be described as “knowledge about the interaction between learning process and academic content” (Ronkowski, 1993). The subject matter knowledge is molded into a form that is suitable for teaching, a view echoed by Van Driel, Verloop and De Vos (1998), who identified teaching experience as a major source for pedagogical content knowledge, and noted that sufficient content knowledge is a prerequisite for the development of PCK. Van Driel et al. (1998) put pedagogical content knowledge in the realm of craft knowledge, considering PCK to be a specific form of craft knowledge (Grimmett & MacKinnon, 1992): specialized knowledge needed in the teaching profession. It should be noted that the phrase “craft knowledge” as it is used in the context of this dissertation is nonjudgmental. In the past, a distinction was made between craft knowledge and theoretical knowledge. It is not the intention here to explore the tensions between these two forms of knowledge (see e.g. Leinhardt, 1990, for a discussion) or to revisit the discussion of teaching as a profession. In this dissertation, the act of teaching is considered a highly cognitive skill (Leinhardt & Greeno, 1986) and PCK, as a form of craft knowledge, is the special knowledge that distinguishes a science teacher from a scientist (Cochran, deRuiter, & King, 1993; Shulman, 1986a, 1987) and gets the job of teaching done. Doyle (1992) argues that PCK is a sign of professionalism in an instructor. This view is corroborated by Holt-Reynolds (1999), who found in a case study with a content expert in English that subject matter knowledge does not always translate into understanding about how to model that knowledge or share it with students. Carter (1990), who examined teachers’ knowledge and how teachers learn to teach, and Doyle (1992), who
55 approached the intersection between pedagogy and curriculum from a theoretical point of view, see PCK as an attempt to determine what teachers know about the subject matter and how they translate that knowledge into classroom curricular events. The relationship between PCK, pedagogy and content knowledge is succinctly summarized by Alonzo (2002), who argued in her evaluation of a model to support the development of science content knowledge in elementary school teachers that teachers needed three facets of knowledge: content knowledge, pedagogical knowledge and PCK. These three facets are the founding pillars of teacher knowledge and all three are needed for effective teaching. This sentiment was echoed by Kennedy (1998) who, in a literature review discussing educational reform and the amount of math and science teachers need to know to these topics well, found that recitational knowledge is not a sufficient knowledge base for teaching. Loughran, Mulhall, and Berry (2004) summarize the role of PCK in science teaching as The foundation of (science) PCK is thought to be the amalgam of a teacher’s pedagogy and understanding of (science) content such that it influences their teaching in ways that will best engender students’ (science) learning for understanding.” (p. 371).
Since its inception, PCK has got considerable attention in the research, and refinements in the definition have been made and proposed. These different types of pedagogical content knowledge are the topic of the next subsection.
56 2.6.2 Different types of pedagogical content knowledge Veal and MaKinster (1999) noted that PCK is not accurately addressed in the construction of models for the development of science teachers. In order to help remedy this so that models for professional development can be improved, they present a taxonomy for PCK that divides the construct into three distinct (hierarchical) areas: General, domain-specific, and topic-specific PCK. Unfortunately, the terminology from Veal and Makinster (1999) differs slightly from the terminology used by Magnusson et al.(1999). Below, these three types are noted, using the terminology of Veal and Makinster and Magnusson et al. side by side for clarity. General PCK General PCK is the application of pedagogy and pedagogical strategies to a specific content area. In the case of this dissertation that would be “science”. Magnusson et al. (1999) refer to general PCK as “subject specific” PCK. Veal and MaKinster (1999) see this as the most general level of pedagogical content knowledge. Domain-specific PCK One step up on the specificity ladder of PCK is domain-specific PCK. This is defined as an understanding on how to teach students within a certain subfield of the science. In the case of this dissertation, the domain would be “astronomy”. In the terminology of Magnusson et al. (1999) domain-specific PCK is called “topic-specific” PCK. Topic-specific PCK
57 However, in the definition of Veal and MaKinster (1999), topic-specific PCK is an even higher level of specificity of PCK. It deals with the understanding of teaching a particular topic area, its concepts and the interrelatedness between those concepts. In the case of this dissertation, the topic would be the “stellar astronomy”, as opposed to for example “cosmology”, which deals with vastly different concepts. One of the concepts within that topic of stellar astronomy would then be the “properties of stars” and one of the concepts in that topic would be “HR diagram“. Topics can be approached differently across domains, depending on the content background of the instructor. Veal and Kubasko (2003) studied the topic-specific PCK on the concept of evolution in biology and geology instructors. They found differences in emphasis and terminology used and noted that these differences were mostly due to the differences in the two scientific communities. In other words, the teaching of the topic of evolution depended on the scientific background domain of the instructor.
2.6.3 Conceptualization of pedagogical content knowledge Over the last 20 years, several authors have discussed the place of PCK in the pantheon of teacher thinking, knowledge, and beliefs. In a 2005 article, Hashweh (2005) summarizes the main influences on the concept, and place of, pedagogical content knowledge. In Shulman (1986a) PCK was seen as a part of the construct of content knowledge, topic specific (which was also emphasized by Van Driel et al. (1998)), and includes knowledge of representations (the transformation of subject matter for teaching), as well as knowledge of learning difficulties and strategies to overcome them. In
58 Shulman (1987) PCK is its own separate category in the knowledge base for teachers, and is no longer part of content knowledge. The other categories for the knowledge base were: content knowledge, general pedagogical knowledge, curriculum knowledge, knowledge of learners and their characteristics, knowledge of educational contexts, and knowledge of educational ends, purposes and values (Hashweh, 2005, p. 275). In 1990, two authors added to the Shulman’s list of what constitutes PCK. Marks (1990) added content knowledge, making content knowledge a subset of PCK, rather than the other way around, and Grossman (1990) added knowledge and beliefs about purposes, and knowledge of curriculum materials. The adding of beliefs and purposes was also emphasized by Gudmundsdottir (1990), who argued that PCK is mediated by the values of the instructor. Recently, Dokter (2008) also found that college instructors adapted the implementation of workshop materials (which had specific instructions on how to use them) to fit their own pedagogical views, corroborating Gudmundsdottir (1990) in that respect. Yet the concept of pedagogical content knowledge has not been without its critics. Cochran, deRuiter and King (1993), arguing from a philosophical constructivist perspective, stating that the phrase knowledge is too static preferred the term Pedagogical Content Knowing, rather than Pedagogical Content Knowledge, to reflect the more dynamical nature of the concept. Pedagogical Content Knowing, typically denoted as PCKg in the literature, encompasses knowledge about students, environmental contexts, pedagogy and subject matter. While I personally agree that all these four facets are relevant in the art of teaching, I disagree that they are all necessarily tied to the content, most notably the environmental contexts, which to me are in the domain of pedagogical
59 knowledge. Hence, in this dissertation however, the original idea of Shulman (1986b; 1987) is used, namely the molding of the content in a form that is suitable for teaching to a particular audience. One way of conceptualizing pedagogical content knowledge, is to ask the people who are supposed to have it. In empirical study, Lee and Luft (2008) did exactly that interviewed instructors and asked them to conceptualize PCK. In Table 1 below, the components which surfaced from this qualitative study are summarized.
Components Knowledge of science
Elements Science content, scientific practice, the nature of science, scientific process. Knowledge of goals Scientific literacy, real-life application, integrated understanding Knowledge of students Different levels, needs, interests, prior knowledge, ability, learning difficulties, misconceptions. Knowledge of curriculum State and local standards, state and local organization standardized tests, making connections between lessons and units, organizing lessons in specific order, making decisions about what to teach, flexible design. Knowledge of teaching Various teaching methods, use of motivating activities, ability to select effective activities. Knowledge of assessment Formal and informal ways of assessment, skills for students’ discussion and questioning, immediate feedback. Knowledge of resources Materials, activities, multimedia, local facilities, laboratory technology, science magazines. Table 1: Components of PCK, adopted from Lee and Luft (2008, p. 1352) These elements are very close to the components of PCK as suggested by Hashweh (2005), which included: subject matter, aims/purposes, student characteristics, teaching (which includes different types of lessons, explanations, activities, and
60 assessment), curriculum, resources, and context. All these components were obtained from experienced science teachers, but how did these components develop in those instructors? In the next subsection, the development of PCK in instructors is briefly discussed.
2.6.4 Development of pedagogical content knowledge How do university instructors develop PCK? In the K-12 arena, teachers go through a teacher preparation program in which some of the aspects are covered. Subject matter knowledge is important in order to teach the content effectively (Allen, 2003; Schwartz & Lederman, 2002). Ball and Bass (2000) claimed in the field of mathematics that in teachers must know the content sufficiently and flexibly such that it can be used within a wide variety of context in order to make mathematical knowledge usable. Building on Ball and Bass (2000), it can be argued that their claims are, mutatis mutandis, also valid for other content areas, not just mathematics. PCK builds on content knowledge and as a result teachers need the content knowledge to have a basis from which to transfer to curriculum content and adequate pedagogy in a classroom setting. In the case of university faculty teaching a non-science major course, the level of content knowledge can be assumed to be sufficient. Lowery (2002), who examined the context in which PCK is best acquired by elementary teachers, found that content-specific and school-based experiences help teachers become more confident in teaching the material and help improve understanding of the content. This suggests that PCK is also acquired in authentic contexts of learning
61 situations. In fact, Ball and Cohen (1996) found that developing new methods for teaching is more powerful for instructors than reading about it. Hence, while not being formally trained in teaching, university faculty can be very effective instructors, simply by having had the experience as instructors and acquiring the skills along the way. The element of experience shows up in other studies as well, especially in studies of craft knowledge. Craft knowledge, or wisdom of practice as it is sometimes referred to, is defined as the knowledge that instructors have constructed about teaching based on their experiences and practice (Calderhead, 1996; Fenstermacher, 1994). Leinhardt (1990) describes craft knowledge as including “deep, sensitive, location-specific knowledge of teaching, and it also includes fragmentary, superstitious, and often inaccurate opinions” (p. 18). Past experiences leading to the craft knowledge can get applied to the present context in what is called “personal practical knowledge” (Connelly & Clandinin, 2000). In university instructors, who have, as mentioned before, usually little training in pedagogy or teaching (Walczyk et al., 2007), the craft aspect can become important. Leinhardt (1990) noted in a review that there exists a tension between theoretical knowledge about teaching, being more generally applicable than craft knowledge, which by its nature is rooted in practice and thus more specific to a particular set of circumstances. While the participants in this study may not have the theoretical knowledge about teaching (which essentially makes the discussion about theoretical and craft knowledge, which appeared in the research on teaching literature in the 1970s and 1980s, moot), they do have a considerable amount of experience teaching the class, and
62 have formed beliefs about teaching, learning, and the material. The trick now is to elicit and uncover the knowledge and beliefs, which is the topic of the next section.
2.7 Measuring instructor beliefs and pedagogical thinking Pedagogical content knowledge, despite its rather clean definition, is an elusive concept to measure and qualify, in part because it is a construct that is internal to the instructor (Baxter & Lederman, 1999). Several authors note or review that much teacher knowledge is tacit and contextually bound, and as such, teachers may not have a language to adequately express their beliefs (Carter, 1993; Kane et al., 2002; Korthagen & Kessels, 1999; Loughran, 2008). This effect is arguably more pronounced in university faculty, as they have little training in pedagogy and have generally not been exposed to the language of education. In recent years, attempts have been made to get a better handle on the construct of pedagogical content knowledge. Loughran et al. (2004) did a two-year longitudinal study with fifty science teachers to capture pedagogical content knowledge. They found that an extended period of (observational) time may be needed to watch PCK unfold in the classroom. They also noted that while teachers commonly share activities and teaching procedures one another, the reasons for why they do those activities is not communicated as much. Loughran et al. developed a method to document PCK in two ways. The first is the capturing of the science content in a Content-Representation (CoRe), and the second is the documentation of the practice of teaching in a Professional and Pedagogical experience Repertoire (PaP-eR). This method may have interesting applications for
63 professional development at the tertiary level, though the model was originally developed with secondary science teachers in mind. As was mentioned in an earlier section, Lee and Luft (2008) asked instructors to conceptualize PCK. But the question arises whether this is the right (or only) way to measure instructor PCK. In a review, Abell (2008) asks the exact question. Does one ask the instructors themselves, their mentors, their professors, or their students? Who determines what counts as PCK, and how is this measured? Asking the instructors comes with its own set of challenges. In this dissertation study, only the instructors were accessible (see chapter 3 for more details). Measuring pedagogical content knowledge may indeed be a difficult task. It appears to be one of these constructs that “you know it when you see it”. In the case of studying pedagogical content knowledge in higher education an additional complication arises, namely the high level of the content. Arguably, one has to be well vested in the content and the areas where students will face difficulties to recognize pedagogical content knowledge in action. What this study adds to the existing literature is the fact that the researcher is a content expert in the area of the college-level astronomy that was examined. In this dissertation, a multitude of instruments were used to avoid researcher bias, as explained in chapter 3. Inspiration for the instruments was taken, among others, from Calderhead (1996), who discusses several techniques to unearth beliefs, among which case studies, and concept mapping. These two techniques, combined with lesson plans and a network mapping tool called Pathfinder, were used as the main methodology of this
64 dissertation. In recent work, Briggs, Harlow, Geil and Talbot (2007) and Briggs and Talbot (2008) used general prompts for instructors to address a teaching situation. After the instructor responded, the next prompt would be along the lines of “your approach does not work”, to try and measure “pedagogical sophistication”, in essence the depth of the bag of tricks instructors have at their disposal. This work is still being piloted and has not yet been adapted for specific topics, but the first results are promising. In the next chapter, the methods used, and the considerations and rationale for using these methods, is discussed in detail.
2.8 Conclusions In this literature review, an introduction into the various research fields that were used in this dissertation to help answer the research question was presented. Based on the literature on faculty members’ view of their roles, a content based approach to teaching the HR diagram was expected, meaning that the focus was expected to be on the physical concepts outlined at the end of chapter 1, and the relationships between the different concepts based on the laws of physics. Based on the fact that the faculty’s training in teaching is limited, a relatively narrow range of goals, implementation strategies and pedagogical content knowledge was expected. The effect of the experience that the instructors had in teaching the class was the unknown factor in the equation. In order to explore the pedagogical thinking of the participants about the HR diagram, a qualitative methodology was chosen. The methodology, data gathering instruments, and analysis procedures are discussed in the next chapter.
65 CHAPTER 3: METHODOLOGY 3.1 Introduction At the end of chapter two, the issue of measuring pedagogical thinking was brought up and it was mentioned that this is not an easy task to do. In this chapter an overview is presented of how measuring pedagogical thinking was done in this dissertation, and a structure is provided as to how the different data sources helped answer the research question. As the reader will notice in this chapter, the study used qualitative data, in the form of two semi-structured interviews with participants, one at the beginning of the semester, and one at the end. In between the two interviews, participants were asked to complete several assignments, here loosely labeled “cognitive tasks”, to supplement to interview data. Participants developed a lesson plan, a concept map, and did a rating task. In the second interview, the results of these tasks were discussed with the participants. This chapter starts with an overview of the methods that were chosen for this dissertation and how these methods and data sources tie in to the research question. Following this overview, two consecutive sections deal with the people involved in the study: the participants and the researcher. As this study got its data through human interactions in the interviews, the researcher was an instrument, and as such his lens should be made explicit. The participants are profiled in the section after that, to give the reader an idea of the background of each of them. This section is then followed by several sections that highlight and discuss each data source (interviews, cognitive tasks) in detail. As the reader will see, the data sources were pretty fluid, without a clear
66 demarcation, as the cognitive tasks were discussed in the interviews, and interview questions were revisited. This is why the section about the analysis is a stand-alone section, discussing the data holistically, rather than the analysis procedures of each method being discussed in their respective section. The primary purpose of a methodology chapter is to inform what was done, and how it was done. However, no methodology is chosen at random. Thorough considerations and deliberations are part of designing a dissertation study. At the end of this chapter a separate section discusses in detail how and why the methods used in this study were picked. This section was included to allow the reader to follow, weigh, and judge the considerations and deliberations that came with adopting a method.
3.2 A general overview of the time line and the methods used in this dissertation The design of the study was done in collaboration with the dissertation committee in the spring and fall semesters of 2007. In order to determine whether participants could be found, several potential participants were informally asked if they would be interested in participating should a study like this be done. When sufficient potential participants mentioned that they indeed would be interested, the formal research proposal was written in consultation with the dissertation committee. Institutional Review Board approval for the study, needed as the study involved human participants, was sought and obtained. Those readers interested in the details of obtaining IRB approval for a study with human participants are referred to a summary article by Brogt, Dokter and Antonellis (2007) in which this process is discussed. After IRB approval the study could formally start in
67 January of 2008, and participants could be recruited. As was mentioned in the introductory chapter of this dissertation, the following research question was explored in this study. What is the pedagogical and curricular thinking of professional astronomers when teaching the Hertzsprung-Russell diagram and to what ideas is this thinking related?
This research question actually consists of two parts: the pedagogical and curricular thinking, and the ideas to which they are related. In Table 2 and Table 3 below, a brief overview is presented how the different data sources helped answer this research question. Note that the data sources below are in chronological order, in the sequence in which they were gathered over the course of the spring 2008 semester. The timeline and sequencing of collecting data were important in this study, because several elements in the study, like the interviews, had the potential to influence participants’ thinking about their instruction. As this study was not intended to be an intervention, but a description of naturalistic observations of existing beliefs and strategies, it was important not to disturb that cognitive status-quo in participants. I wanted to avoid participants becoming more meta-cognitive about their beliefs, teaching, and pedagogical approach during the early stages of the study as much as possible as not to bias the data. To this end, the more reflective interview questions were loaded toward the end of the data collection phase, in the second interview.
68 The first interview was done at the beginning of the semester, the cognitive tasks in the middle of the semester, and the second interview toward the end of the semester. The exception to this rule is cognitive task IV. This task was an integral part of the second interview, but stood separate from the rest of the interview. The reasons for this are explained in detail in the appropriate section. Data Source Semi-structured interview I
Cognitive task I: creation of lesson plan Cognitive task II: concept map Cognitive task III: Pathfinder rating task Cognitive task IV: stereotypical student statements Semi-structured interview II
Purpose • • • • • • • •
Create rapport with participants Academic and teaching background of participants General teaching philosophy General thoughts on the role of nats102 General thoughts on teaching the HR diagram Determine curriculum and academic tasks for the HR diagram lesson Determine how participants want concepts related to the HR diagram to be organized in their students Determine influence of extraneous factors on the pedagogy
•
Determine what types of pedagogy are used in dealing with common student difficulties with the HR diagram
• • • •
Follow-up questions from the first interview Reflection on lesson plan task Reflection on concept map task and Pathfinder network Reflection on stereotypical student statements
Table 2: Purpose of the different data sources The different data sources are related to the research question in the manner lined out in Table 3 below. The different purposes of each data source are discussed in the respective sections about the data source. Research Question What is the pedagogical and curricular thinking?
Data Source Course goals (part of interview I) and HR diagram lesson goals (interview I and II)
Justification Identifies what the participant deems important in the course and the HR diagram
69
To what ideas is this thinking related?
Stereotypical student statements (cognitive task IV, part of interview II) Reflection on lesson plan (cognitive task I, reflected on in interview II) Teaching philosophy (part of interview I) Views on the purpose of nats102 (part of interview I) Reflection on lesson plan (part of interview II) Reflection on stereotypical student statements (cognitive task IV, part of interview II) Pathfinder rating task and network map (cognitive task III, reflection part of interview II) Most common problems with HR diagram for students (part of interview I and II)
Participants have to think on their feet, so they will most likely fall back on their deep-seated ideas about pedagogy and curriculum Participants will show their choices on curricular matters in what they emphasize in the plan Overarching views on teaching, learning, pedagogy and curriculum Triangulation for the teaching philosophy, as it may be influenced by the target audience Gives insight in why certain choices were made in the lesson plan Gives insight in why certain choices were made in dealing with the situations in the stereotypical student statement Triangulation to determine if different participants have different mental structures about resources and the impact of the resources on the pedagogy To what extent is the pedagogy and curriculum based on what the participant thinks the students are capable of?
Table 3: Overview of the use of different data sources to answer the research question
Before a detailed discussion is held on the individual methods of data collection, their purposes, and the implementation, it should be noted that this study relied primarily on qualitative data, and that these data were gathered as a result of a human interaction between the researcher and the participants. As a result, the researcher, with his
70 particular background and experience, is an integral part of the data collecting instrumentation, and serves as a lens through which the data are interpreted. In the next two sections, the positionality of the researcher, and the profiles of the participants are sketched, so that the reader knows who were involved in this research. As a positionality statement is an inherently personal piece of writing, it is written in the first person, in contrast to the majority of this dissertation.
3.3 Positionality I came to this study as a former astronomer, with a passion for the stellar astronomy. In the Netherlands, my home country, I studied astronomy at the Kapteyn Astronomical Institute of the University of Groningen, where I wrote a master’s thesis on observations of a particular type of variable stars. Most of my experiences have been in observational optical astronomy, using telescopes such as the ones on Kitt Peak near Tucson to gather data for a variety of different projects. These experiences, as well as experiences I had when I worked as a calibration analyst for the detector of a space instrument, have given me a reasonable background in the science (and art) of gathering and analyzing astronomical data. I have also been involved in a project in computational astrophysics, where my collaborators and I worked on stellar modeling the physical properties of an aggregate of stars. It was in that latter project (Ng, Brogt, Chiosi, & Bertelli, 2002) that I learned about the power of the HR diagram and derivatives of that diagram (color-magnitude diagrams) as a tool to analyze the physical properties of star clusters.
71 My experiences and background allow me to still speak the language of professional astronomy, and to remain part of the culture of astronomy. I hoped that my background as a professional astronomer would help me to create rapport with the faculty in this study. I had a sense prior to the study that I was seen in the department as an astronomer who decided to move to educational research, and as such still part of the community of astronomers, rather than as an (outside) educational researcher who happens to study astronomers. Before the study began I considered myself a hybrid researcher: part astronomer, part educator (Brogt, 2007a). English lacks a proper word for this specialty, and the best word for my position is the German word Fachdidaktiker (vakdidacticus in Dutch), a specialist in the teaching and learning of a content area. I hoped that it would be easier for the participants in this study to relate to me and to my educational work and research. I also hoped it would be easier for them to express themselves, as they could use shorthand and “astro-speak” with me. The participants are all part of the same department of astronomy I worked in. As such, they both knew me as a person as well as my stance on educational matters. In the past, I had assisted several faculty members on matters of teaching and education. The fact that I am an astronomer, and that the participants knew me, presented a few potential problems, which influenced part of the design of the study. In section 3.13.3 I elaborate on these considerations further. Now that the reader has some familiarity with me as a data gathering instrument and my background in astronomy and education, I will now introduce the other decidedly human aspect of this study, namely the participants.
72 3.4 Participants profiles and course history In this section, the reader is introduced to the five faculty members who agreed to become participants of the study as well as the history of the nats102 course at the university. The latter is provided because the teaching of nats102 cannot be seen independently from the history of the course, given that all participants have been at the university long enough to have witnessed an overhaul of the general education science curriculum. Among the first things they were asked in the first interview were questions about their own academic background; what they do on a daily basis and how they got to where they are now. The answers to these questions were used to sketch the academic profiles below, in alphabetical order Hugh, Jeff, Linda, Paul, and William. Naturally, all names are pseudonyms, as per Institutional Review Board requirements concerning the protection of privacy of participants. 3.4.1 Participant profiles Hugh Hugh is a full professor in the department. A physicist by training rather than an astronomer, he started his research in the gamma ray regime. Exploring the connections between gamma ray and infrared astronomy, he switched to infrared as a result of a job offer. He arrived at the University of Arizona in 1970. His research in Arizona is currently centered around data coming from an infrared detector on a space mission, for which he is the Principle Investigator. Hugh obtains a considerable amount of scientific data on the formation of planetary systems and active galactic nuclei that are analyzed by
73 him, his postdoctoral fellows and graduate students. Hugh has taught the introductory astronomy course for non-science majors about twenty times, and currently team teaches two sections of this course with Linda, his wife, every year. Prior to coming to the University of Arizona, his teaching experience was limited to being a teaching assistant in a physics lab.
Jeff Jeff is a full professor in the department, where his research focuses primarily on interstellar and circumstellar matter. As an undergraduate, Jeff did a summer research project which sparked his interest in radio astronomy. He did his graduate studies studying radio spectroscopy of molecules in space after which he became a postdoctoral fellow in Germany. Upon completion of that postdoc he returned to the US and spent the next twelve years as a research staff member, a position in which he had some teaching responsibilities, primarily for undergraduate astronomy majors. He then moved to the University of Arizona in 1990 and has been on the faculty ever since. During his time in Arizona, he has taught the introductory class for non-science majors seven or eight times, most recently in the fall semester of 2006, when I was his teaching assistant. Jeff described his teaching experience prior to becoming a faculty member at the University of Arizona as being a teaching assistant for a physics lab while in graduate school, and teaching astronomy majors in his staff position. He had no teaching responsibilities while he was a postdoctoral fellow in Germany.
74 Linda Linda is a full professor in the department and her research has focused on the nuclei of galaxies, and has moved in recent years more toward high redshift galaxies and galaxy evolution. The bulk of her time is currently being taken up by being the Principal Investigator for an infrared instrument that is being built for a space mission. Linda started out as a physicist and became an infrared astronomer in graduate school, when the field was still very new. She arrived in the department of astronomy in 1976 as a postdoctoral fellow and became part of the faculty in 1983. Linda is currently on a reduced teaching load, due to her responsibilities as a Principal Investigator. She has taught the introductory class for non-science majors about twenty times, and has been team teaching the class lately with Hugh, her husband. Prior to coming to the University of Arizona, she had no teaching or mentoring experience at all, except some informal tutoring.
Paul Paul is an associate astronomer in the department. In contrast to the other participants, Paul’s work does not primarily involve research. Although he is still working on project related to x-ray astronomy, in which he got his Ph.D. and did postdoctoral work in, his primary responsibilities are in the areas of teaching, public outreach for the department, providing expertise about the general education courses to the faculty and the use of technology in the classroom. After obtaining his Ph.D. he worked in Germany on a NASA grant. He returned to the US in 1993 and came to the
75 University of Arizona. While there, he filled in for several faculty members with teaching for which he won the Provost General Education Teaching award. Paul teaches one course a semester, and always either the introductory course for non-science majors or a course focused on stars, also geared toward non-science majors. The latter course was his conception, he designed it and has been the instructor ever since. He has taught the introductory course about ten times. Before obtaining his Ph.D., Paul had substantial experience in teaching, both as an undergraduate (two semesters) and as a graduate student (eight semesters).
William William is a full astronomer in the department. In contrast to other people on the astronomer track (with the exception of Paul) at the University of Arizona, he has teaching responsibilities, making him for all intends and purposes indistinguishable from a full professor. William’s research focuses on stellar astronomy, and in particular the oldest stars in the Milky Way and nearby galaxies (including the Magellanic Clouds), stellar streams, and the properties and kinematics of dwarf spheroidal galaxies. After his graduate studies he moved to a postdoctoral position in Canada. His second postdoc was at the University of Arizona, after which he moved into the astronomer track, and has remained in Arizona ever since. On average, he teaching two-and-a-half courses every four semesters, slightly less than the requirement of three courses in four semesters for tenure-line faculty. He has been teaching the introductory course for non-science majors since 1989. Prior to coming to the University of Arizona, William’s teaching experience
76 was being a teaching assistant in graduate school, where he taught small break-out sections of about 20 students of a large introductory class. Over the course of his graduate school career he worked with five to six different professors in these settings.
3.4.2 History and impact of the nats102 course All participants have been at Steward Observatory, in various capacities, between 18 (Jeff) and 39 (Hugh) years. As such, they have seen or taught the precursor to the current nats102 class and were present when the university overhauled the general education curriculum in the mid-1990s. In the case study of Linda in chapter 4 some of the history is sketched. Before the nats102 course existed, the astronomy department had a course called astro100, a three credit unit class. In addition, the department offered a one credit unit laboratory class called astro110a, which was more experimental, with more hands-on activities and in-depth discussion on the course materials (Linda, I, 435). When the university overhauled its general education structure, the laboratory class was dropped from the schedule of classes, and astro100 was renamed nats102. Several of the participants expressed reservations about this structure. Both Jeff and Linda mentioned that they regretted to see the laboratory course go. Linda mentioned that she was sad to see the four unit general education science classes go, but noted she was in the minority with that opinion (Linda, I, 447). Jeff noted on that the labs had to be “thrown out, because of the format we were forced into” (Jeff, I, 491). This can hardly be considered a neutral statement, but it is not surprising, as Jeff is of the opinion that students learn best
77 by engaging with real data and real equipment and can thus very well have seen the abolishing of the lab course as detrimental to the students’ learning. When the university overhauled its system, the goals for the general education classes were evaluated and discussed among the faculty. The current goals for the general education program are as follows The courses in the General Education program are designed to encourage students to develop a critical and inquiring attitude, an appreciation of complexity and ambiguity, a tolerance for and empathy with persons of different backgrounds or values and a deepened sense of self. (http://gened.arizona.edu/gened/general/nutshell.htm) Note that nowhere in this statement a reference to content knowledge is made. This observation will be discussed shortly. Introductory astronomy for non-science majors is a very popular course to fulfill the science requirements of the general education curriculum. In her first interview, Linda estimated that about 40 percent of all graduates of the UA take the introductory astronomy course (Linda, I, 448). This was seconded by Jeff, who in his first interview mentioned that 25 percent of the freshmen class takes nats102 (Jeff, I, 376). Corrected for drop-out rates between freshman and graduation (roughly 40 percent of the students drop out of college), these numbers could very well be similar. As nats102 is typically taken early in the academic career, it is not unreasonable to assume that the majority of students will have taken general education courses like nats102 before dropping out. Every semester Steward Observatory offers in the order of five full sections of nats102, each capped at 150 students. Making a rather
78 conservative estimate that 100 students out of each class complete the course, and not counting summer sessions, this means that about a 1,000 students each academic year take and complete (though not necessarily pass) introductory astronomy. Regardless of percentages, 1,000 students are still a considerable amount of people. Clearly, there is some truth to Linda’s comment in the first interview: One can have a pretty big influence on making a..making the undergraduates at this place scientifically literate by doing a good job at teaching this class. (Linda, I, 448)
3.5 Details about the different methods Now that a general overview of the time line of the dissertation and the methods is presented, as well as the positionality of the researcher, the profiles of the participants, and the history of the nats102 course, the individual methods are discussed in detail in the following sections. The same chronological order as was mentioned in Table 2 at the beginning of this chapter is used, leading to respective sections on the first interview, the lesson plan task, the concept map task, the Pathfinder network task, the stereotypical student statements, and the second interview. Once again, the stereotypical student statements are treated as a separate cognitive task, though they were, as mentioned before, an integral part of the second interview. To facilitate ease of reading, each section is set up similarly, containing subsections dealing with an introduction or background to the method and the purpose of the method in the dissertation. In order to
79 link the purposes of the method back to the research question, the reader is referred to Table 3 at the beginning of this chapter. Prior to the first interview, which is discussed below, participants were asked to supply a course syllabus. This document was primarily used to obtain the weighting scheme of the different assignments, and as such will be referenced as a source in chapter four, but the syllabus itself was not further analyzed in this study.
3.6 The first interview 3.6.1 Background and implementation Both the first and the second interview were semi-structured and followed the “interview guide approach” as mentioned by Patton (1990). This approach entails that topics and issues that are to be covered are specified in advance, in outline form, and the interviewer decides sequence and wording of questions in the course of the interview. The interview guide approach allowed for a conversational style of interviewing, while simultaneously specifying the topics in the interview in advance. A detailed consideration about choosing this method is given in section 3.13.4. The first interview was conducted about three to four weeks into the spring 2008 semester at a place convenient for the individual participants (usually his or her office) and at a time of their choosing. Each interview was audio taped and lasted between 65 and 90 minutes. The general protocol for the first interview can be found in Appendix B.I of the dissertation. The purpose of the first interview is discussed in detail in the next subsection.
80
3.6.2 Purpose As was mentioned in Table 2 at the beginning of this chapter, the first interview served several distinct goals. These goals were to create rapport with participants, obtain participants’ academic and teaching background, their teaching philosophy, their thoughts about the role of nats102, and general thoughts on teaching the HR diagram as part of the nats102 course. Below, the different goals of the first interview are expanded upon, in rough chronological order in which they were asked in the interview. Establish rapport with, and obtain an academic background of participants Even though I knew all the participants personally prior to this study, some knew me better than others, as I had worked with some of them in the past. Creating rapport with the participants right away was crucial in this study, based on the background of the interactions I have had with the department and the faculty. I was known in the department for being an educational specialist interested in understanding the teaching and learning of astronomy. It was important to be seen in this project as a researcher, rather than an educator or even professional developer. It was important that the participants would not get the idea that one of my objectives was to judge them as instructors, based on my own particular set of criteria. This was not the objective of this study, so one of the most important points in creating the rapport, and the subsequent buy-in to the study, was to ensure the participants that I would not be judging their effectiveness as an instructor in any way. One of the ways of creating the rapport (and to increase intrinsic motivation to answer the questions in the interview) is to create a sense
81 of relatedness (Deci & Ryan, 1985), in this case sharing a common background in research astronomy. I hoped that in creating this rapport I could approach my participants as a junior colleague, rather than an external researcher. A second way in which I hoped to generate rapport is to set myself up as the junior member in the conversation, not wielding any power, which should help lessen the threat the participants may have felt. I made clear that I was doing this study because I am interested in their views and experiences, rather than measuring them against my particular view of teacher effectiveness. By putting the participants in the role of an expert on teaching, I hoped to further defuse thoughts that I would act as a judge of teaching and to heighten participants’ sense of competence, which would increase the intrinsic motivation to engage in the tasks I set for them (Deci & Ryan, 1985). Another way to create rapport, to make the participants feel at ease in the interview, and to set me up as a fellow astronomer in the conversation, was to ask the participants about their research endeavors. Participants were asked to talk a little bit about themselves, their academic careers and goals. Talking about your professional life is typically non-threatening and a good means to establish rapport. A similar strategy was used by Luft and Roehrig (2007) in their work on the Teacher Beliefs Interview instrument. A secondary aim in this study was to obtain professional profiles for the participants, which are given in section 3.4.1. Elicit participants’ general teaching philosophy Questions about the participants’ research were used as a segue way to ask questions about their ideas about teaching and the nats102 course in general. Participants
82 were asked about the goals for the nats102 course, and what typical teaching in a participant’s course looks like. The aim of these questions was to create a profile of the nats102 course as taught by the participants, as the opinions and beliefs about teaching are likely to shape the practice of the participants (Gess-Newsome, Southerland, Johnston, & Woodbury, 2003), and the teaching of the HR diagram cannot be seen independently from the teaching of the course in general. Elicit thoughts on the role of nats102 Closely related to the previous point were the thoughts of the participants of the role of nats102. At the University of Arizona, undergraduate students have to obtain credit hours in general science, as part of the liberal arts component of the curriculum. Nats102 is officially registered by the university as fulfilling a lower division science requirement and as such is distinct from astronomy classes for science majors. Participants were asked about their views on the place of nats102 in the general education system, how they see their roles as instructors within this general education system, and to what extent these general science requirements influence their choice of content, curriculum and pedagogy. The aim of these questions was to paint the participant as the instructor of a particular class, serving a particular audience. Elicit thoughts on teaching the HR diagram in the nats102 course As remarked earlier, the HR diagram is but one concept in the nats102 class, and as such cannot be seen independently from the structure and (teaching) philosophy of the rest of the course. Participants were asked about the place of the HR diagram within the course sequence, its perceived importance, and general teaching approach to this concept.
83 The aim was to paint a general picture of the HR diagram within the nats102 course to help develop tailored questions for the participants in the second interview, and to help interpret the cognitive tasks that followed the first interview. The cognitive tasks are discussed in the next sections.
3.7 Cognitive task I: Lesson plan 3.7.1 Background and implementation The first (chronologically) cognitive task that participants were asked to do was the creation of a lesson plan for a 75 minute class on the HR diagram. Panasuk and Todd (2005) describe lesson planning as a “systematic development of instructional requirements, arrangement, conditions, and materials and activities, as well as testing and evaluation of teaching and learning” (p. 215). Rather than creating a lesson plan for their own class, they were asked to create a plan for a junior colleague, casting the participants in the role of a mentor. This fictitious colleague is said to have just started at the university without teaching experience at the nats102 level, so the colleague has neither teaching materials, nor a strategy on how to approach the lesson. The participants were not allowed in this case to simply give the junior colleague their presentation materials and have him or her figure it out. They had to generate a detailed lesson plan (in which presentation materials could be included). Participants were not observed during the generation of the lesson plan, but submitted their lesson plan to the researcher. The scenario for this task can be found in appendix B.III. Because instructors may not be
84 familiar with the phrase “lesson plan” in the educational sense a working definition was provided, as can be seen in the scenario.
3.7.2 Purpose Lesson plans are a commonly used tool in teacher preparation programs to help pre-service teachers in their instructional planning and task scaffolding and to help them focus on the educational objectives for, and the coherence of, a lesson or collection of lessons. John (2006) argues that lesson planning is part of the practice to become reflective about teaching. The lesson plan task served two purposes. The first purpose was to compare the instructional philosophies discussed in the first interview to the actual suggested enactment in the classroom. The second purpose was to generate questions tailored to the individual participants for the second interview.
3.8 Cognitive task II: Concept map 3.8.1 Background and implementation The lesson plan task was followed by a concept map task. Like the lesson plan task, it was done by the participants on their own, and then submitted to the researcher prior to the second interview. A concept map is a graphical way of organizing how someone thinks about a particular topic, and to display a complex set of data and interactions, as advocated, among others, by Novak (1990), Novak and Wandersee (1990), and Novak and Mosunda (1991). Concept maps were pioneered by Novak and
85 collaborators in the 1970 and have been used extensively in educational research (see e.g. Novak, 1998). Virtually all literature on concept maps has people create maps about their own understandings to either assess learning or to help organize thinking. Safayeni, Derbentseva, and Cañas (2005) note that concept maps in educational research are typically used for knowledge representation for instruction, learning tools, and evaluation. In this dissertation, concept maps were used in a slightly different manner. Rather than having participants map their own ideas, they were asked to map the knowledge of their students about the HR diagram, as they wished it to be at the end of instruction. What should a student in the class think about the HR diagram at the end of the semester? How should his or her knowledge be organized? The task can be found in appendix B.IV.
3.8.2 Purpose By using the concept maps in this non-standard way, it can be used as a proxy for educational goals and the desired outcomes of instruction. The purpose of this task was thus to determine to what extent the mapped student knowledge matches the goals for the HR diagram lesson and the teaching of the HR diagram as articulated in the first interview and the lesson plan task. A second purpose of the concept map task was, just like the second goal for the lesson plan task, to generate participant specific questions for the second interview.
86 3.9 Cognitive task III: Pathfinder network map ratings 3.9.1 Background and implementation The third cognitive task, and the last one before the second interview took place, was a paper-and-pencil rating task which was used to create a Pathfinder network map. Pathfinder is a commercial software package that can create graphical maps and statistics about the relationship between terms. Participants rate pairs of terms on a scale from 1 to 9, where 1 means that the terms are unrelated, and 9 means they are highly related. This means that for a task with n terms there will be
n(n − 1) individual ratings. Pathfinder 2
creates a map where each term graphically represents a node, and the distance between terms is weighted by the ratings given. In a comprehensive literature review, Buxner (2007) discussed both the mechanics of the program as well as its applications to educational research. One of these applications is the study of the cognitive structures in experts and novices. Those maps are markedly different, indicating that experts and novices conceptualize relationships between concepts differently (Schvaneveldt, Durso, & Dearholt, 1989). In a typical application of Pathfinder, an expert map is generated, and participants are compared to that map, to reveal to what extent they are expert like in their thinking. In educational situations, there is a correlation between the similarity of student map and expert map, and the performance of the students (Goldsmith, Johnson, & Acton, 1991; Gomez, 1996). Pathfinder is also often used to detect changes in cognitive structure in a pretest, posttest design, comparing participants to the expert map (Buxner, 2007).
87 In the first interview, participants were asked in general terms about the climate for teaching and resources for teaching. Based on data from these questions in the first interview, concepts relating to the available resources for teaching and the influence of those resources on the chosen pedagogy were chosen. Based on consultation with experts on Pathfinder, a final set of concepts was chosen based on their suitability for the Pathfinder software. In the Pathfinder task, concepts were given in pairs. Participants were asked to indicate, on a scale from one to nine, to what degree they thought the two concepts were related. A list of the concepts and the task itself can be found in Appendix B.V. The resulting maps were then compared to one another and to the researcher’s map. The latter map was solely created to provide a common frame of reference.
3.9.2 Purpose The Pathfinder network task was an experimental setup and it was not quite sure what the results would be. It was hoped that the resulting network maps would show differences that could be interpreted as evidence of priorities in structuring the class given the constraints on the available resources for the classroom, and allow the researcher to look at the course environment through the eyes of the participants. The task was also meant, just like the two previous tasks, to help generate participant specific questions for the second interview.
88 3.10 Cognitive task IV: Stereotypical student statements 3.10.1 Background and purpose The fourth and last cognitive task for the participants was responding to what were dubbed “stereotypical student statements”. This task was administered as a separate entity during the second interview. The statements were developed based on the first interview as well as common student misconceptions regarding the HR diagram and the physics behind it. The overall purpose of the stereotypical student statements was to have participants deal with pedagogical and curricular situations as they may arise in the nats102 course on the spot. By giving participants no time to reflect in preparing a response, it was hypothesized that it would be more likely to elicit deeply held beliefs about curriculum and pedagogy, as well as “default” examples and analogies used in teaching. A secondary aim was to determine the degree of coherence of what participants say how they view a classroom situation (when they have had time to think about it in the interview), and having to deal with one on the spot, and serve as a valuable triangulation tool for the other interview data.
3.10.2 Implementation During the second interview the statements were read to the participant, who would then formulate a response as if a student was saying this to them. In several instances, participants were asked for more clarification on a particular approach, because while it made sense to the researchers as an astronomer, it had to be insured that the
89 participants would explain their approaches in depth. The statements, with a brief description and reasoning, are discussed below.
Statement 1: A student asks how to study the HR diagram for the test. (sometimes phrased as: what do I need to remember of the HR diagram for the test?) This statement serves as a check on the stated lesson objectives provided in interview 1 and earlier in interview 2.
Statement 2: A student points to a HRD and asks you: so a star starts out in the lower right, then go to the upper left, then to the upper right and then to the bottom left (from M to O main sequence to giants to white dwarfs). What telescopes are used to observe the HR diagram and the motions of stellar evolution in the sky? This statement combines two common student misconceptions. The first is the idea that the HR diagram is not a graph, but a picture, and that evolutionary tracks on the diagram represent physical motion in the sky. The second misconception is that stars move along the main sequence during their lives, rather than being fixed in one position depending on its mass.
Statement 3: A student states: if a star is twice as massive, it should live twice as long, because it has twice the fuel. This statement combines two common student misconceptions. The first is a variant of Ohm’s p-prim, which states that if one quantity is large, the others have to be large as
90 well. In this case, the amount of hydrogen fuel and the lifetime of a star. The other, but related misconception is the assumption of linearity, that twice the amount of one quantity (fuel) yields twice the amount of the other quantity (lifetime).
Statement 4: A student asks: you called the stars at the top right giants, but how do we know that they are actually bigger than other stars? Size is a property of stars that is not directly apparent from the HR diagram, though it can be inferred from Stefan-Boltzmann’s law. Depending on the participant, it may have a more or less important place in the lesson. Main sequence O type stars are commonly called “big” (in relation to other main sequence stars), which can refer to both mass and size. Giants and supergiants by their very name sound large, hence student confusion about size can occur.
Statement 5: A student says: I don’t understand how temperature can tell you about brightness. This statement had the potential to go a variety of ways, depending on the participant. One option was the physics route, as “brightness” is not the same as “luminosity”, though in the vernacular “bright” and “luminous” are often used interchangeably. Brightness depends on the distance to the object, and luminosity can only be determined if the distance is known. Temperature and luminosity are related through the StefanBoltzmann law. Another option is to talk in more general terms about the concept of a graph, and how to interpret a graph. It was hoped that this stereotypical student statement
91 would trigger commonly used analogies, like the height-versus-weight and cooking pot analogies.
Statement 6: Would your students be able to answer this question? Why or why not? What do you expect a student’s response to be, and why?
Ranking instructions: Rank the surface area of the stars (A – D) from largest to smallest. Ranking Order: Largest 1 ____ 2 ____ 3 ____ 4 _____ Smallest Or, all the stars have the same surface area. _____ (indicate with a check mark) Carefully explain your reasoning for ranking this way: _____________________________________________________________________ _____________________________________________________________________ _____________________________________________________________________ _____________________________________________________________________ This statement was part of a ranking task exercise originally developed by Hudgins (Hudgins, 2005; Hudgins, Prather, Greyson, & Smits, 2006) as part of his Ph.D. dissertation. In this case, I was not so much interested in how the participant would explain the phenomenon (which builds on the physics explored in stereotypical student statement 4 and 5), as I was in having the participants explain what a student would
92 answer, and what a satisfactory answer in the explanation part of the question would look like. This could then be used as a triangulation with the stated course goals and the concept map.
3.11 Second interview 3.11.1 Background and implementation The final act of the data gathering phase of this dissertation was the second semistructured interview, which was conducted at the end of the spring 2008 semester. Data from the first interview and the first three cognitive tasks was examined prior to the interview and informed the question asked. The interview was designed to elicit more and deeper information on the participant’s instructional beliefs and pedagogical knowledge. Questions for the interview came from two categories. First there were follow-up questions on aspects that were not asked or not explored in sufficient depth in the first interview with the participant, or had come up as potential interesting points in interviews with other participants or while reading the transcripts. These questions varied from participant to participant though a common core of questions did exist. The second set of questions were related to the cognitive tasks and asked the participant to reflect and comment on those tasks. Based on the particulars of how the task was done by the individual participant, tailored follow-up questions about the tasks were asked as well. Like in the first interview, participants were interviewed at a time and place of their
93 choosing and lasted between 60 and 90 minutes. The protocol for the second interview can be found in Appendix B.II.
3.11.2 Purpose Like in the first interview, specific goals were set for the second interview. The details on the individual goals are listed and discussed below. Follow-up questions from the first interview The common core of the follow-up questions served to gauge the influence of past instructors on the participants, as well as a questions relating to differences in course goals and implementation between nats102 and astro250, which is the introductory astronomy course for science majors. Participants were asked where they think the most pressing problems lie with students learning the HR diagram in introductory astronomy. A common thread from the first interview, namely that students have difficulty reading graphs, was also explored. Walk-through the lesson plan Participants were asked to talk through the lesson plan they had created as part of the set of cognitive tasks, to explain what they wanted their junior colleague, for whom they wrote this plan, to do and why. The following questions were used to guide that discussion: What aspects of the HR diagram are taught, why are these aspects taught (what is the rationale for including them), which aspects are not taught and why are they left out, and how are the aspects taught and why are they taught in that manner? The aim
94 was to elicit pedagogical and curricular decision making and planning and the relation between the lesson and the overall course goals. Walk-through the concept map Participants were asked to talk through the concept map they created about how they would like students to think about the HR diagram at the end of the semester. The focus was primarily on the process of creating the concept map, what decisions were made and how the structure of the concept map related to the overall course goals. Reflection on Pathfinder maps The Pathfinder software created networks of all the participants, showing the relatedness between various concepts, but lacks the verbs connecting the concepts to make it into a true concept map. The original plan was to have create connecting verbs between the concepts in the network in order to create a concept map out of the network, aiming to uncover whether multiple participants would use the same connecting verbs between different concepts. This could have been used to both strengthen the validity of the maps as well as hint at an underlying cognitive structure. Unfortunately, the maps in general were very difficult to interpret and this approach had to be abandoned. In the interview, the maps were shown and talked about in general terms, but could not be used in the way that was originally envisioned. Reflection on stereotypical student statements As mentioned in section 3.10, the stereotypical student statement task was an integral part of the second interview. Participants were presented with the stereotypical
95 student statements discussed in section 3.10 and were asked to respond right away, in order to elicit pedagogical and curricular decision making on the spot.
3.12 Analysis methods Now that the reader has an overview of the details of the different data sources, and what the purpose of each of those was, the analysis of this aggregate of data can be discussed. The reader is referred back to Table 3 at the beginning of this chapter to see the overview of how the data sources help answer the research question. As mentioned earlier in this chapter, the aim was to look at the data holistically to identify trends in pedagogical and curricular thinking and approaches both within, and between the participants, using the two interviews and the cognitive tasks. The data were used to create descriptive case studies of each individual participant, describing his or her approach to, and goals of the nats102 class, followed by a description of how the participant teaches the HR diagram, and why the participants teaches it in that particular way. The individual case studies themselves were then compared and contrasted and themes were identified. In the following subsections, the analysis procedures to mold the data into case studies are discussed.
3.12.1 First and second interview The first and second interviews of the five participants were all transcribed verbatim. After transcription, the transcripts were subjected to two levels of coding to help answer the research question. The first level was descriptive coding, the second
96 level consisted of interpretive coding, for which the codes were derived from the descriptive codes. Each of these coding schemes, descriptive and interpretive, are discussed in turn. Descriptive coding The descriptive coding was done in the following manner. Rather than a groundup approach to descriptive data coding, in which codes are allowed to emerge from the data, general questions were asked of the transcripts to develop the descriptive codes. Transcripts were then highlighted for passages that gave (a partial) answer to the general question asked and coded. The first questions of the first interview were about the research background and their career paths. No codes were developed for these questions, as they did were not intended to be used to help answer the research question, but instead were used to help sketch the participant profiles that are in section 3.4.1. Descriptive codes were developed for two separate aspects of the interviews, codes for the nats102 course in general, and codes for the HR diagram. This distinction was applied because pedagogical and curricular thinking regarding the teaching of the HR diagram cannot be seen in vacuo, separate from the general course in which it is embedded. As such, questions were asked of the transcripts regarding structure, goals, and implementation of the course in general, as well as questions regarding structure, goals, and implementation of the teaching of the HR diagram. In the descriptive coding phase, the following questions were asked of the transcripts to help inform the interpretive codes and ultimately the research question. •
What goals for nats102 have participants decided on?
97 •
What course implementation have participants decided on for nats102?
•
On what grounds are the decisions for course goals and implementation made?
•
What implementation have participants decided on for teaching the HR diagram?
•
What are common student problems concerning the HR diagram?
It should be noted that in the first interview, the discussion about the HR diagram was in more general terms. It was not until the second interview, after the participants completed the first three cognitive tasks, that a more in-depth discussion could occur. In order to uncover themes in the general course structure, tallies of codes for the first two questions above were kept for all participants to determine which codes showed up for which participants. This served as a basis for interpretive coding later. With respect to the third question listed above, regarding the grounds on which decisions were made, decision codes were explicitly linked to codes concerning goals and implementation. This procedure served as a safeguard against missing reasons for goals and implementation. Not all codes could be matched with a reason in the first interview, but instead were addressed in the second interview. Table 4 below gives an example of such linked coding, where a GIMP decision code is linked to course goals (CG) and implementation (IMP) codes.
Decision Meaning code GIMPGet students INTEREST interested
Line 356
Linked to code CG-LIKE CG-DAILY IMP-CURRENT
Meaning Students learn to like science Students see the role of science in daily life Use current events in
Line 355 358 364
98
CG-BEYOND CG-BEYOND
class Engage students beyond the course Engage students beyond the course
371 375
Table 4: Example of linked codes regarding decisions for the general course
The second interview also confronted the last question on the list, both directly asking the participants about common problems students encounter in the HR diagram, as well as participants’ reaction to stereotypical student statements. These questions and statements were coded for the use of pedagogical strategies. Interpretive coding After descriptive coding had been completed, the codes that were developed using the general questions listed above were collapsed. In a process analogous to the loading of items on a factor, codes were grouped together if they matched a more general theme. For example, descriptive codes developed for general course goals like “students can relate to science”, “students learn to like science”, “students appreciate what scientists do”, were collapsed into a general interpretive code called “affective”, signifying that a participant or participants had a general course goal to generate general positive feelings about science in the students. It should be noted that the vast majority of the interpretive coding was done late in the case study development when themes were identified and lifted off the individual cases. This happened for two reasons. The first reason was that it was not until later in the analysis that instances that seemed incidental in a single participant morphed into trends across the data. The second reason was that it was not
99 until all the data had been looked at, both the interviews as well as the cognitive tasks, that I felt comfortable that I was not reading more in the data than there was actually there. I mentioned in my positionality (section 3.3.) that I am part of the culture of astronomy, and as such I could be liable to over-interpret the data because “I know what the participant means”. In section 3.13.3 I further elaborate on this concern, but it suffices to say here that I preferred to take a conservative approach to the data analysis, and stay as close to the raw data as long as possible, to avoid over-interpretation of data. I took a similar approach with the cognitive tasks that were situated chronologically in between the first and second interview. This will be discussed in more detail in the next subsection.
3.12.2 Cognitive Tasks The three cognitive tasks; the lesson plan, the concept map, and the Pathfinder rating task were handed out separately to the participants, who completed them in their own time and then returned them, either on paper or as an electronic file. The tasks were examined to help inform questions for the second interview, but no detailed analysis of the tasks was done before the second interview. Instead, the cognitive tasks were discussed in detail in the second interview, where participants were asked to talk about how they approached doing the tasks. This question was then followed up by the participant specific questions about the tasks that were developed from the initial examination. Most of the analysis of the cognitive tasks was done through the coding of the second interview.
100 Descriptive codes were developed for the lesson plan with regards to flow and sequencing of the lesson, the prerequisite knowledge and the build-up of concepts, and notions of potential student difficulties in the lesson. The concept map task was examined to determine what the participants wanted the students to know and be able to do at the end of the lesson(s) on the HR diagram, as well as to what extend the lesson plan from the first cognitive task was indicative of what the participants wanted the students to get out of the lesson. The concept map and the lesson plan were combined to examine flow of the lesson and learning goals. The Pathfinder network task was examined differently than the lesson plan and the concept map task. The participant data on relatedness between various concepts were entered into the Pathfinder software which generated a graphical network map, as well as descriptive statistics for each participant and a comparison between participants. The statistics included a measure of internal coherence in the map, as well as a measure of similarity between participants’ maps. I used my own network map statistics as a comparison for the data obtained by the participants, to help me interpret the data better, but no judgments were derived from this. The fourth cognitive task, which required the participants to respond to stereotypical student statements, was an integral part of the second interview. The stereotypical student statements were examined for the use of analogies, strategies, and pedagogy chosen by the participants to deal with the specific student statements.
101 3.12.3 Case study development and theme identification All the data, the interviews and the cognitive tasks, became ingredients for the creation of case studies. Descriptive case studies were developed for each participant individually based on the interview data and the cognitive tasks. Data that were included in the case studies broadly answered the questions that were asked of the data regarding both the structure of the course in general and the teaching of the HR diagram, which helped answer the research question (for the questions asked of the data see section 3.12.1). As much as possible, the participants’ own language was used or paraphrased in the writing of the case studies, to give each case the distinct voice of the individual participant. A small amount of interpretation and generalization was done in each individual case, though the individual cases remained primarily descriptive to avoid overinterpretation of data (see section 3.12.1 and 3.13.3 for more remarks on the risks of over-interpretation of data). The individual cases were then compared and contrasted to identify elements that the participants had in common, and elements where they differed, based on the questions asked of the data. As mentioned, the vast majority of the interpretive coding was done at this stage, because it was not until cases got compared to one another that trends became visible. After each case had been written a member check (Lincoln & Guba, 1985; Stake, 2006) was done, meaning that the participants got to read the case written about them and asked whether they felt they had been accurately represented and whether they had comments or suggestions. In part for this reason, in-text references to the individual data
102 sources were made throughout the case. The in-text references are discussed in more detail in the introduction of chapter 4, as it is more pertinent there. Participants were asked to explain why they felt a change was needed in the case. All comments and suggestions were considered in the light of the overall case and the research questions. If it was judged that the participant was indeed inaccurately represented in the case, corrections could be made, as long as it did not obfuscate elements of their beliefs, teaching strategies, and decision making processes. While it was certainly the intention that participants would have a voice, they did not hold the power of veto over what could, and what could not be written in the case. In chapter 4, the individual cases are presented, whereas in chapter 5 the themes emerging from the cases are discussed.
3.13 Considerations and deliberations concerning the methods Before the results are discussed in the next chapter, it is instructive to examine the considerations and deliberations that underpinned the methods chosen in this chapter. This section is set apart from the main body of this chapter, as it is not fundamental for the flow of the argument, and the reader can skip these sections and go directly to chapters 4 and 5 without loss of flow. However, the section is relevant in order to understand why the methods were chosen in the way that they were for this dissertation. The following subsections provide the background and rationale of the methodology and methods. They discuss qualitative methodology, provide a background on the chosen method for the interviews, and discuss the need for triangulation of the data sources.
103 3.13.1 Qualitative research The reason for using a qualitative methods approach was based on two considerations. First, the study was exploratory in nature. There was no clear cut à priori conceptual framework for the interpretation of the data, which argued for a multi-stage, iterative process in collecting data, refining questions for subsequent rounds of data collection, and analyzing data using a variety of techniques. Because there is no à priori model, a phenomenographic approach, which has been used in several studies concerning university instructors’ beliefs, understandings, and approaches to teaching (Prosser, Martin, Trigwell, Ramsden, & Lueckenhausen, 2005; Prosser et al., 1994; Trigwell, Prosser, Martin, & Ramsden, 2005; Trigwell, Prosser, & Taylor, 1994) could not be used. In addition, in this study no intervention was done, and was more descriptive in nature. Hence, there was no need to conform to standardized measuring procedures in order to determine the effectiveness of an intervention. These two arguments, the study being exploratory and it being a non-intervention description, were augmented by a third consideration. This consideration was the need to create rapport with the participants, and the need to not have, or even hint at, an approach that would judge the participants as instructors. Anything that would sound or act like a criterion-referenced approach was to be avoided as that would have severely reduced buy-in to the study and subsequent rapport. The need for creating rapport with the participants was argued in earlier in this chapter, and one of the considerations was that the researcher, being an educational specialist, could not, and should not, bring his views on education into the conversation, as to avoid giving the impression of participants being judged on their teaching skills. If
104 instructors were to get the feeling that the motivation for the study is to judge their teaching or effectiveness as an instructor, they would most likely to be less willing to become participants or be less open about their pedagogical beliefs. It was made explicit, both at the recruiting stage of the study as well as prior to the first interview, that this study was aimed as a study of craft knowledge, and not meant as a way to judge a participant’s teaching style or course effectiveness. All these considerations argued for qualitative methodology, because of the opportunity to generate rich data (Gilham, 2000a) needed for the descriptive narrative in the case studies. This study dealt with individual perceptions, opinions, and decision strategies of individual faculty members. However, individual case studies were only one aspect of this study. Data collection for one participant was sometimes influenced by results obtained from another participant. For example, data obtained from several participants in the first interview served as the basis for the stereotypical student statements for all participants in the second interview. As such, there was a certain level of blending during the data gathering of the individual cases. Another part of this study was an aggregate analysis, where data obtained from the participants were combined and the different ways participants operate were compared, contrasted, and overarching themes were identified. The concept of a case study is discussed in the next subsection.
3.13.2 Case studies Several authors of qualitative research books have offered definitions or properties of case studies. A “case” is characterized by Gilham (2000a) as a “unit of
105 human activity in the real world, which can only be studied or understood in context, which exists in the here and now, that merges in with its context so that precise boundaries are difficult to draw” (p. 1). The real-life aspect and the diffusion between phenomenon and context are elements that are also pointed out by Yin (2003). In this dissertation, the (format of the) nats102 course and the personal beliefs of the participants formed and shaped the context of the phenomenon under study; the pedagogical and curricular thinking regarding the teaching of the HR diagram. As the HR diagram is embedded in the course, especially with regards to goals and implementation, it cannot be studied separately from the context. This made a case study approach the preferred course of action. Comparing and contrasting multiple individual cases allows for themes, connections, relationships and interpretations that are not necessarily obvious in any single case, to come to the fore. Given that the study design already allowed for some “blending”, as discussed above, doing this type of analysis was a natural follow-up to the individual case studies. It allowed for a deeper exploration of goals and implementation procedures, given the context of the nats102 course. In addition, all participants are colleagues and speak to each other regularly. It could not be assumed à priori that the participants would never talk about teaching to one another, assuming that they would be isolated instructors. By cross-analyzing the data from the various cases (especially from the first interview) emerging common themes could be followed-up on, in order to determine its source (something a participant came up with on his or her own, heard from a colleague, part of the “culture of astronomy”, etc.). This analysis also safeguarded
106 against potential mis- or over-interpretation of the data of an individual participant. The discussion about the risk of over-interpretation of data, the main threat to the validity of the study, and how the risk was minimized in this study is the topic of the next subsection.
3.13.3 Minimizing the potential risk of over-interpretation of data Because I am a former astronomer, care had to be taken in all the settings in which I was directly interacting with the participants. The participants and I share the same culture of astronomy, with its peculiarities, jargon, ways of working, and thoughts and beliefs about data and evidence. This shared culture between the participants and me could potentially lead to a risk of over-interpreting the data. I had to take precautions to not infer meaning “because I know what they are talking about”, but at every stage be very careful as what the data objectively were saying. The premier way to mitigate this risk was by using multiple sources of data (interview, cognitive tasks). These data sources themselves were quite varied in nature, which allowed for triangulation of data. Using multiple and varied data sources had the additional benefit of giving the participants to express themselves in multiple ways. As participants may lack the vocabulary necessary to adequately express their opinions and ideas about educational matters, given that they did not have formal training in education, using a wide variety of methods (besides interviews) helped to lessen the risk of miscommunication and misunderstanding between the participants and the researcher. Using multiple methods notwithstanding, the primary data source of this dissertation
107 remained the two semi-structured interviews. The background of the interview approach is discussed in the next subsection.
3.13.4 Interview approach Both sets of interviews in this study followed the “interview guide approach” as mentioned by Patton (1990). This approach allowed for a conversational style of interviewing, while simultaneously specifying the topics in the interview in advance. In Table 5 below, the interview guide approach is described.
Characteristics Topics and issues to be covered are specified in advance, in outline form; interviewer decides sequence and wording of questions in the course of the interview.
Strengths The outline increases the comprehensiveness of the data and makes data collection somewhat systematic for each respondent. Logical gaps in data can be anticipated and closed. Interviews remain fairly conversational and situational.
Weaknesses Important and salient topics may be inadvertently omitted. Interviewer flexibility in sequencing and wording questions can result in substantially different responses from different perspectives, thus reducing the comparability of responses.
Table 5: Properties of the interview guide approach, from Patton (1990), p. 288
Patton contrasts this method with the “informal conversational interview”, in which questions emerge from the context of the interview and the “standardized openended interview”, in which both the topics and the exact wording of questions is determined à priori. In this dissertation, there was a clear agenda for the interviews, which discounted the informal conversational interview approach. It also did not need to
108 be fully scripted, as different participants had different backgrounds, experiences, and views, which could lead to potentially interesting events happening during the interview. As this needed to be taken into account, the standardized open-ended interview approach was discounted as well. However, care was taken in the set-up of the interview protocol to ensure that the same amount / level of information was obtained from each participant, as it is potentially difficult to determine how findings are influenced by qualitative differences in interviews. In order to obtain the best possible qualitative data, the art of framing interview questions became extremely important (see e.g. Glesne, 2006; Patton, 1990). To be effective as data gathering tools, questions should be unambiguous, clear, open-ended, neutral, and address one topic only. The clarity of questions was aided by the fact that I am a former astronomer, and questions and answers could thus be in “astronomer language”, rather than “education language”. For each interview round, questions were crafted in an iterative manner. I crafted the original set questions and the dissertation committee, as well as colleagues, provided feedback, after which questions were revised. The sequence of the questions was set up in such a way as to create rapport with the participants and make them feel comfortable before asking more sensitive questions. The first interview was pilot tested on a science education colleague who is also an astronomy instructor at another institution. This was done to determine the interview length, the phrasing and the sequencing of the questions, as suggested by Gilham (2000b). The second interview was not pilot tested, as I had, based on the experiences in the first interview, a good indication of the total time needed, the phrasing and sequencing of the interview. Also, the questions varied from participant to
109 participant, and were in part based on reflections on earlier tasks, which the pilot interviewee had not done, making pilot testing not useful. Given the time-intensive nature of transcribing interview data questions were asked by the dissertation committee in the earlier stages about the number of participants in the study. The reason for choosing the number of participants in this study is outlined below.
3.13.5 Why so many participants? As was mentioned in chapter 1 of this dissertation, faculty and staff at the astronomy department take turns in teaching the nats102 course. Approximately eight of about 30 faculty and staff with teaching responsibilities teach this course frequently. Of these about eight faculty members, several people were unavailable to become participants, as they either were not on campus in the spring 2008 semester, or had not recently (in the last two years) taught the course. Six faculty members consented to become participants, of whom one had to withdraw after the first interview because of pressing time commitments. The reason all these faculty members were contacted was twofold. First, there were no real reasons to include or exclude certain participants: all potential participants were equally qualified to be part of the study, and I could not justify choosing one or the other. Second, a larger pool of participants is more likely to generate more and more interesting lines for future research.
110 CHAPTER 4: FINDINGS FROM THE INDIVIDUAL CASE STUDIES 4.1 Introduction In this chapter, the case studies of the individual participants are presented, and in chapter 5 the themes emerging from the cases will be discussed. As was mentioned in chapter 3, all the data sources from this study, the interviews and the cognitive tasks, were used to create a descriptive case for each participant. A case details the participant’s nats102 course and the pedagogical and curricular thinking that surround both the course in general and the teaching of the HR diagram in particular. Each individual case study spans three separate sections; the nats102 course in general, the HR diagram, and concluding remarks. This structure was chosen because the pedagogical and curricular thinking regarding the HR diagram cannot be seen independently from the pedagogical and curricular thinking regarding the course in general, as the topic is embedded in the overall structure and goals of the course. As such, painting the general picture of the nats102 course first provides the necessary context to interpret the findings for the HR diagram. The lay-out of a case is as follows. The first general section contains subsections on general course mechanics, course goals, the students in the class, the contrast of teaching nats102 and astro250 (the introductory course for majors), and a subsection on how the participant would like to teach nats102 if resources were not a concern. In addition, subsections unique to the individual participant are included. The second section on the HR diagram contains subsections on the goals for and approach to teaching the HR diagram, the lesson plan task, the concept map and
111 Pathfinder task, and a subsection on common student problems and participants’ responses to stereotypical student statements. The two major sections are followed by an analysis and concluding remarks section concerning the individual participant. The data for the section discussing general course structure come from the first interview and the first part of the second interview. Data for the section on the HR diagram come from the latter part of the first interview, the four cognitive tasks discussed in chapter 3, and the second interview. After the five individual cases a short summary section of the entire chapter is presented.
The reader will note that in the descriptions in the case studies, many references are made in parentheses, both when direct quotations from the transcripts are made, and when a participant is paraphrased in the text. A legend for these references can be found in Table 6 below, which refers to locations in the raw data (transcripts or tasks). In this chapter, I have opted to use more direct referenced quotations in the transcripts and other raw data. This method of reporting is also used, albeit to a lesser degree, by Southerland et al. (2003) in a qualitative study on manifestations on teacher beliefs in the classroom with three scientists who designed and implemented an integrated science course for nonscience majors. The inclusion and use of this many references were done on purpose, though it deviates slightly from the norm in qualitative research, where more emphasis is placed on an integrated narrative. I chose to adopt the strategy of citing in the text for several reasons. First, by staying close to the words the participants actually used, a trail of evidence is established,
112 allowing the reader to follow the reasoning laid out and ensuring that all results and claims can be backed up with data. It is my firm conviction that in research, one has to stay as close to the data as possible, especially in qualitative research, where words can be interpreted differently by different people. The second reason is that I wanted to convey the participants’ voice. The reader will note that each case study has a slightly different use of language and tone, preserving the participants’ voices. The participants themselves describe their ideas, goals, implementations, and strategies in their own words (Carter, 1993), the words of a professional astronomer talking about teaching, learning, and education. I wanted to preserve this form rather than impose the words and jargon of the science education researcher on the data. The third and last reason is more pragmatic in nature. Using the participants’ own words with references in the text facilitated member checking (Lincoln & Guba, 1985; Stake, 2006), as the participants could see more easily where the data were coming from. Reference I, number II, number LP, number Syl, number
Meaning Line number of the start of the quote in the first interview Line number of the start of the quote in the second interview Page number or section in the lesson plan Page number or section in the syllabus
Table 6: Legend for the data sources cited in the case studies 4.2 The case of Hugh As discussed in chapter 3, Hugh is a full professor in the department where he works with infrared data obtained from a space mission. He has been teaching nats102 or similar courses similar about 20 times over the course of his career, though he readily admits that he has lost count. Currently, he team teaches two sections of nats102 each
113 year with his wife, Linda, who is also a full professor in the department. The case of Linda is presented later in this chapter, in sections 4.8 through 4.10. In the interviews, Hugh displayed a dry sense of humor in answering questions and initially gave rather short responses, though he would elaborate readily when given a follow-up question. Hugh’s case study follows the general outline of the case studies as mentioned in the introduction of this chapter. One subsection was added which was unique to Hugh, and dealt with student insecurity.
4.2.1 General course mechanics for nats102 As mentioned in the introduction to this case, Hugh and his wife Linda are team teaching two sections of nats102 together. Because both Linda and Hugh have complicated travel schedules due to their other professional commitments, team teaching helps mitigate scheduling conflicts with teaching (I, 1051), as the can easily substitute for each other, and also ensures that the students are used to having two instructors, rather than one instructor and a semi-regular substitute instructor. This means that they both use the same curriculum and the same assignments. In his response to the interview question what his teaching style was in the 150 person nats102 class, Hugh responded “probably not very good” (I, 288). He said this because in a large class like this, there is not enough time to do things the way he would want them to be done, especially in dealing one-on-one with students (I, 234). Hugh spends a fair amount of time lecturing, which he says “is probably not the best thing to do” (I, 311), though he supplements the lecture with in-class activities, demonstrations and animations. A typical day in Hugh’s
114 classroom would consist of him lecturing, which he mentions he does for about three quarters of the time. Hugh makes an effort to do something besides lecture in virtually every class. This can be a demonstration, or an in-class exercise (I, 709), an adaptation from the Lecture-Tutorials for Introductory Astronomy (Prather, Slater, Adams, & Brissenden, 2008). Besides the in-class exercises, which are used for attendance, Hugh uses a variety of assessment techniques. There are four multiple-choice exams in the course, three midterms and a final. The midterms are worth 100 points each, the final 200. In addition, there is an information literacy project, worth 100 points, for which the students also have to do two preparatory homework assignments, worth 25 points each. Three laboratory assignments, on spectroscopy, output of the Sun, and radiation, are worth a combined 100 points. This brings the total number of points to 750. However, there is a little catch, namely the in-class assignments Hugh uses. There is no set number of inclass assignments, but they are worth 15 points each. The total number of points obtained at the end of the semester (thus including a variable number of in-class assignments) is thus a bit variable. Although if students obtain a certain number of participation points (say six out of eight) they get full credit, this is not generally announced to the class. Hugh mentions this individually to students when they worry about their grade, though in his experience, students seldom check their grades, do not know if and when they are failing the course, and generally assume they are doing better in the class than they are (email communication with Hugh after member check, 3/22/09).
115 Hugh uses a strict cut-off percentage to determine letter grades, meaning that the students are not in competition with each other as they would in the case of a curved grade. One thing that is not so standard in Hugh’s classroom is that he does not use a textbook in the course. In lieu of a textbook, he and Linda use a cd-rom that is handed out to all students (I, 225). The cd-rom is projected on the screen during class (I, 812) and has the entire course, including animations, video clips, background material, practice exams, and the like on it. Hugh developed the cd-rom primarily because a standard textbook, with its 500 to 600 pages of prose, can be very imposing on students who do not necessarily like science (I, 227) and to be able to integrate more and diverse resources than a standard text to connect astronomy to daily life, the arts and literature (I, 199, 636, 1084, 1091). Hugh has moved the course away from purely astronomy and now includes topics in biology, physics, and history as well, to make his nats102 class a real general education science course (I, 648; II, 148). Why Hugh has done this is discussed in the next subsection, where his goals for the course are discussed in more detail.
4.2.2 General course goals for nats102 The focus on astronomy in daily life and including more general science than just astronomy shows through in Hugh’s course goals. In nats102, Hugh has one single goal for the class. “The most important goal of this course is for the students to learn to like science” (I, 192). From this single goal, several others follow, one of which is for students to be willing to engage with science, to the extent that when there is science on
116 National Public Radio or television, students will not turn it off (I, 656). Another related goal is that students learn how scientists think and how theories develop (I, 599). Hugh’s course goals have changed over the years, and he indicates that he is now much more conscious about the goals that are outside of the content of the course (I, 384), focusing more on process, attitude and affect than on content goals (I, 743). His reason for now only having one goal (get students to like science) is that he “got beat down over the years” (I, 609) and wanted to simplify his goals and to focus (I, 614). As it is most likely the last science course the students will take (I, 652), Hugh wants to convey an attitude about science and an insight into how science is done. The details of the content are less relevant in that case. Rather, the content is used as a vehicle: [It] Doesn’t really matter if they..they never remember Newton’s third law. But if they know that Newton had laws and that they formulated eh certain things in a very general way, then you’ve won. (I, 396) As a result of his goal to get students to like science, Hugh does not aim his course to any particular audience (I, 192), as he does not want students to feel left out (I, 193). Hugh tries to link the content to the daily lives of the students by showing them that science is everywhere (I, 199), from movies to music to art. Typically Hugh shows the daily picture from the popular website Astronomy Picture of the Day (http://apod.nasa.gov/apod) at the start of class. If astronomy appears in the news, Hugh usually brings that in to class (I, 366). On the cd-rom, many examples are given to illustrate the link between science and daily life, though the focus of the cd-rom is on how our knowledge of the universe developed and where the information was obtained.
117 The central message of the cd-rom (and thus the curriculum) Hugh is using is to “deal with the question of how it came to be that there were beings on Earth who were intelligent enough to ask how they came to be” (II, 157). When the content broaches on an area Hugh has worked in, he will talk about his own work with the students. He does this to make the content more personal; he wants to make the students aware that the professors at the university are actively involved in the material an introductory astronomy book talks about (I, 39). He notes though, that due to the large variability in the classroom, it is hard to predict how this strategy will actually work (I, 51). The variability in the class, both in aptitude and attitude of students, is explored in more detail in the next subsection.
4.2.3 Students in the course and classroom environment Talking about the students, Hugh indicates that the audience is very broad (I, 175) so it is difficult for him to imagine a prototypical student to which instruction can be addressed (I, 181). Furthermore, Hugh mentions that a lot of students come into the course with preconceptions about science (I, 203), specifically a belief that they cannot do mathematics (I, 208), which in fact is not really used in the course. In one-on-one or small classroom settings, Hugh feels that he can help mitigate those preconceptions, but in a large, 150 person classroom, this becomes much more difficult (I, 220, 234). The class size not only prevents Hugh from more personalized teaching to help students mitigate their preconceptions, but also creates disciplinary problems. According to Hugh, the front half of the class is usually fine, but it is in the back where the disciplinary
118 problems and disruptive behavior occur (I, 331). He notes that the students in the front half of the classroom may have some interest in astronomy, but that a fair number of students just want to get a C and pass the class, without taking the opportunities offered to improve the grade (II, 102, 109). Hugh thinks that if classes were smaller, this problem would be lessened as he would know student names (I, 254), and the reduced class size would have the added benefit of being able to get more students involved in a class discussion (I, 260). How he would teach nats102 differently if he were to have no constraints is discussed in the next subsection. However, in real life other demands on Hugh’s time are very much present. Hugh would like to introduce new pedagogy in the classroom. He has already written a new text, in the form of the cd-rom he is using in class (I, 225) and he is using an information literacy project in class, in collaboration with the science library, to help students learn how to obtain and evaluate information for a short paper (I, 798). Hugh mentions that he is open to try new approaches to teaching, especially breakout sessions, the use of preceptors, and non-machine graded assignments (I, 301). However, in a class of 150 students, the latter would be very time consuming to grade and Hugh has numerous other commitments as well, which turns out to be the bottleneck. About introducing new elements into his classroom he states: I keep trying to introduce new ideas, but [pause] although I said teaching was my top time priority, it’s not my top career priority. And so I have a lot of demands for research and service and so on, that mean that I..I have to be a little careful that I don’t structure the teaching so that it rises up and takes all of my time. (I, 292)
119 But if he were to have unlimited resources, Hugh would change a few things in the nats102 course. These changes are discussed in the following subsection.
4.2.4 Teaching nats102 in the ideal world In Hugh ideal world, where resources are not a concern, he would like to make the nats102 classes smaller (I, 991). One of the reasons for this is that Hugh would have the opportunity to know all his students by name (I, 254). In Hugh’s view, knowing students’ names is a powerful pedagogical tool and would help to reduce the amount of disruptive behavior. Having smaller classes would also provide the opportunity to engage more students in class. Hugh noted: …you can only put four or five questions in a lecture with a 150 students, so what percentage of the class gets involved that way is tiny. [pause] A class of 25, ehh, you know, eh your five questions each class that’s twenty percent of the class, so that by the time you’re..move around a large percentage of the class would have been involved by, you know, dialogue with asking questions or you asking them questions. (I, 259)
In Hugh’s experience, during demonstrations students are quite attentive (I, 1002). Besides having smaller classes in his ideal world, he advocates for a more and well maintained lecture set of demonstrations, though not necessarily expensive or elaborate ones, for general use in the department. The reason for this is that he thinks that students,
120 when seeing an experiment in class, better realize that what is being talked about is something real, and not a computer-generated cartoon (I, 999). Cartoons and other forms of special effects in movies take considerable liberty with the laws of physics, and Hugh wants to show the students real experiments. To illustrate the point, he embedded a section on the “cartoon laws of physics” in the cd-rom (I, 1033), which illustrate how the physics in cartoons is different from the physics in the real world. All the elements Hugh brought up are meant to improve the learning environment for the students. One element of the learning environment is more difficult to ameliorate, even in a smaller class is the fact that a lot of students are afraid of science and think that they will not do well in the course. In his interview, Hugh gave several examples of students being afraid, but he also put it in a broader context. This broader context of student anxiety is discussed in the next subsection.
4.2.5 Student insecurity Hugh mentioned that a fair number of students come in with the idea that they cannot do science (I, 203). When students come to Hugh to mention that they are not good in science or math, and as a result will not do well in the class, Hugh would say to the student that he does not accept that notion, because “everybody can be good enough in science in this course” (I, 215). When students come with problems like these and are lost in the course, Hugh mentioned that he “vectors” the students back to the classroom materials, and would tell the students that the cd-rom contains practice exams that they can use to see if they have understood the material (I, 484). Hugh notes that the anxiety
121 is partly due to the students being insecure academically and not yet having good study skills or being able to discriminate the important points from the less important points. Students focus primarily on memorization as a study strategy, which is not an effective method at the university level. However, Hugh also notes that the insecurity is partly social. Most most of the students in the course are freshmen that have just taken a big step into the world by going to college (I, 511), which can create a lot of uncertainty as a result of being in a new (social) environment. In addition, Hugh mentions that in his experience women have more anxiety than men in his class. Asked why this could be the case, Hugh made the sober observation: “Oh, I think we damage young women [pause] quite a bit, ehm, as they’re growing up” (I, 527). He notes that there are a lot of subtle things society communicates regarding women and math and science, giving an example about who gets called out in class in grade school to answer a mathematics question (which tend to be the boys), which results in a shift in the comfort level of doing math and science (I, 531). The concept Hugh is referring to here is known in the psychology literature as stereotype threat, where the societal stereotype that “women can’t do science and math” poses a threat to the self-efficacy. Hugh notes that the issue of self-confidence is not limited to the nats102 course, but even extends to women in graduate school. I’ve yet to find a female graduate student who didn’t have a problem with selfconfidence. [pause] And, so, you know, it isn’t just in this class and if you just center on self-confidence as the issue, then female graduate students do wonderfully. If you ignore it, then, you know, there are usually problems. (I, 541)
122 Hugh indirectly addresses the issue of the stereotype of women and science when talking about the HR diagram, and the large contributions women made in advancing understanding about both the diagram and stellar astrophysics in general. Before the HR diagram is address in this case study though, a brief excursion is made to the astro250 course, the introductory astronomy class for science majors.
4.2.6 The difference between teaching nats102 and astro250 In nats102, Hugh spends considerable time on the concept of a graph, as this is one of the major stumbling blocks for students, which will be discussed in detail shortly. The emphasis in nats102 on the concept of a graph is not something Hugh would do in the introductory astronomy class for majors (astro250), which he describes as “the slightly mathematical version” of nats102 (I, 252). In astro250, Hugh would assume a higher level of preparedness and ability in mathematics. Based on this assumption, he would use more equations to get the point across (for example the Stefan-Boltzmann law, see appendix C). With regards to teaching the HR diagram in the astro250 course, Hugh mentioned that the basic information would be similar, but that he would teach it at a higher level (I, 262). Though he did not specify exactly what he meant by “higher level”, one could argue (especially in the light of the other case studies) that “higher level” means more emphasis on the physics and mathematics behind the HR diagram.
123 4.3 Hugh’s approach to teaching the HR diagram 4.3.1 Goals for and approach to teaching the HR diagram In his own nats102 course, Hugh does not teach the HR diagram as a separate topic per se. Instead, he teaches elements of the diagram during his lectures on stellar properties and stellar evolution. In teaching the HR diagram, Hugh routinely encounters the problem that students do not understand what a graph is. As a result, many of them think that the HR diagram is a picture of a constellation (I, 755) and that if you were to point a telescope at a certain place in the sky, you would see the stars lined up diagonally, with the red giants up above (I, 696). Hugh found out about students not understanding what a graph was over the years when he was talking about the HR diagram. In more than one semester a student would ask him about the HR constellation in the sky (I, 755). Figuring that for every student who asks a question, there are “at least an order of magnitude more students who would ask the same questions but are too shy to come down” (I, 758), he realized that the concept of a graph needed more attention. Therefore, one of Hugh’s prime goals in teaching the HR diagram is to illustrate that the diagram is a graph, and not a picture and explain what a graph is and how it is used. Hugh mentions that if he did not spend a large amount of time helping the students to understand what a graph is, most of the discussion that follows would be meaningless to them, and most would tune out as a result (II, 308; 316). Hugh tries to counter this particular student difficulty using the material on the cd-rom, in which he shows the same HR diagram multiple times when he is talking about the different aspects (II, 708), for example main sequence, red giants, and white dwarfs.
124 By making the graphic active (with the parts he is currently talking about flashing) he conveys that the HR diagram is not a picture, but a graph. Hugh wants students to know what a graph is and how it is used to organize thoughts (I, 743). Hugh, however, does not necessarily require the students to understand the diagram per se. He pointedly stated: “I don’t care if they understand the HR diagram” (I, 768). He views the HR diagram as a tool to show and discuss stellar evolution, which is the part that Hugh does want his students to understand (I, 773). He sees the HR diagram as a means to an end, not an end in and of itself. Hugh remarked: I want them to understand that stars go through a period of contraction, from a molecular cloud, that they then start fusion in their cores and they have a long period of stability [pause] due to hydrostatic equilibrium and I..that sounds very technical but I want them to kind of understand what that means and why the stars are stable, and when they have exhausted the hydrogen in their cores then they change form. [pause] I never mention the HR diagram. The HR diagram is simply a graph you use to try to illustrate that, but I..I don’t think they need to understand it at all. (I, 773) With respect to Hugh’s overall course goals, namely that students will learn to like science, the HR diagram as an isolated topic is a bit too abstract in Hugh’s opinion, which is why he brings in the topic incrementally (II, 519), in small pieces, rather than all at once in a single lesson. He starts with the more human interest story of the HR diagram, and puts the diagram in its historical context. He emphasizes the big role of women in making large contributions in this field. A personal touch in the story is that his own
125 mother was part of some of these contributions, which gives the development of the HR diagram and the stellar astrophysics that came from it a personal human interest side (II, 276, 537). The history of the HR diagram also includes the need in the beginning to use star clusters. This was needed because at the time the distances to stars were not known very well, and thus serves as an example of how science is done; doing the best one can with limited information. In a star cluster one can assume that all stars are roughly at the same distance, meaning that differences in brightness of stars are due to actual brightness differences, and not a distance effect (II, 370). The trick of using star clusters circumvented the distance problem, allowing for the HR diagram to be interpreted and used as a tool to understand stellar evolution. This idea of using the HR diagram as a tool for stellar evolution, as a means to an end, rather than an end in and of itself, features in Hugh’s lesson plan task as well. The lesson plan cognitive task is discussed in the next subsection in more detail.
4.3.2 Cognitive task I: Lesson plan Even though Hugh does not teach the HR diagram as a single lesson himself, he wrote an extensive lesson plan for his fictitious colleague featured in the description of the cognitive task. The lesson plan is given verbatim below, including little notes to the colleague in parentheses. What are the main points in this lesson? 1.1 Wide variety of properties of stars 1.2 What a graph is (do not underestimate how many students have this wrong)
126 1.3 1.4 1.5 1.6
Using a graph to organize results and identify trends Applying this to the variety of stars Properties of stars as they are sorted on the HR diagram (large, hot, small, etc.) What is actually happening with the different types of star and what the HR diagram shows us
2. Wide variety of properties of stars 2.1 Use pictures of relative sizes, red supergiant vs. the sun, sun vs. white dwarf 2.2 Discuss the range of temperatures involved (3000 - > 100,000K) 3. What is a graph? 3.1 Use example of something vs. time because that is the easiest for them to understand 3.2 Generalize to two other quantities; I might want to try height vs. weight of class members, since it should also show a trend. 3.3 What do we learn from height vs. weight? 3.3.1 Height and weight are not related 1:1 – probably more like weight goes as height cubed (try to get them to volunteer this relation) 3.3.2 There is a certain minimum weight associated with any height – people cannot be unreasonably thin 3.3.3 There is a broad distribution encompassing most people – could infer this is for normal healthy people 3.3.4 There are limited ranges of height and weight that apply to adults, with perhaps a few outliers for overweight people and for basketball players – indicate where they would lie 4. Apply this to stars 4.1 Try just a list of stars, plot brightness vs. color, explain how color and temperature are related 4.2 What is wrong? Color is intrinsic to the stars (ignoring reddening) but brightness involves both luminosity and distance, so is not an intrinsic quantity 4.3 Show graph for a cluster – a historic example is at http://www.leosondra.cz/en/first-hr-diagram/ Discuss why it helps to use a cluster 5. Modern diagram but without stars yet 5.1 What are the properties of stars in different regions? (Use the in class exercise we have adopted from Ed Prather, have them do it – say 10 minutes – then quiz them on questions 4, 5, and 6 to see if they got it) 5.2 Take the stars introduced for variety at the beginning and put them on the diagram – with their help 6. Show a fully populated HR diagram 6.1 Explain that gravity naturally pulls objects down (smaller and smaller) 6.2 What is the band across the center? Hydrogen fusion produces pressure to counter gravity, have a specific set of interior conditions for all stars burning hydrogen at their cores. This is reflected in a specific relationship between temperature and luminosity. 6.3 Need to expand on how this happens. Russell-Vogt Theorem, properties of a star determined completely by its mass, age, and composition – massive stars create more pressure at their cores, therefore burn hydrogen more quickly and make more energy – they have high luminosity. Low mass stars have lower pressure, lower hydrogen burning rate, lower luminosity. R-V Theorem tells us why all the stars behave so similarly. 6.4 Why is there an upper limit (photon pressure disrupts stars more massive than about 100 M_Sun) 6.5 Why a lower limit (not enough pressure for hydrogen burning) – what happens to a low mass object on the HR diagram – gravity wins, it shrinks off the lower right corner. 6.6 Red giant and supergiant realm, have burned up hydrogen in the core, adjustments in stellar structure, high luminosity from hydrogen shell burning 6.7 White dwarf regime, have ejected outer layers of star, see its collapsed very hot core 6.8 Young stars start cold, show how they come onto the diagram and evolve to the main sequence
127 6.9 Now we can sketch out the entire evolution of a star. Remember to emphasize this is a graph and we are looking at the relations of the stellar properties. 7. Time permitting, you can show them HR diagrams of clusters and work on the speed of evolution of stars vs. mass and the ages of clusters
The main curricular framework, as can be inferred from the lesson plan above, is a detailed lecture combined with an exercise to reinforce important concepts. In the lesson plan, Hugh places, in line with his own goals and ideas, a lot of emphasis on the concept of a graph, what it is and how scientists use it. He also mentioned that although he assumed the prior knowledge in students to be equivalent to where he addresses the HR diagram (between stellar properties and stellar evolution), he may move the lesson around if he were to base his course around this lesson plan (II, 298, 292). As can be seen from the lesson plan, Hugh builds up the diagram step by step in section 4 and 5 to a fully populated diagram after discussing what a graph is and what it means, rather than showing the students everything all at once. By building up the HR diagram slowly, Hugh can elicit more student feedback on certain relationships (weight is proportional to height cubed) and lead them through the same considerations that people a hundred years ago went through when they tried to construct the HR diagram, for example the need to use star clusters, as was discussed at the end of subsection 4.3.1. Hugh made another interesting observation on the lesson plan and the related concept map task. Even though, as was mentioned earlier, Hugh himself does not teach the HR diagram as a single concept, he noted that he had a few ideas when creating the lesson plan and the concept map that he may try the next time he teaches (II, 546). In particular, he would like students to fill out a piece of paper with their height and weight, and make a diagram of that, to make a more direct connection between measurable
128 quantities like height and weight, and what we can learn about humans from plotting those variables against each other (II, 170, 556). This idea of the height versus weight diagram as an analogy is discussed below in more detail. The concept of a graphs and the height versus weight diagram A central point in the lesson plan is the concept of a graph, featuring in the third and fourth section of the lesson plan. Hugh mentioned that in his opinion, if students do not understand what a graph is, what it means to plot one variable against another, they would just tune out and nothing the instructor would say would connect to them (II, 308, 316). One example Hugh uses to help connect the concept of the graph with the students is first with a plot of something versus time, which is easier for students to understand based on what they read in the newspapers, for example the stock market, and then plots of two different variables, which is where most of the problems arise (II, 175) as students are not used to plotting one variable against another variable that is not time. The example he uses for the latter is the height versus weight diagram. In his version of the analogy Hugh uses that human weight is roughly proportional to height to the third power. Once you have figured out this relation, you have learned something about humans (II, 330, 339). After having learned that relations can be discovered by plotting variables against one another one can then apply this concept to stars. Hugh lets the students volunteer what to plot, as the number of variables is quite limited. If students mention brightness, he points out that the distance impacts the brightness, which students are supposed to know at this point (II, 360). Linking back to history, Hugh points out that a hundred years ago, measuring distance to stars was very difficult, and that
129 astronomers had to circumvent this problem by using star clusters, as was mentioned in the previous section. When the true distances became known, the brightness could be converted into the previously unknown luminosity, an intrinsic property of the star, and more physics could be put in the diagram. But to understand the physics, it is important for students to understand the relationship between temperature, stellar size, and luminosity (II, 405). To help reinforce students’ understanding of the relationship between these three parameters, Hugh uses an in-class exercise. This exercise is discussed in detail below. In-class exercise As mentioned in the subsection on the general course mechanics of Hugh’s classroom, Hugh uses in-class exercises as reinforcement tools for the concepts that he went over in class. In section 5 of the lesson plan, Hugh advises his fictitious colleague to use those as well. These exercises are usually adapted and shortened (one to two pages) versions of the Lecture-Tutorials for Introductory Astronomy (Prather et al., 2008). The exercise for the HR diagram is presented in appendix D of this dissertation. Hugh mentions that besides using tutorials from the book mentioned above, he has developed several others himself (I, 673). Students work on the exercises in class for which they are given 10 to 12 minutes (I, 713). Hugh mentions that the exercises are not graded, but are given pass or fail as an attendance check (I, 604), though they serve primarily as a reinforcement, rather than a classroom management tool. In the case of teaching the HR diagram, Hugh uses a shortened version of one of the tutorials by Prather et al. (2008) to help reinforce the relationship between
130 temperature, size, and luminosity of stars, in essence the Stefan-Boltzmann law (see chapter 1, section 6 and appendix C). The exercise is presented in appendix D of this dissertation and uses an analogy of stove burners of different temperature and different size. In four scenarios, students are asked which of the two stove burners will boil a pan of spaghetti faster. In the fourth of these scenarios students are given a small, hot burner versus a large, cool burner, and they will (hopefully) realize that they cannot say which of the two will boil the spaghetti faster. The idea is that students come to realize that two factors determine how fast spaghetti boils: the temperature of the plate (the hotter, the faster it boils) and the size (the bigger, the faster it boils). A third point that the students should get out of this part of the exercise is that the faster spaghetti boils, the more energy per unit time is put into the water. This concept is then translated to stars and the concept of stellar luminosity, which is the amount of energy a star emits per unit time. Students are given a mock HR diagram (similar to the diagram given in the last stereotypical student statements, see chapter 3, section 10), on which several stars are placed with different luminosities and temperatures. The students are then asked to compare the sizes of these stars. According to Hugh, the goal of the exercise is to get the students on the same page, because if they don’t see the relationship between size, temperature, and luminosity, the HR diagram is not going to connect with them (II, 425). In Hugh’s experience, once students understand the concept of a graph, they are able to solve the inclass exercise, which approaches the material from a slightly different angle (I, 728; II, 491). The in-class exercise takes between 10 and 15 minutes (II, 421) and is discussed
131 afterwards. Students voting using colored pieces of paper to indicate their answer choice for some of the conceptually more difficult multiple-choice type questions that are at the end of the in-class exercise, as is mentioned in section 5 of the lesson plan. Hugh uses this method of colored pieces of paper to make student choices visible, so he can immediately see where students are. A second reason for Hugh to use colored cards, rather than for example electronic responder devices, is that the colored cards are more public, which Hugh notes results in a higher level of student participation than he would have got had he used responders, as those are more anonymous (II, 464). Electronic responder devices are little pocket calculator size devices that have several number and letter buttons on them, with which they can indicate choices, which are collected (and displayed) electronically. In the case study of Paul, responder devices are discussed in more detail. Advice to a colleague In the first section of his lesson plan, Hugh mentioned that the colleague for whom he wrote the plan should not underestimate how many students have difficulty understanding the concept of a graph. Explaining what a graph actually means is something Hugh spent quite some time on in the lesson. Hugh generalized this statement about students not knowing what a graph is and the importance to ensure that students are all on the same page. When Hugh was asked about the single most important piece of information he could give a new colleague who would be teaching nats102 for the first time, he stated the following.
132 Don’t overestimate what they know. It’s not a sign that they’re not intelligent, but it’s simply something they’ve never connected with. And that goes over and over again with concepts so you have to think carefully about how to start at the right point where they actually will get the concept rather than starting what for them is in the middle. (II, 1058, 1066) Hugh cautioned his fictitious colleague about generalizing students’ ignorance about graphs to a statement about students’ capabilities in general. The concept of a graph and its application as an organizing tool for data features prominently in Hugh’s concept map as well, which is discussed in more detail in the next subsection.
4.3.3 Cognitive task II and III: Concept map and Pathfinder network map In the second cognitive task Hugh was asked to create a concept map in which he showed how he would like students to think about the HR diagram. The concept map he created is shown in Figure 2 below. In Hugh’s view, the student should envision the HR diagram as part of a flow chart (II, 593). He mentioned in the interview that the concept map should be seen as being divided in three parts: the left side is the “why do you do it, and how do you get there” part, the center is the “now we’re there, what does it mean” part, and the right is the “now we know what it means, how can we use it to learn more about stars” part (II, 605).
133
Figure 2: Concept map made by Hugh
Asked about how he went about creating the concept map, Hugh describes his flow chart in his explanation,
Well ok, “range of stellar properties”, so “wow, that’s puzzling”. Yet in science we’re supposed to organize those properties, so how we gonna even get an idea about how to organize them and there’s this tool, that people use, not just in science but in lots of places, where you make graphs of something versus something else and see if something pops out. [pause] So, people tried that but it didn’t work. Why not? [pause] Well, not knowing the distance was a problem,
134 ehm not knowing effective extinction was a problem. I mean, there are a number of obstacles to actually getting it right. And finally they did, and so you had the first rudimentary HR diagram, which were typically in clusters so that the extinction was uniform, the distance was uniform. You know, a lot of the variables that were making the... that were hiding the relationships buried in the diagram [cough] are intrinsically controlled in a cluster. [pause] And so, once we have it, then we can talk about ok, there’s a relation, or a bunch of relations. What’s it showing us, so we can talk about those. And eh and so that kinda covers the center part. And then you can go, starting wi..once you’ve done that, you can go over to the extreme right part and..and talk about, you know, now we understand what’s on it, what does that actually tell us about stars and stellar evolution and that’s..that’s the right part. (II, 574) On the right hand side of the concept map, Hugh talks about what happens with stars “under the hood”. With this he meant what is happening inside the star, the dependency on mass of the properties of the star, the thermonuclear fusion, hydrostatic equilibrium and what happens when the hydrogen in the core runs out (II, 634). After this he would talk about how long different stages last, because students need the knowledge of the physics before that makes sense (II, 645).
Hugh completed the Pathfinder rating task after he had completed the concept map task. As was discussed in chapter 3, the rating task was meant to graphically display the links between various concepts related to teaching the nats102 class. Below the
135 resulting Pathfinder network map is presented in Figure 3, based on the data of the rating task. As Hugh observed, it looks like a mess (II, 660), which makes it relatively difficult to interpret the results, even though the measure for internal coherence is at a very high value of 0.79, indicating a high degree of confidence in the results (Interlink, 2009). He commented briefly on the left side of the diagram, which he described as the realitycentered cluster (II, 717), as large classes tend to be more instructor centered, though in Hugh’s opinion this does not necessarily mean that it has to be lecture based, nor that a lack of resources would be an insurmountable obstacle (II, 721). In fact, Hugh mentions that he can make lecture demonstrations out of his lunch, and he means that quite literally. He gives an example of shining collimated light through a glass of water with some milk in it, which will turn the liquid blue, illustrate preferential scattering of light on interstellar dust grains (II, 734).
Figure 3: Hugh’s Pathfinder network map
136 4.3.5 Common student problems and stereotypical student statements Hugh encounters student difficulties with the HR diagram. Hugh classifies student difficulties into two categories, fundamental ones and ones where there is a problem with definition or student confusion. The former difficulties are much more serious than the latter ones. The most prominent example of a fundamental difficulty relates to the concept of a graph, especially when students think that the HR diagram is a picture. Student difficulties that Hugh classifies as not fundamental are those in which the students have a basic understanding of what is going on, but are confused by some of the details. For example, in the HR diagram, the temperature axis is backward, going from hot to cold, rather than the other way around, which Hugh said would be more intuitive for students. Hugh mentions that the reason for the axis being this way is because the temperature axis was originally a color axis, going from blue to red, and bluer colors are indicative of higher temperatures, and acknowledges that student confusion is legitimate. Other questions like what luminosity is, or what astronomers mean by sizes of stars are all similarly useful questions, and can be the ground for a good discussion with the students, as the students show a basic understanding of the concepts, and are asking about finer details (II, 961). Hugh, like all other participants, was asked to respond to various stereotypical student statements that are listed in chapter 3, section 10.2. Below those statements are discussed, save for the statement on physical motion in the HR diagram, as that statement was discussed elsewhere in this case study.
137 How should I study the HR diagram for the test? Because Hugh does not teach the HR diagram as a single unit, but instead sprinkles elements of the HR diagram through multiple lessons, he would advise his student to read his notes and do the practice questions on the cd-rom. In addition, he would advise the students to print out a class outline prior to class and add to it during lecture to generate comprehensive notes (II, 793). The last advice he would give the students is to use the teaching assistants, which he notes “can be subverted into private tutors” (II, 807). How can a star live longer if it has less fuel? Responding to the stereotypical student statement about massive stars having to live longer than less massive stars, because they have more fuel, Hugh started by acknowledging the student and saying that “that’s definitely good logic” (II, 840). To help the student understand the flaw in the reasoning, he would use the analogy of a semi-truck and a Prius. He notes that while the semi-truck definitely has a larger gas tank than the Prius does, the Prius would have a larger range, as the semi-truck guzzles gas much more quickly than the Prius (II, 844). Hugh thought that this argument would go over very well and that students would be conscious of the difference (II, 858), especially because at the time of the second interview in which this stereotypical student statement was discussed, US gas prices were in the vicinity of four dollars a gallon. How do you know a star is big? Asked by a student how we know that stars on the top right of the HR diagram are actually bigger that stars at the top left, Hugh would refer the student back to the
138 radiation laws, which should have been covered in class at this point. Though he could also say that the different sizes are measurable, Hugh noted he would consider such an answer “a cop-out”, as the focus is to let the students know that the physics that underpins the relationship between size, temperature, and luminosity is well understood, so stellar sizes can be determined from first principles (II, 864). How does temperature tell you about brightness? Responding to the stereotypical statement in which a student is confused on how temperature can tell you about the brightness of a star, Hugh would guide the student back to the radiation laws, just like in the previous stereotypical student statement. In addition, he would use the in-class exercise and the analogy of stove burners to make the concepts of temperature and brightness more tangible for the students (II, 883) Ranking task Hugh remarked that his students should be able to do the ranking task, in which four stars are lined up diagonally from lower left to upper right in a HR diagram. He notes that the ranking task is very similar to the second part of the in-class exercise that he uses, so he does not expect his students to have a problem with either the ranking or the reasoning behind the ranking (II, 892).
4.4 Concluding remarks on the case of Hugh Several trends and themes emerged in the case of Hugh. In this section, those themes and trends, namely flexibility of content, student anxiety, and the concept of a graph, are discussed in more detail.
139 Flexibility of content When Hugh created the cd-rom which is now his curriculum for the course, he included many more topics than just astronomy. Biology, the arts, literature, all feature in the course material. Hugh does this because he sees nats102 as a true general education science course. He uses the content as a vehicle to talk about science with the goal to show the students that science, and in particular astronomy, is ubiquitous in daily life, and for the students to (start to) like science. Student anxiety Hugh noted on several occasions that a fair number of nats102 students are apprehensive about the course, believing that they are not going to do well in the class, as they perceive themselves to have low science and math skills. Hugh noted that this anxiety affects women more than it does men, and is not limited to nats102, but extends all the way into graduate school. Hugh was aware that research has been done in this area, as he mentioned that “people write books about this” (I, 580). In the large classroom, he cannot really address the issue of student anxiety (whether due to stereotype threat or not), though he mentioned that in one-on-one situations it would probably work better. Talking about the HR diagram, Hugh brings in the stories (and some personal notes) on how women have made enormous contributions to the understanding of the HR diagram and stellar astrophysics in general. Although student anxiety was not was not explored in more detail in the interviews, it is interesting to note Hugh’s intuitive familiarity with the concept of stereotype threat, the long-lasting consequences, and ways to use (female) role-models to combat the stereotype.
140 The concept of a graph The most outstanding feature in the case of Hugh is the amount of attention paid to the concept of a graph. Hugh notes that many students have problems with this concept and it is important for them to understand it as otherwise talking about the HR diagram would be pointless. Hugh employs several strategies to reinforce the idea that the HR diagram is a graph, and not a picture, from analogies (height versus weight) to carefully building up the HR diagram in the lesson plan and using animations in the cdrom that flash the appropriate parts of the diagram he is talking about.
4.5 The case of Jeff Jeff is a full professor in the department focusing on studies of the interstellar medium, as was discussed the participant profiles in chapter 3. Jeff is a soft-spoken man, who speaks slowly and thoughtfully. As mentioned earlier, I had been Jeff’s teaching assistant in the past, and as such we already knew each other well prior to the start of this study. In that semester, as soon as Jeff found out I was assigned as his teaching assistant, he indicated that he wanted me to help him try out several more learner-centered strategies is his classroom, as he knew that I was “one of those education folks”. He indicated that he wanted me to suggest alternative strategies for the classroom and to ensure that those experiments did not result in chaos in class. The experiences I had in Jeff’s classroom and in working with and for him were different from earlier professional development experiences I have had (Brogt, 2007b) and were fundamental in shaping my current views on working with faculty as a science educator. These experiences sparked
141 my interest in the topic of faculty beliefs and pedagogical thinking, which ultimately led to the topic of this dissertation. The case study of Jeff mostly follows the general outline given in the introduction of this chapter, with two sections dealing with the nats102 course in general and the teaching of the HR diagram respectively. In the general section, a subsection unique to Jeff is added, which talks about “being an effective teacher”, as that was a concern Jeff mentioned several times during his interviews. In addition, the subsection on the differences between teaching nats102 and astro250 is moved to immediately after talking about the students in the nats102 class, as that better fit the narrative story of the case study.
4.5.1 General course mechanics for nats102 Asked about his teaching style, Jeff describes his approach to teaching as “formal” (I, 66), with which he means a primarily lecture-based classroom, with relatively little interaction with the students. Although he tries on occasion to draw out student questions (I, 218) he notes that he is not very effective in doing so (II, 112). The notion of being “effective” in the classroom is a recurrent theme in Jeff’s interviews and will be discussed in section 4.5.4 in more detail. Jeff noted that he has had no formal preparation in teaching in his career and mentioned on more than one occasion how he “was thrown into the deep end” when he first started teaching in the department (I, 115, 127, 456), with only the textbook as a resource from which to construct the course.
142 Perhaps not surprisingly in this light is that Jeff’s instructional planning, the sequencing and the selection of topics, is guided by the textbook (I, 367, 453, 520), which he sees as the principle guide for teaching. The course goals are in large part derived from the textbook as well (I, 453). Partly because textbooks he is using have not changed dramatically in content over the years (I, 367), his teaching has not changed all that much either (I, 270). Over the years, Jeff has developed a preference for condensed textbook (I, 523) as larger textbooks cannot comfortably be covered in a semester (I, 524) and contain things that he judges students do not need or care for (II, 287), for example issues dealing with the philosophy of science (II, 298). Most modern textbooks come with a variety of online teaching tools, though Jeff chooses not to use those (I, 234). The reason for this was the he felt that when these tools came out about five or six years ago it would “unfairly differentiate between students that were comfortable using computers for webbased learning and those who weren’t“ (I, 241), though he recognizes that students these days are most likely all prepared for this type of learning (I, 243). Jeff does use computers and the web as parts of his instruction though. Prior to a class session, Jeff makes his PowerPoint slides available online on the course website in outline (which omits all the graphics, leaving plain text) format (I, 222; II, 157, 168). He makes his material available for multiple reasons. The first is that in his experience students do not read the textbook and the second is that students expect PowerPoint notes to be available online (II, 152). Another is that the speed of the presentation has gone up due to the advent of PowerPoint (I, 220) and a single slide can contain a large amount of
143 information. By making his notes available online and ahead of class, the students do not have to write down everything he says and can instead just follow along and focus on the arguments presented. (I, 223) Assessments in the course Jeff grades on an absolute percentage scale, and does not use grade on a curve in the class, meaning that students are not in competition with each other. Jeff uses a variety of assessments in his nats102 course (Syl, 1). He has two multiple-choice midterms, each worth 15 percent of the course grade. His cumulative final, which is also multiple-choice, is worth another 30 percent. Depending on whether he has a teaching assistant assigned to him for grading, Jeff also uses written homework (in his last course he had a teaching assistant, and the homework counted for 20 percent of the final grade). In-class quizzes count for 10 percent of the course grade and an observing project using the 21 inch telescope on campus (I, 329) is worth the remaining 10 percent. In addition, Jeff offers three opportunities for extra credit, which are worth 2.5 percent each. Even though Jeff has had discussions with other faculty who have tried to dissuade him from using extra credit (II, 213), he maintains the option for the students. Jeff has a specific pedagogical goal in mind with the extra credit opportunities, which is discussed in more detail in the next subsection. 4.5.2 General course goals for nats102 As mentioned in the previous subsection, Jeff’s course goals are derived in part from the textbooks he is using. He articulates three distinct course goals, which can be categorized as content, process, and that students realize that Tucson is a special place for
144 astronomy. With respect to his first goal, namely providing students some knowledge of astronomy, he wants to give the students a sense of [pause] the scope of the universe from our experience on Earth to what we know about today from astronomical studies, which are mindboggling in terms of the distance and time scales and range of kinds of things that we, we know about [pause] from ordinary matter to black holes. (I, 432)
Jeff’s second goal for the course relates to the process of science. He wants to give the students an idea of how science works as a process, how scientists go about investigating nature and learning new things, what it means to make a scientific claim, and the human side of scientific research. He wants to show science not only as a process, but as a human endeavor. He explains this as follows in the two quotes below. It’s more about, you know, what does it mean to make an argum.. a convincing argument on scientific grounds. What is the process and it’s also important I think students realize and appreciate that when they hear about the scientific method that it’s actually a lot less linear than s..many textbooks would..would indicate. You know, there’s an awful lot of back and forth, accidental discovery, ignorance and prejudice and all human traits that come into play, and students need to get a sense of that too, I think (II, 325)
145 That not only there’s this huge scope of reality, of the universe that we understand but also how physical concepts let us reach those conclusions about that physical reality. (I, 442)
The third aspect of Jeff’s course goals is more affective, and has to do specifically with the Tucson area and the University of Arizona as a special place for astronomy. This course goal, quite unsurprisingly, is not one that is commonly found in textbooks. In his own words, he would like to: …give them a sense that they’re in a place which is special in the world of astronomy: Tucson, and the U of A, Steward Observatory, have eh observing facilities and ehm research going which are in the front ranks of the world of astronomy, and so, eh, we are, you know, pushing on these frontiers right here, and that there are people that they, you know, can see and interact with. (I, 506)
This latter goal is one that is very specific to Jeff and the place where he works, and is worth looking at in more depth. In order to have his students experience the wealth of astronomy that goes on in the greater Tucson area, Jeff instituted specific course policies to help achieve this. In the course syllabus, Jeff explicitly makes three extra credit opportunities available for students to go and do something related to astronomy around the Tucson area, as a means for “amplifying and extending the course” (II, 215). Examples of these extra credit options are visits to Kitt Peak national observatory, which is about an hour’s
146 drive from the city proper. Kitt Peak is open to the general public during the day and its visitors’ center hosts night observing events as well, and thus gives students ample opportunity to visit. On the university campus, there are several other opportunities to engage in astronomy. For example, students can visit the Steward Observatory public evening lecture series, in which astronomers from across the country give talks about their research aimed at a non-specialist audience. Students can write a little report about their experiences to get the extra credit. Other options for students include the Flandrau science center (II, 238) and the Mirror Lab. The latter is a construction facility in which large mirrors for professional telescopes are made. Jeff always tries to take students on a tour in this facility (I, 511), as it is unique in the world.
With regards to the first and second course goals listed above, content of astronomy and science as a process, Jeff thinks that those are most effectively learned if students have the opportunity to work with real data, equipment, and experiments. He notes though that most labs were discontinued had to be “thrown out, because of the format of the nats102 course we were forced into” (I, 491). Jeff comments that some of the ideas can be conveyed through paper exercises like the lecture-tutorials he used when I was his teaching assistant (and which are discussed in section 4.6.2 as lecture-tutorials feature in Jeff’s lesson plan), but he thinks that having the experience of working with real instruments and real data teaches the concepts better (I, 493). For Jeff, what the students get out of the course seems to be really important, and he wants to provide them
147 with the best experience he can give. In the next subsection, Jeff talks a little more about who his students are.
4.5.3 The students in nats102 The selection of course goals and teaching methods in Jeff’s class are not only driven by the textbook, but also by the particular target audience, the non-science majors. Jeff notes that students in the nats102 class come from a varied background, and have only “a nodding acquaintance with algebra” (I, 394), but are interested in certain aspects of astronomy (I, 397), for example black holes (I, 435), though not necessarily in those aspects of astronomy that astronomers would consider central (I, 398). Because of the lack of mathematical knowledge in the students, Jeff avoids using mathematics in the course (I, 416), which in his opinion sometimes impedes conveying how we know certain things (I, 407). For Jeff, conveying how we know things in astronomy and giving students an idea of why and how astronomy is so fascinating is the bottom line of his nats102 course. This philosophy is nicely illustrated in his answer to the question on what he would advise a colleague who is going to teach the course for the first time: … try to show your level of enthusiasm for the subject. Convey that any way you can, but that’s really what keeps students interested. You know, just dryly relating stuff that’s already in their book. What is it about it that made you devote [laughing] your life to it, or at least some significant part of your life? Eh for
148 that..that’s probably one of the most crucial things that we can try to convey in a eh an intro nats course. Why is it worth doing at all? (II, 1229)
Enthusiasm and science processes notwithstanding, if Jeff were to teach the introductory class for astronomy majors, the emphases of the course would be slightly different. These differences are discussed in the next subsection.
4.5.4 The difference between teaching nats102 and astro250 Teaching nats102 is very different in Jeff’s mind than teaching astro205. Astro250 is intended for students who want to become, or are, astronomy majors. The emphasis in astr250 as compared to nats102 would be much more on how data is obtained and interpreted “in terms of physical models, physical theories and principles” (II, 378). Because the students have had course work in calculus and classical mechanics, “you can use real physical arguments that are more rigorous” (II, 356). It is intended as a filter, and to send a message to those students thinking that studying astronomy means looking at the night sky, that they are mistaken and that astronomy really is physics (II, 407). This is done because the curriculum of the department does not supply other astronomy course work until the end of the sophomore year, which is already rather late in a student’s career to find out that the study may not be what they thought it was. The course also serves as a teaser for the astronomy majors, who otherwise may become disappointed that there is no astronomy course work until the end of the aforementioned
149 sophomore year (II, 421). Because nats102 and astro250 are so different, Jeff would approach the classes very differently as a result (II, 351). Students in astro250 would have had course work in physics and calculus, meaning that Jeff could use more rigorous physical arguments. Jeff would expect students in this class to be prepared to deal with the physics and math involved (II, 389). In the nats102 class however, Jeff does not use mathematics, and as such cannot use that language to convey the concepts of astronomy. This may be part of the reason why he worries about being an effective teacher, which is the topic of the next subsection.
4.5.4 Being an effective teacher In his interviews, a recurrent theme in Jeff’s comments concerns “being an effective teacher” and he considers being effective in the classroom to be quite important. Remembering his own instructors as a student, he comments that his best teachers were examples of “somebody who is totally in control of the subject and knows from long experience exactly how to present the material effectively” (II, 86). In Jeff’s definition, an effective teacher is Well, one who consistently keeps the attention of most of the students, at least the majority. Ehh, and can convey a basic concepts I.. maybe only one, every encounter, every lecture or whatever else goes on during the class hour. It may not be just the lecture. And like I said, some of the, the more effective things that we used to do were involving in-class activities with, I guess what I call real handson experience (I, 485)
150 Jeff expresses concern about being effective in the classroom. He mentions that due to the cycle of courses he does not get to teach nats102 all that often, maybe once in two to three years (I, 706). Jeff mentions that he is “kinda rusty” (II, 125) and notes that he had trouble engaging the class immediately and consistently throughout the semester (I, 669). Jeff’s concern about being effective shows in his desire to have staff support to assist with lecture demonstrations (I, 588) and educational technology like responders (I, 580, 602, 719). Such assistance should help with both technical support, the set-up and running of the demonstration, and educational support, to help integrate technology and demonstrations into the classroom in a meaningful way (I, 581). He expresses a wish to experiment with electronic responder devices in the classroom, but admits that it “would be a leap of technology for me” (I, 563). When I was Jeff’s teaching assistant, we experimented with in-class learnercentered exercises, as mentioned in the introduction to this case study. In the beginning of that semester, I usually led the exercises, while later on in the semester Jeff took more control. This is the sort of observational learning that Jeff did that term showed through in the interview as well. Jeff mentioned that his teaching has been influenced by his former instructors as well, in the sense that they gave him an idea of “what good teaching ought to be” (II, 79). It is this learning by observation of good practice that Jeff thinks is valuable. He mentions that observing effective teachers in the classroom would be a way to become more proficient in teaching as a new instructor, though he mentions that there are hardly any opportunities for that in the department (I, 474).
151 Even if Jeff had the opportunity to observe other instructors teach the nats102 course, the setting would still be rather similar; a large enrollment course, an auditorium style lecture hall, a single teaching assistant. So how would Jeff approach the teaching of nats102 if he were given unlimited resources, and actually change the setting in which the nats102 course takes place? This idea is explored in more detail in the next subsection.
4.5.5 Teaching nats102 in the ideal world In Jeff’s ideal world, where resources would not be a consideration, he would like to have some of the elements discussed above to help him be more effective in the classroom. Among the things on his wish list would be more support (and support staff) for more interactive lecture demonstrations and technology in the classroom (I, 717). Also, to help promote more interactive activities in the classroom, he would like to reduce the class sizes from 150 down to at least 100, and preferably even smaller, to 30 to 50 students, though he adds that the limited amount of resources that would unobtainable in reality (I, 732, 742).
4.6 Jeff’s approach to teaching the HR diagram 4.6.1 Goals for and approach to teaching the HR diagram According to Jeff, the HR diagram has a central place in astronomy, especially in stellar astrophysics and stellar evolution, and is an example of his goal to show students on how the laws of physics allow us to reach conclusions about reality (II, 620). In his
152 experience however, students have a difficult time appreciating the centrality of the HR diagram, largely because it is such an abstract concept, whereas other concepts in astronomy, for example, planets, are easier for students to relate to. Jeff finds it challenging to help students make that connection, in part because the physics involved cannot be easily explained without the use of mathematics (I, 765, 789). In his course, Jeff places the HR diagram in between the lessons on the properties of stars and stellar evolution. He discusses the physics behind the properties of stars, covering concepts like blackbody radiation, colors, temperature, luminosity, distances, and flux, and how those are measured with telescopes, photometry, and spectroscopy (II, 557; I, 857). He discusses the spectral classification of stars, and the realization (which in the lesson plan is denoted as “work of Cannon”, referring to the pioneering work done by Annie Jump Cannon) that the spectral type of a star is dependent on temperature. From there he discusses how Hertzsprung and Russell created the diagram, and that certain stars don’t seem to fit the main sequence (I, 866), leading to the aspects of stellar evolution that can be inferred from the diagram (II, 563). As in the rest of his course, Jeff’s teaching of the HR diagram is guided by the textbook he uses. The sequence he uses; talking about what can be observed from stars, how to make sense of those data, and how that leads to the concept of stellar evolution using the laws of physics, is also a typical sequence in introductory astronomy textbooks (I, 891). In the next subsection, the suggested teaching of the HR diagram is explored, using Jeff’s lesson plan as a basis.
153 4.6.2 Cognitive task I: Lesson plan In the second interview, in which the construction of the lesson plan was discussed, Jeff commented that prior to the assignment of the lesson plan task as part of this study, he had never written a lesson plan before, as he had had no pedagogical training. He approached the plan as an overview of the concepts he wanted to get across, in which order, and how the concepts were connected (II, 495). Jeff mentioned that the central take-away message from the lesson plan for the students is that the HR diagram is a framework in which things that can be measured with telescopes, like temperatures, luminosities (given the distance), can be placed. Within that framework we can understand the physical properties of the stars based on these observables, which allows for inferences to be made from the HR diagram as to how stars will change over time (II, 514). The lesson plan itself is outlined below.
"Lesson Plan" for NATS 102, topic: the HR diagram Context: properties and evolution of stars Key points/development of key concepts 1. how we measure basic properties of stars -BB radiation; colors and temperature -atoms and spectra: Bohr's model; hydrogen atom and spectral lines; extension to other elements -luminosity and distance; how we measure distance -system of spectral types; relationship to temperature 2. HR diagram as a synthesis of systematic studies -HD catalog; work of Cannon, others -H & R's discoveries of temp-luminosity relations -concept of the main sequence -mass-luminosity relation 3. HR diagram and stellar evolution -stellar energy sources -modelling how stars shine, evolve -from young to old--dwarfs, giants, SGs on the HRD. -evolutionary models--how stars change with time and
154 where they fall on the HRD (examples of evol. tracks) 4. HR diagram and clusters of stars -as tests of evol. models -concepts of stellar populations -related to element abundance, age, location -leading to concepts of galaxies, their constituent parts and how they evolve In-class lecture tutorials related to HRD; temp/color/luminosity concepts.
The explicit link between theoretical quantities and observable quantities played out in Jeff’s concept map as well, linking a star’s color and spectral type (observables) to its temperature, and linking a star’s size and temperature as well as the apparent brightness and distance to its luminosity. The concept map is discussed in more detail in the next subsection. In the lesson plan, Jeff breaks the complex relationship between temperature, size, and luminosity down in several steps to make it easier for students to follow the reasoning. He starts by comparing the luminosities of two stars of the same temperature, but different size (the bigger one will be more luminous), followed by comparing the luminosities of two stars of different temperatures, but with the same size (the hotter one will be more luminous). In Jeff’s experience, the biggest problem for students in linking the luminosity to the size and temperature is the fact that temperature has a much stronger influence on the luminosity than size, as temperature in the StefanBoltzmann equation is raised to the fourth power (see appendix C). According to Jeff, the students do not understand mathematically what is happening (I, 804). Jeff mentioned that he uses simple numerical examples to help students make this connection, and commented that some textbooks use HR diagram graphics that show different sizes of stars, which he thinks helps a lot (I, 818).
155
After the HR diagram is constructed using these small steps, Jeff then proceeds to tie in the concept of stellar evolution. Setting up this connection comes with its own set of difficulties for students in his experience. One of the main problems for the students is the concept of motion on the HR diagram. In astronomical terms, moving on the HR diagram refers to stellar evolution, where stars evolve from a main sequence star to a red giant (and depending on mass to a white dwarf later). These physical changes in stars are accompanied manifest themselves in changes in temperature, size, and luminosity, meaning it leads to changes in the location on the HR diagram. Stars move on what astronomers call an evolutionary track, a process that takes millions to billions of years. For students however, movement signifies physical motion in the sky, and as such think that this motion can be observed (I, 834; II, 1057). One of the stereotypical student statements addresses this exact idea. The stereotypical student statements are discussed in section 4.6.4. Though he does not address it directly in his lesson plan, Jeff mentions in the interview that students have difficulty with the idea that one can infer information about a non-observable variable from observable ones, in the case of the HR diagram inferring evolutionary stages of stars from the observed temperatures and luminosities of an aggregate of stars. To try and help the students understand how we can make these inferences, Jeff uses the analogy of a height versus weight diagram for humans to learn something about more about humans in general. His use of this analogy is discussed below.
156 Height versus weight One way that Jeff tries to explain how one can make inferences from a diagram is by using an analogy of a height versus weight diagram. Jeff mentioned that he got the idea of using this analogy from an introductory textbook (co-)authored by Mike Zeilik (though he cannot remember which of Zeilik’s books it was), who is a (now emeritus) professor of astronomer from the University of New Mexico and who is sometimes credited as the grandfather of astronomy education research. Jeff explains the analogy as follows. If he were to take a sample of students in the class and measure their height and weight, he would get a reasonable correlation, with some scatter. Taller people in general will be heavier than smaller people. However, if you were to take samples from not only college students, but sample people from the entire age range from infants to very old people, the correlation between height and weight tightens. Using this correlation of a large enough sample, one can infer an average development of humans. This means that if you know someone’s height or weight, you can also make a reasonable estimate of that person’s age. It also means that you can predict how the height and weight will develop for a single person over the course of his or her life, without having to wait that person’s entire lifespan. If one then substitutes stars for humans, and height and weight for temperature and luminosity, the same argument holds. While we cannot observe the entire lifetime of a single star, we can make inferences about stellar evolution because we have observed a large enough sample of stars. (II, 538; I, 843) Besides using the analogy of a height versus weight diagram to illustrate how one can make inferences from graphs and diagrams using the laws of physics, Jeff also uses
157 in-class tutorials to reinforce the physics concepts themselves. These tutorials are the topic of the next subsection.
Lecture-Tutorials At the bottom of his lesson plan, Jeff mentions using tutorials for various physical concepts, though he does not explicitly sequence them in the lesson plan proper. The tutorials Jeff refers to are taken from the Lecture-Tutorials for Introductory Astronomy (Prather et al., 2008). When I was Jeff’s teaching assistant, we used these lecturetutorials in class with the implementation as described in Brogt (2007c). In short, the tutorials are in-class activities that lead students through a particular concept in astronomy. The materials are written such that they confront the most common student misunderstandings and reasoning difficulties. Several of these tutorials cover topics in physics that are relevant to the HR diagram. For example, there are tutorials covering blackbody radiation, temperature, luminosity and size of stars, and the HR diagram. Asked why he chose to do the tutorials as part of the lesson plan (which he had not done until he and I worked together), Jeff explained: Why, oh, well, I mean I think you convinced me they have a value in the class and that’s a way of getting students a little more engaged, active learning, not just, you know, having thei..the top of the head removed and knowledge dumped in. (II, 573) It should be noted though that it is logistically not feasible to do all these lecture-tutorials in one class setting, as they typically require (at least in the implementation Jeff and I
158 did) 10 to 20 minutes apiece. In the interview, the specific logistics of doing multiple lecture-tutorials in a 75 minute class were not discussed. In the second cognitive task, the concept map on how he wants students to think about the HR diagram after the class, several of the elements discussed above resurfaced. However, there were also some marked differences between the lesson plan and the concept map. In the next subsection, the concept map and the Pathfinder network map are discussed in more detail.
4.6.3 Cognitive task II and III: Concept map and Pathfinder network map In Figure 4 below, a scan of Jeff’s handwritten concept map is presented. Asked in the interview how he went about creating the concept map, Jeff started by mentioning it had been a good challenge for him to make the map and that he had had to think about it (II, 637). He went on to explain that he looked at the concept map as a kind of a flow chart of thought processes and linking concepts in abstractions and observables in graphical form. He mentioned that the concept of a graph is difficult for students, especially graphs that depict abstract concepts like temperature and luminosity, and do not have time on the horizontal axis, like a stock market chart has for example (II, 646, 722, 731). Though he also mentioned the concept of a graph in the discussion about the lesson plan task, it was not present in the lesson plan task itself. Twice in the interview, when talking about the concept map, Jeff mentioned that he should probably spend more time in the future teaching the concept of a graph (II, 651, 681), something he had not done explicitly before. He referred to the height versus weight diagram analogy, which was discussed in the previous subsection, as one possible way of doing this. Identifying
159 the regular patterns on the HR diagram then gives rise to talking about where stars get their energy from and what happens when they run out of fuel (II, 800), leading to the concepts of star formation and stellar evolution (II, 800). Jeff referred to the concept map cognitive task in the first stereotypical student statement, where a student asks how to study the HR diagram for the test. For this reason, this stereotypical student statement is discussed here, rather than in section 4.6.4, as it is pertinent to the discussion here. Asked in that stereotypical student statement how a student should study the HR diagram for the exam, Jeff referred back to the concept map as the road map for what he wants students to understand. He explained: I would sort of go through this concept map to some extent, like ok, here the, you know, these are the important concepts that you need to be sure you follow and eh understand and can connect them. And then what are the implications and ehm utility or what do we use the HR diagram for in terms of understanding stellar evolution, stellar populations, all these other things that we..we talk about. So, actually, you know, I guess the concept map would be pretty close to what I would summarize for a student to be sure they understand (II, 1040) Jeff commented that the concept map exercise was a useful one for him to help him think about what he wanted his students to know and understand (II, 1050).
160
Figure 4: Concept map made by Jeff
Jeff’s Pathfinder network map is shown below in Figure 5. Unfortunately, the network map was rather difficult to interpret and as a result was not discussed much during the interview. The reason that his map was difficult to interpret is twofold. First, the map appears rather messy, without a clear central node or a dominant structure. However, the most important node was “scientific literacy”, but even though it was the most important node, the meaning of this is difficult to establish. Taken at face value, one may argue that this node aligns with Jeff’s course goal on how scientists know things
161 and the goal to show science as a process. However, the measure for internal coherence of Jeff’s network map was 0.17, which is below the threshold of 0.2 that is typically used as a cut-off for having confidence in the results (Interlink, 2009). This makes even the “scientific literacy” node suspect as a result. Jeff was not quite sure what to make of this map (II, 923) and the matter was not pursued further in the interview. The map was primarily used as an illustration.
Figure 5: Jeff’s Pathfinder network map
4.6.4 Most common student difficulties and stereotypical student statements The last part of this case study deals with the difficulties students encounter while trying to understand the HR diagram in the introductory astronomy course. Jeff mentioned that the HR diagram is one of the more challenging topics to teach in a nats102 class (I, 777). As noted above, the abstractness of the diagram, the connection
162 between the observables and the theoretical quantities, and the mathematical relationship between the different quantities can be difficult for students. On the relationship between the quantities, Jeff commented that students have difficulty seeing them as independent, that for example a hotter star is not necessarily also more luminous, but that there are many different possible combinations of size and temperature, which actually happen in nature (II, 703). To help students disentangle the concepts, Jeff would use analogies from daily life experience (II, 1185), using for example a big versus a small fire. A small and a big fire have the same temperature, but the amount of energy given off is different (II, 1193). Another analogy he would use is about a glowing metal in a toaster oven or hot plates. Hot plates at different settings have the same size, but different temperatures, meaning that the amount of energy emitted is different as well (II, 1199). A second concept Jeff mentioned students having difficulty with is the idea of stellar evolution, why a star changes its characteristics over time, though he commented that it is a concept that is difficult to understand for astronomers as well (II, 708). During the interview, Jeff did not elaborate further on this observation. A third point Jeff brought up that he thinks students struggle with is the abstractness of the HR diagram. Discussing this level of abstractness, Jeff mentioned that students, besides the complexities pertaining to the concept of a graph, have trouble making the connection that the dots on the diagram are real physical entities, real stars. He speculated that most of the students have never seriously looked at the night sky before to observe the stars (II, 741), especially if they have lived in cities or (sub)urban environments. They may of course have seen images of stars before, but those are most
163 likely from the NASA press office that are very high quality, as they are made with the best telescopes currently available. Those images do not compare to what you can see through a typical commercially available small consumer telescope (II, 744). Jeff linked this disconnect, that students may not see stars as the real physical entities like astronomers do, back to his course goal to give students an appreciation of the physical reality and the aesthetics of the night sky, though he mentioned he is not quite sure how to do that in practice in the nats102 class (II, 764). Besides the student difficulties Jeff identified, he was also asked to respond to the stereotypical student statements. These statements are discussed below, with the exception of the first stereotypical student statement, which has a student ask how to study the HR diagram for the test. This statement was considered in the discussion about the concept map in subsection 4.6.3. Do stars physically move on the HR diagram? Responding to a stereotypical student statement concerning the moving of stars across the HR diagram, Jeff said that students think stars are moving on the diagram, as he had mentioned before. He would explain to the student that the HR diagram is a snapshot of a large number of stars, and that we can only watch them move if we model the stars in a computer, where time can be sped up (II, 1057). How can a star live longer if it has less fuel? When dealing with a student who thinks that a star that is twice as massive should live twice as long, as it has twice the fuel, Jeff responded using an analogy of a gas tank, and that the size of the gas tank is not the main issue, but how much of a gas guzzler the
164 car (or star) is that determines how long the fuel lasts. As bigger stars guzzle a lot faster than low mass stars, they do not last as long (II, 1083). How do you know a star is big? Responding to the student question asking how you know that a star at the top right of the HR diagram is bigger than a star at the top left, Jeff would respond by pointing out that in some cases, stellar sizes can be measured directly. In addition, he would note to the student that the Stefan-Boltzmann law (see chapter 1, section 6 and appendix C) relates size, temperature, and luminosity. Stars in the top left and the top right of the diagram have similar luminosities, but the ones on the left are much hotter. This means that the stars on the top right have to be bigger to compensate for that (II, 1092). How does temperature tell you about brightness? In his response to the student who was confused about how temperature can tell you something about brightness, Jeff commented that he would reiterate parts of the relationships between the different quantities, indirectly referring to the concept map he made. He would engage the student in a conversation, trying to draw out what it is exactly that they are confused about to try to assist the student. Jeff said that there obviously was a misconception happening on the student’s part, but without further dialogue it would be difficult to assess what exactly the student was having a problem with (II, 1120). Ranking task
165 Jeff remarked that the exercise of ranking the sizes of four stars on a temperature versus luminosity plot looked familiar. In fact, Jeff had actually seen the ranking task before, as it had been part of a homework assignment we had given out in the semester I was his teaching assistant. He had not designed the homework assignment though, nor had he graded it. Jeff commented that he would expect the better students to be able to do the ranking at the end of covering the topic in class (II, 1136). He indicated he would be happy if students would compare the four stars in a pair-wise fashion (AB, BC, CD in the diagram, see chapter 3, section 10.2) and note that the cooler and more luminous has to be bigger, using the relationship between temperature, size, and luminosity (II, 1147).
4.7 Concluding remarks about the case of Jeff Several themes and trends appeared from the data. In this section, these trends and themes are discussed in more detail and interpreted. These themes were: 1) working with real data, 2) a difference in approach to teaching graphs between the lesson plan task and the concept map task, 3) being effective as a teacher, and 4) willingness to experiment. Below, these themes and trends are discussed in more detail. Working with real data Jeff thinks that students learn best if they work with real instruments and real data. His remarks that the labs had to be removed “because of the format we were forced into” (I, 491), referring to the restructuring of the general education science courses in the mid-1990s, speak to this. This can be interpreted as Jeff considering the absence of labs detrimental to the students’ experience with science.
166 The difference in approach to teaching graphs between the lesson plan, the concept map, and second interview When looking at Jeff’s lesson plan, there is no mention of the concept of a graph, and the student difficulties with diagrams in general. Instead, it focuses primarily on content and content sequencing. This is consistent with how the class was taught in the semester I was Jeff’s teaching assistant. We did not spend time in class on the concept of a graph. However, in the second interview (which took place after all three cognitive tasks had been completed), Jeff explicitly mentioned the height versus weight diagram analogy to illustrate how trends in a diagram can be used to make inferences. In his concept map he again prominently put the concept of a graph on the map. He explained that he probably needed to spend more time directly and explicitly addressing the concept of a graph in the nats102 course, as students are having problems with the abstractness of the HR diagram as a graph. It may be that Jeff simply forgot to mention the concept of a graph in the lesson plan task, or that something happened either in between the first and second cognitive task, or in doing the second cognitive task, that triggered Jeff to include the concept of a graph explicitly. As he mentioned in the first stereotypical student statement, the one where a student asks how to study the HR diagram for the test (see section 4.6.3, in the discussion of the concept map), that he had found the concept map task useful for his own thinking about what he wanted students to get out of the HR diagram class, I would speculate that creating the concept map may have had an influence in that regard. Being effective as a teacher
167 At several instances in the interviews Jeff mentioned that he has had no preparation for, or training in teaching. When he became a faculty member, he was “thrown into the deep end”, with only the textbook as a resource to draw on. Jeff appears concerned that he may not be as effective as a teacher as he could or should be in his mind, where he defines effective as keeping the students’ attention and conveying basic concepts. He would strongly prefer to have more instructional support, or support staff, at the department level, to assist him in the use of technology in the classroom and for general teaching advice. In a sense, he argues for the presence of a “knowledgeable other” (Offerdahl, 2008), a go-to person in the department for pedagogy, advice and assistance on classroom demonstrations, and educational technology. Though the data gathered for this dissertation study does not mention this, Jeff had mentioned in the past that had I not been his teaching assistant, he would not have experimented with some aspects of learner-centered pedagogy during that semester. It is not quite clear if Jeff’s concerns about being an effective teacher are limited to the nats102 class, or whether it is broader. He does mention though, that conveying the concepts of the HR diagram without the use of mathematics is not easy (I, 819) Willingness to experiment Even though Jeff considers himself to be a “formal” teacher, relying heavily on lecture, Jeff seems quite willing to use different pedagogical techniques, provided that they are implemented in such a way that it does not undermine the effectiveness of the classroom. Jeff mentioned on more than one occasion that he has no training in pedagogy and as such would like someone experienced with him to ensure that the
168 pedagogical techniques work, which relates to the notion of the importance of being an effective teacher. As his teaching assistant, I introduced Jeff to lecture-tutorials which now came back in the lesson plan Jeff made, as he was convinced that they were a useful technique for the classroom. Jeff made similar comments about electronic responder devices, which he mentioned would be another leap in technology for him. Yet, he appeared willing to start implementing them in the classroom, provided he receives a thorough induction from a “knowledgeable other” (Offerdahl, 2008).
4.8 The case of Linda As was mentioned in chapter 3, Linda is a full professor of astronomy in the department, where she spends the majority of her time managing the design and construction of an infrared detector for an upcoming space mission. She and her husband Hugh, who is also a full professor in the department, team teach two sections of nats102 each year, sharing curriculum and assessments for both sections. They do this primarily because they both have heavy travel schedules, so that they can easily substitute teach for each other, and the students are then used to having two, rather than one instructor. The case of Hugh is presented earlier in section 4.2 through 4.4 of this chapter. The case of Linda follows the general template outlined in the introduction of this chapter, with two deviations from the general template for the case. The first is that rather than starting with the general course goals, the case starts with a short introduction to how Linda’s course came to be. The subsection on course goals is intimately tied to Linda’s ideas about the students in the course. As a result, the subsection on students in the course and
169 classroom environment is split in two. The part on students in the classroom is in between the subsections on course goals and course mechanics, and the part dealing with the general classroom environment is included in the subsection on course mechanics.
4.8.1 Course history Nats102 fulfills a general education science requirement at The University of Arizona. In the mid-1990s, the university overhauled the general education program, which led to campus wide discussion on what a general education science course should look like (I, 302). Linda and Hugh had already been talking about the course and knew from their experiences as instructors what students did and did not like in the old course, astronomy one-hundred (astro100). At the time, the department offered two courses. In addition to astro100 there was a one credit astronomy laboratory class called astro110b. This lab course was discontinued as a result of the restructuring of the general education science courses and astro100 was renamed nats102. At the same time, Linda and Hugh were developing a cd-rom with curriculum material that they could use in lieu of a textbook. In the development process of the cd-rom, they started thinking about what the course should be like and what the goals should be (I, 289). Their discussions, fueled by the changes at the university level, led to the development of the class at it is now. The selection of topics and the presentation of material are chosen with two specific course goals in mind. These goals are discussed in the next subsection.
170 4.8.2 General course goals for the nats102 course The realization that the audience is not set to become astronomers plays out in the course goals that Linda has for the class. Rather than imbuing the students with a given set of facts about astronomy, Linda and Hugh agree on the goal to try and get people to understand and appreciate how scientists work and think, and to give students some experience in thinking that way (I, 267; II, 186). Other goals are to show students how science fits into arts and culture (I, 294) and how science affects policy discussions (I, 281). The overall purpose is to turn out scientifically literate citizens who can ascertain whether something they read in the papers makes sense from a scientific standpoint (I, 458; II, 156). Linda tries to achieve those goals by giving the students the tools with which scientists try to understand the universe, by showing the students how the scientific method developed and how one can assess information (I, 476). Finally, the students learn about the tools of physics and how to use those to understand the universe. The emphasis on science as a process, how scientists know certain things, shows through in the selection of course materials. Linda and Hugh emphasize the intellectual history of science, how strategies of doing science and testing ideas were developed (II, 138).
One example where the de-emphasis of factual knowledge plays out is in the discussions about stellar magnitudes, which Linda mentions several times in the two interviews (I, 269, 610; II, 161). Astronomers still use (a modified version of) the system of magnitudes devised by Hipparchus over 2100 years ago (see appendix C). Linda consistently avoids using this unit in class, as she thinks it is not needed for students to
171 get the point across, and makes matters unnecessarily more difficult. This is but one example of how the choice of curriculum is influenced by the target audience, the (primarily freshman) non-science major student. In the next subsection, Linda’s thoughts about the students in the course are discussed.
4.8.3 Students in the nats102 course One of the most challenging aspects of the course, according to Linda, is that the audience has a very broad range of abilities (I, 317). She thinks that students, who have general education requirements in science, like to take those requirements in astronomy (I, 441). She remarked that around forty percent of all University of Arizona graduates take introductory astronomy, though she also concedes that interest in astronomy may not be the primary motivation to enroll. Instead, she thinks that that the primary reason for students to enroll in the class is because it fits their schedule (I, 498) and that although some may be interested in astronomy, this is not a given for the entire class (II, 126). Because nats102 serves such a large fraction of the student population, Linda comments that One can have a pretty big influence on making a..making the undergraduates at this place scientifically literate by doing a good job at teaching this class.” (I, 448). Linda realizes that for many of the students the introductory astronomy course is the last experience they will ever have with science and will have very different career paths. As such “knowing minute facts about astronomy is not really important” (I, 279, 611). She
172 echoes this sentiment later when she was asked to give the single most important piece of advice to a new colleague who would be teaching nats102 for the first time: “don’t think you’re trying to turn them into astronomers” (II, 801). Instead, as was indicated in section 4.8.2, the goals of the class focus more on appreciation for science and science literacy. How the course is set up to help meet those goals is the topic of the next subsection.
4.8.4 General course mechanics for nats102 Linda characterized her teaching style as lecture and demonstrations and “probably a bit too dry” (I, 534). She tries to call on students with questions, but finds it hard to elicit a response from them. Linda thinks that this is due to students either being shy, not wanting to give a wrong answer, or –when the question appears easy– thinking that it is a trick question (I, 543). Linda describes the atmosphere in the classroom as having “a genial time” (I, 556), though some disruptive behavior like talking in class and leaving early causes her to sometimes have to interrupt the class to restore order (I, 557). Linda sometimes uses elements of her research in her teaching, as she thinks it is important for students to know what their professors do and how they do it (II, 96), in line with the course goal of giving students an understanding of what it is scientists do. Linda and Hugh employ a variety of assessment techniques that weigh differently into the course grade, which is then calculated on an absolute scale, meaning that the students are not in competition with each other. One of the assessment techniques is the multiple choice exam, of which there are four, three midterms and a final. Linda
173 mentions she does not really like the multiple choice exams (I, 351). She would prefer to give more written student work, because she has seen it be effective when she was teaching the much smaller astro250 class (I, 349), the introductory astronomy class for science majors. However, in a class of 150 students, she does not feel like she has a choice. The three midterms are worth 100 points each, and the final is worth 200 points. Linda comments about the multiple choice exams that she (and Hugh) “cut the students some slack”, whereas the rest of the course is at a slightly higher level. They do this so that students can still get a C in the class while at the same time exposing them to some more challenging material (I, 327). Linda mentions that the overall level of the course is aimed at the B-plus student, in part because they “don’t want to completely bore the good students” (I, 336). A second form of assessment that Linda uses in her classroom is an information literacy project, in which students learn to evaluate sources of information (I, 358). The project is done in collaboration with the science library on campus (I, 357) and serves a dual purpose. The first one is that students learn how to find and evaluate sources of information, which ties into the general course goal of promoting scientific literacy. The second purpose is that the science literacy project serves to accommodate multiple learning styles, as it is an opportunity for students who may not be good at doing standard multiple choice exams to show their skills (I, 364, 370). The science literacy project, which is coupled with two homework assignments in preparation for the final paper, is worth 150 points total.
174 Linda does not speak much about the last part of the three break-out labs that are organized in the course, one on spectroscopy, one on the output of the Sun, and one on radiation. These break-out labs are worth an additional 100 points, according to the class syllabus (Syl, 1). This brings the total number of points to 750. The course is graded A, B, C, D with percentage cut-offs. However, there is a wild card in the grading scheme. In addition to the 750 points that are assigned to the various assessments discussed above, there are in-class exercises (I, 354), each worth 15 points, of which the total number is not announced up front. Although if students obtain a certain number of participation points (say six out of eight) they get full credit, this is not generally announced to the class. These exercises serve as participation credit, to encourage the students to come to class, though they are also pedagogical tools to help students understand the concepts in the course. Below, these in-class exercises are discussed in more detail. In-class exercises The in-class exercises are a regular feature in the classroom of Linda (and Hugh’s). These exercises are usually adapted and shortened versions of the LectureTutorials for Introductory Astronomy (Prather et al., 2008). The in-class exercise is presented in appendix D of this dissertation. The in-class exercises take about 15 minutes of class time after which they are collected. Linda does not grade the in-class exercises, except for participation credit. She –and Hugh– look them over to identify trends in the answers and discuss the most common mistakes made in class (II, 82). In-class exercises serve another purpose than assessing where students are and what they understand. Because the class is so big, students shy away from answering questions in class. Also,
175 there is a certain peer pressure not to answer questions, which is perceived as not “cool” (II, 73). In Linda’s experience, students “actually understand more than they like to let on” (II, 67). The in-class exercises draw out what students are thinking in a non-verbal way. Students seem to like the fact that they can simply try without the pressure of getting penalized for making mistakes (I, 562).
4.8.5 The difference in teaching nats102 and astro250 As has become clear from the previous subsections, Linda’s goals for nats102 are not so much content based, but are more affective and science literacy based. This stands in marked difference with the way she would teach astro250, the introductory astronomy course for science majors (II, 217). The primary differences are that she can assume interest in the subject matter from the majors, as well as a deeper mathematical background, allowing her to use many more equations throughout the course. Linda mentions that she would still use lecture demonstrations and videos in class, but the point of those demonstrations and videos would be different. The focus would be more on the underlying physical principles. A last difference between her teaching style of nats102 and astro250 is that she would give many more problem sets in the astro250 course. These differences in teaching approach in two similar courses, but with a markedly different target audience hint at the adoption of techniques specifically for the nats102 class. In the next subsection, this is taken one step further, and Linda is asked how she would teach nats102 if resources were not an issue, and she could have and do anything she wanted.
176
4.8.6 Teaching nats102 in the ideal world Linda mentioned several things she would change in the nats102 class if she were to have no constraints. The most important one in her mind would be shrinking the class size from about 150 to 25 (I, 925). She would like this for two reasons. First, she would know everyone (I, 948) allowing her to better help individual students (I, 958). Second, it would allow her to do more varied types of assessment, with essay questions and word problems, which Linda thinks are more precise in determining what students know than a multiple choice exam (I, 948), and more interaction and experiments. Related to the experiments, she would also like to have more equipment to do more and different experiments in class (I, 926). Smaller groups were used in the past in astronomy 110a, the accompanying lab course that was discontinued after the general education overhaul. These were led by TAs who would do more hands-on things in class and discuss material students had difficulty with (I, 389). Elsewhere, in a different discussion talking about large lecture classes, Linda mentioned that she would prefer to go back to the four unit course (three units of lecture and one unit of lab) in which TAs can then also have a more meaningful teaching experience, by being in charge of one of the break-out sessions (I, 417). The last thing Linda mentions for her ideal world is to do away with final grades, as the cut-offs between grades invariably lead to some student frustration (I, 935), though she concedes that in a class like nats102 the final grade serves as a motivator for some students to do the work (I, 938)
177 4.9 Linda’s approach to teaching the HR diagram 4.9.1 Goals for and approach to teaching the HR diagram In the sequencing of Linda’s nats102 course, the HR diagram is placed right after the discussion on the properties of radiation, stars and spectral types, and before stellar evolution (LP, 2; I, 736, 751, 798). In her teaching, Linda uses a historical context for the HR diagram to illustrate the progress of knowledge about stars, and how Hertzsprung and Russell linked spectral type to luminosity (I, 738). Taking this historical approach links back to the original course goal about how scientists know certain things and how they organize data to infer deeper meaning (II, 517). Linda shows the students the different varieties of the diagram, with the axes labeled differently (I, 782). The exception however is the use of magnitudes, which Linda tries to avoid, as she considers the concept of magnitudes to be not useful for the nats102 population. She also does not cover things like relative sizes of stars, something she considers a nuance (I, 795). Instead, she teaches the HR diagram as “an intellectual construct” (I, 805), using the history to emphasize the struggles scientists went through to try and understand how stars work. Linda sees the HR diagram as an organizational tool in astronomy. She comments that the HR diagram serves as an example of how astronomers have organized their knowledge and organized information that they’ve gathered and it’s a way to take ehm this humongous pile of stuff that people learned and organize it into a way that you can actually learn something fundamental about stars. (I, 718)
178 The link to stellar evolution is important as well. According to Linda the main point of teaching the HR diagram is that it provides an empirical message about stellar evolution that was not evident until the diagram was constructed (II, 557), namely the fact that stars are not randomly distributed over the diagram, but instead fall in specific regions, the largest of which is the main sequence. In order to explain that structure, one has to look at stellar evolution (I, 741). As a result of her teaching the HR diagram, Linda wants the students to understand ehm the underlying concepts that dictate why stars fall where they fall on the diagram. And so they need to understand ehm the parameters that are being plotted, how we measure those, and ultimately what is that telling us about stars. Why are.. why are the stars where they are on the diagram. You need to remember that stars aren’t just randomly found all over that diagram. That they’re found in certain regions because that’s how stars work. The stars that are on the main sequence follow this high mass to low mass track and then there’s some that are found in some slightly different places, because the star leaves the main sequence and then ends up in these different zones as it makes its way to the end of its life. (II, 723) In her lesson plan aspects of the elements listed in this quotation surface again. The lesson plan is the topic of the next subsection.
179 4.9.2 Cognitive task I: Lesson plan Linda made an elaborate, multi-page lesson plan in response to the prompts in the cognitive task. Besides the actual road map for the lesson, she included paragraphs on lesson goals, prior knowledge and common student problems. She mentioned how she went about creating the lesson plan, grounding it in her own experience as an instructor. Well I thought about what I actually teach and, you know, I was thinking from the perspective of telling somebody else how to do more or less what I do. So I went back and I looked at the lecture notes that I used and I thought about what I was trying to get across and started drawing up a plan, that matched what I’ve done in the past. (II, 301)
In the lesson plan, Linda cautioned her fictitious colleague, for whom the plan was written, about the nature of the nats102 student and that no knowledge of physics and mathematics can be assumed. She also mentions that chains of logic need to be spelled out and that students have difficulty understanding and reading graphs (LP, 2). She also cautions her colleague to not use magnitudes, as it is likely to confuse the students, but to use physical units instead. She mentions to her colleague to consider the level of the lesson, to either aim it at the best students, or try to go for the “lowest common denominator” (LP, 2). She mentions that she usually aims for the higher performing students, noting that the university’s admission policy is such that “many are allowed to try but only 50% actually graduate” (LP, 2). The lesson should accomplish three things, according to Linda, which are listed here.
180 • •
•
Students should understand how the HR diagram summarizes our knowledge of stellar properties They should understand why stars appear where they do on the diagram o Relate positions on the diagram to Stefan-Boltzman’s eqn and stellar size (see attached in-class exercise that helps students understand the difference between increasing the size of an energy source from increasing its temperature; I use this exercise right after I have actually shown them the HR diagram) o Discuss relative numbers of stars in different regions of the diagram o Ask them to speculate on why 90% of all stars are found on the main sequence – remind them of what they have learned about the Sun’s interior (hydrostatic equilibrium) From an understanding of what types of objects are seen on the HR diagram, they should understand how stars move from one part of the diagram to another, eg. how a star like the Sun will eventually leave the main sequence, become a red giant, and end up in the lower left corner of the HR diagram
She follows the course goals of the lesson with a road map for the sequencing of events in the 75 minute lesson. •
• • • •
Lecture start = stellar properties and how to measure them o stellar distances, parallax, proper motion o luminosity o temperatures from colors and spectra, stellar classification and spectral types, Miss Cannon o sizes, eclipsing binaries , Stefan-Boltzmann and flux o masses, binary star orbits, Kepler’s third law (covered earlier and only referenced here) HR diagram itself o do the in class exercise at this point (provided with the lesson plan) Russell-Vogt theorem Why there is a main sequence Likely end of 75min: How stars move across the HR diagram
The lesson has the structure of a flow chart, which is what Linda would want the students take away from the lesson. In this flow chart idea of the HR diagram, there is input physics, then the diagram itself, and the inferences for stellar evolution taken from the diagram. In the next few paragraphs, two aspects of Linda’s lesson plan are highlighted. The first is her remark to her colleague that students have problems with graphs, the second is the use of the in-class exercise for the HR diagram. Student problems with graphs
181 On several occasions, Linda mentioned that students have difficulty understanding the concept of a graph. Both in her lesson plan (LP, 2) and in the first interview (I, 505) she recounted the story of a student who asked her where the HR diagram could be found in the sky, thinking that the diagram was a picture of a constellation. To help students understand the basic principles of data abstraction and representation, Linda uses simple graphs that students can relate to, using Kepler’s Third Law as an example. They usually don’t have too much problem understanding that planets that are further from the Sun take a lot longer to go around the Sun and then you start showing them where these things fall on a plot. I think that, you know, that starts to click. (II, 369) However, if the underlying principle is not clear, and a graph has to be used to derive that principle, for example inferences about stellar evolution from the HR diagram, students will run into problems (II, 371). In-class exercise The in-class exercise mentioned in the lesson plan is a two-page sheet, adapted from the Lecture-Tutorials for Introductory Astronomy (Prather et al., 2008), and relates the temperature of the star, its size, and its luminosity, in essence the Stefan-Boltzmann law. No mathematics is required to complete the exercise and the analogy used deals with hot plates and cooking of spaghetti. The hot plates have different sizes and different temperatures. The goal is for the students to realize that the time it takes for the pot of spaghetti to boil depends on both the temperature and the size of the hot plate, and that
182 one parameter may be able to compensate for the other. The second part of the exercise recapitulates the first part and relates the time it takes for spaghetti to boil to the rate with which the hot plate transfers energy into it. It is specifically stated that the rate of energy being given off is called luminosity for stars. Students are presented with an HR diagram in which 5 stars are labeled. The students are asked to comment on the relative sizes of pairs of stars and explain their reasoning. According to Linda, students need about 15 minutes to complete the exercise (II, 445), which are then collected and used as a participation grade. In the next class, the exercise gets debriefed. Linda mentioned that she does that by electronically projecting parts of the exercise on the screen and asking leading questions (II, 467). The most common problem encountered is that students have difficulty understanding that the output of a star (the luminosity) is a product of both the size and the temperature, and that if one goes up, the other one must go down to keep the luminosity constant (II, 478). To help students understand this, Linda uses the analogy of a fireplace. You can feel the same amount of heat if you’re standing close to a small fire or farther away from a bigger fire (II, 508)
4.9.3 Cognitive task II and III: Concept map and network map The structure of the lesson plan is also reflected in the concept map Linda made in which she showed how she wanted students to think about the concepts related to the HR diagram and the relationships between those concepts. The concept map is depicted below in Figure 6. Note the arrows on the diagram to indicate directionality.
183
Figure 6: Concept map made by Linda
In her comments, Linda explained how she created the concept map, which she describes as a flow chart (II, 548) I actually went back to both the lecture plan and the lecture notes, and thought about why I had made them in that, that way and thought about how I would link things in this kind of a diagram. But I have to confess that I did this rather quickly, but the idea here was here are all the kind of, you know, ehm there are a lot of inputs, sort of data inputs. That is the early part of the lecture and that feed into the HR diagram. And this whole question of the masses and how that relates to the nuclear physics really doesn’t, you know, you could s..s..po.. it..it’s not
184 traditionally plotted on the HR diagram and it really doesn’t come into play until you get to the stellar evolution part, and of course, our good old friends these laws of physics that control why it is all these parameters end up showing stuff where they show stuff. (II, 534) The flow chart uses the input from observable parameters (parallax, spectra, and apparent brightness) to determine physical properties of the stars, namely their luminosity and temperature, the two main ingredients needed to create an HR diagram. The HR diagram itself then needs to be explained, which can be done through the laws of radiation physics that tie in to both the HR diagram and the theory of stellar evolution. Stellar evolution itself is controlled by the laws of physics, with the mass of the star the dominating parameter driving the physics (the Russell-Vogt theorem Linda mentioned in the lesson plan, see appendix C for more details) as well as the nuclear physics in the core of the star. The mass of the star itself is an observable parameter, if the star happens to be in a binary system. The HR diagram in this flow chart is the center where all the physics comes together.
One has to keep in mind though, that content is only a small part of Linda’s course goals, and of her goals for the HR diagram lesson. Her main goals remain to have students develop an appreciation for science and to help them become more scientifically literate. Linda’s Pathfinder network map showed consistency with her overall stated goals. The main nodes, shown in Figure 7 below, are “appreciation for science” and
185 “scientific literacy”. The measure of internal coherence was 0.49, which is above the threshold of 0.2 to have confidence in the results (Interlink, 2009).
Figure 7: Linda's Pathfinder network map
4.9.4 Common student problems and stereotypical student statements As mentioned explicitly in the lesson plan, one of the bigger problems students have with the material is the concept of a graph, and the ability to correctly interpret a diagram. In her first interview, Linda talked about the student who asked her about the HR constellation, something she also comments on in her lesson plan as a caution for her colleague. In fact, it was this story from the first interview that led to the development of the stereotypical student statement asking about the physical movement of stars in the HR diagram (as if it were a star chart). For this reason, this stereotypical statement is covered here first. The other stereotypical student statements are discussed thereafter, with the
186 exception of the student question on how to study the HR diagram for the test, as the answer to that question was given by Linda in the quotation at the end of section 4.9.1. It should be noted that one other stereotypical student statement is not listed here as well. This is the stereotypical student statement asking about how we know stars at the top right of the HR diagram are actually larger in size than stars on the top. This stereotypical student statement was overlooked in the interview and not asked. Do stars physically move on the HR diagram? Asked, both in the first interview and in the series of stereotypical student statements in the second interview (where she effectively heard her own story, to her amusement), how to respond to such a remark, Linda said she would start by mentioning to the student that stars do not move on the HR diagram. Stars, while on the main sequence, stay at the exact same position where were originally, and that position on the HR diagram is determined by the mass of the star. She mentioned that the idea of moving along the main sequence is a very common misconception students have (II, 695), but did not discuss or explain the concept of a graph in her response to the fictitious student. How can a star live longer if it has less fuel? Responding to the stereotypical student statement about massive stars having to live longer because they have more fuel, Linda responded that it is not an unreasonable common-sense way to look at it, but that massive stars are more gluttonous, “because the number of hydrogen atoms that can collide fast enough goes way up so it uses its fuel faster” (II, 708). Her response was interesting because it started with the
187 acknowledgement of common sense, followed by an eating metaphor that morphed into a technical explanation, rather than an analogy. How does temperature tell you about brightness? In the stereotypical student statement in which a student is confused about how temperature can tell you about brightness, Linda responded by stating that if things are the same size, the hotter it is, the brighter it looks. She then used an analogy of a stove burner and a blacksmith’s forge to illustrate that though you can feel heat, you cannot see it, until the stove burner gets really hot. The hotter something is, the more its constituents are vibrating, and the more photons it can give off. The amount of photons given off is proportional to the temperature to the fourth power (II, 765). Ranking task Asked if her students would be able to do the ranking task, in which four stars are diagonally lined up from the lower left to the upper right of the HR diagram, and students are asked to rank the relative sizes, Linda noted that her students would most likely be able to do that. She mentioned that she would be satisfied if students mentioned in the explanation part of the ranking task that luminosity depends on both temperature and surface area, and that temperature has a much bigger influence. She would not explicitly require students to remember the fourth power dependence of temperature on luminosity (II, 785).
188 4.10 Concluding remarks about the case of Linda In reading through the case study, as well as the raw data, several themes emerged in the case of Linda. In this section, those themes, scientific literacy, in-class exercises, flow chart, and technical explanations are discussed in more detail. Scientific literacy In Linda’s course, the content is rather varied. Rather than talking solely about astronomy, the cd-rom she uses includes some of the history of the sciences, and brings in different disciplines. The astronomy is used as a vehicle to talk about science, and the main goal of the course is to have students develop an appreciation of science, and a feel for what it is scientists do on a daily basis. The appreciation for science is both a goal in its own right, and a motivational purpose for the other course goal of scientific literacy, and the development of an understanding of what it means to make a scientific argument. When students have an appreciation for science, they are more likely to be willing to engage in science and become scientifically literate. Linda has a special science literacy project in the class, in collaboration with the science library on campus, to help students learn how to gather and evaluate scientific information. The focus of the course is much more on “how we know” and the process of science, than on content. The lesson plan, concept map, and Pathfinder network map are all consistent with these goals. In-class exercises Linda uses the in-class exercises for two distinct purposes. First, the in-class exercises serve as participation credit, encouraging students to come to class, as the student do not know at the beginning of the course how many in-class exercises there will
189 be, but they add 15 points each to the total number of points available in the course. The second way in which the in-class exercises are used is as a check to see if students have understood the content. Linda scans the exercises for trends and discusses commonly made mistakes the next class period. The different use of the Lecture-Tutorials for Introductory Astronomy, which is something the authors strongly advocate against as they favor a particular (content focused) implementation of the tutorials (see Brogt (2007c) for a theoretical background of this implementation), Linda uses the in-class exercises in her own way to fit her needs and course goals. This is consistent with the results of Dokter (2008) who also found that instructors use the tutorials to suit their own individual needs and course goals. Flow chart Linda sees, and would like the students to think about, the HR diagram as part of a flow chart containing input physics, the HR diagram itself, and explanations for the HR diagram which come from radiation physics and stellar evolution. The focus of the HR diagram lesson is not so much on the content, but more on how the physics all ties together in the diagram. This became most obvious in one of the stated goals for the lesson, namely that students should “understand why stars appear where they do on the diagram” (LP, 3). Technical explanations In her responses to the stereotypical student statements, Linda used several rather technical explanations, which came as a mild surprise to me, as I had expected her (based on the interviews with other participants) to use analogies or stories instead. For
190 example, in the stereotypical student statement where a student thinks that a star twice as massive should live twice as long, as it has twice the amount of fuel available, Linda responded with mentioning collisions between hydrogen atoms. In her response to the student thinking that stars move across the HR diagram, she did not mention the concept of a graph to the student, while she had done so extensively in both her first interview and the lesson plan. It is not clear why this happened, though it may have had to do with the interaction between Linda and the researcher, making Linda respond to me as a fellow astronomer, rather than responding as if a student had asked the question or made the statement.
4.11 The case of Paul As described in the participant profile in chapter 3, Paul is an associate astronomer, a rank equivalent to associate professor, in the department with a rather nontraditional portfolio. Rather than working primarily in research, Paul’s job responsibilities revolve around teaching the general education courses, public outreach for the department, and consulting with other faculty about teaching the general education courses and the use of technology in the classroom. Paul had considerable teaching experience teaching prior to becoming part of the faculty, won the Provost General Education Teaching award, and teaches at least one class a semester, in contrast to the other faculty, who typically teach three semesters out of every four. Paul’s case study differs from the template case study in a number of ways. First, the sections on general course goals and general course mechanics are integrated, as
191 Paul’s teaching strategy in the classroom is to a high degree integrated with his course goals. The second difference from the template is the presence of a subsection on technology, as the use of technology features very prominently in Paul’s classroom.
4.11.1 Course mechanics and course goals for nats102 Inspired by Carl Sagan, especially by Sagan’s Cosmos television series, Paul tries to make each class period into a TV episode (I, 239, 268), a show with content. He describes his teaching style as theatrical, in your face and bombastic (I, 236). His strategy is to grab the attention of the students and “make them love it” (I, 724), so that the students want to come to class and “can’t wait to see the next installment” (I, 249). His showmanship is used as a hook to get students to attend every class session. Paul considers a high class attendance, on the order of 80 percent, one of his goals for the class (I, 692), but this only is to serve a higher purpose. Paul reasons that if students don’t come to class, the chances of them failing the course increase (I, 711). Besides using showmanship, Paul also weighs attendance into the course grade, at the 6 percent level (Syl, 2), to further encourage students to come to class. Paul mentions to the students up front that the class is challenging, but that he will make the material accessible to them, provided that they are willing to try (I, 288, 352, 742). Speaking about the weights of the different aspects of the course into the final course grade, Paul mentions that multiple-choice midterms and the cumulative final have decreased in importance over the years, now making up 42 percent of the final grade, down from two-thirds of the grade when Paul started teaching (Syl, 2; I, 598). The online
192 system Mastering Astronomy, (lab) reports, and the previously mentioned attendance make up the rest of the grade. Paul deemphasized the weight of the traditional multiplechoice tests in the final grade so that students who are not good test takers are not penalized as much (I, 600). He grades on an absolute scale, meaning that students are not in competition with each other. Besides wanting high attendance in his classes, Paul’s course goals focus on scientific literacy and problem solving skills (I, 704) to the point where students can reason about a problem and are not afraid to hear someone talk about science without being scared of it (I, 709). For Paul, the favorite moments in class are when he sees “the light bulb going off over their head” (I, 764). Another favorite of his is when students reason through a problem themselves and go “oh my god, I understand that”, when they thought they would not be able to do it. For Paul, that makes teaching worthwhile (I, 768). Related to this, Paul also wants to make students aware of what science is, the role of science in society, and what it means to be scientific (I, 624). During his teaching, Paul wanders around the room to look students in the eye so that they “realize that I’m talking to them, not talking over them” (I, 309). Even though his classes have an enrollment of around 150, Paul makes a big effort to learn all his students’ names. Learning student names is also the most important piece of advice he would give a colleague, as it impresses the students enormously. It also shows the students in a very tangible way that the class is important to the instructor and that the instructor takes his duties seriously (II,1016). Rhetorically, he asked: “how can you get them to take the class seriously if you don’t take the class seriously?” (II, 1020)
193 Selection of course topics Paul’s selection of topics is partly guided by the textbook, as he does not want to cover material that is not in the book, because the students paid quite a lot of money for it (II, 164). His selection of topics stresses the scientific method, the nature of science and basic physics (II, 126). According to Paul, all content in a nats102 class is meant to illustrate the scientific method, which is the main goal of the general education science courses (II, 118). Within that framework, he picks topics based on what he is good at, what is currently in the news, and what he is interested in (II, 153). This means that Paul, an x-ray astronomer by training, usually places less emphasis on planets and planetary systems. He did spend more time on planets when they became a news topic and cites examples about the status of Pluto as a planet and the Phoenix Mars Lander, a Mars mission run by the University of Arizona. He talks about those event to connect the material to the students, as they hear about and see these topics in the news (II, 140), in alignment with his goal to show the role of science in society (I, 624). To illustrate the scientific method, he uses the history of science to show how the method was used and misused in the past, and to create a human connection to the material (II, 128). Paul does not cover more advanced topics like relativity and quantum mechanics, as he judges those to be too involved for the nats102 population and anticipates it would not connect with the students (II, 148). However, Paul considers concepts like gravity, the atom, and light to be central in an introductory astronomy course (II, 123) to help the students understand why and how scientists make assertions about the universe. It is also meant to expose students to physics, which he calls “the
194 dirty little secret” of nats102 (II, 176). The physics department does not have introductory courses, as students would not take them “because it says physics in the title” (II, 178). However, students are getting their physics in the astronomy class instead, and four weeks out of the 16 week semester are spent on physics (I, 666). Change in teaching approach In his teaching approach, Paul is driven by data on what works and what does not work. He started out with “trial and error” (I, 410) and visited workshops and seminars later. The evidence presented to him led him to change his teaching style. He simply states “I’m a scientist” (I, 447), indicating that he follows where the data leads. An important moment came when Paul realized that he didn’t have to cover everything (I, 431, 452) in an introductory astronomy course, which opened the way for doing different things during class time, and steer away from a pure lecture format, because ”lecture is the fastest way to get the most amount of information out, into the ether, right [laugh], which is usually where it stays” (I, 434). Paul uses quite a bit of technology, which is discussed in the next subsection, as an integral part of his course construction. He states that he is very happy with how the class is structured these days, and would not change much if given more resources, save maybe employ more teaching assistants to run recitation or break-out sessions (I, 1219). Rather than using only one teaching assistant, as is the norm in the department, Paul uses two teaching assistants in nats102 (and none in his other class, to even out). The teaching assistants are in charge of the breakout sessions every Friday. He does this primarily to give the teaching assistants teaching experience in the mechanics of running
195 a classroom (I, 514) and to develop rapport with a section of the class they are responsible for (I, 491). In his mind, teaching assistants need the experience teaching, because they may become faculty members one day, and having been exposed to teaching and learner-centered techniques may give them an edge in the job market (I, 1269). In the modern world, where the chalk and black board have all but retired, technology in teaching becomes more and more important, and students expect the use of technology in class. Part of Paul’s job is pioneering educational technology for the department, so that his colleagues do not have to reinvent the wheel when they want to use technology in the classroom, but can go to Paul for advice. Naturally, technology features prominently in Paul’s own classroom, which is highlighted in the next subsection.
4.11.2 Technology in the classroom In his classes, Paul uses many types of educational technology, including computer animations, demonstrations, videos, and responders, to get the students engaged. The piece of technology he uses every day in class is the electronic responder device. Responders are little pocket calculator size devices that students buy for the class that have several number and letter buttons on them. Pushing a button sends a radio signal to the receiver which is attached to Paul’s laptop via the USB port. By using responders, Paul can get instant feedback from the classroom. He uses these responders for three purposes. The first purpose is to take attendance in class (I, 852). A student is automatically counted absent if they are either absent or have not brought their responder
196 to class. Since participation is part of the course grade (Syl, 2) students learn quickly to bring the responders to class every day (I, 855). Paul’s second purpose for using responders in the classroom is to have students make predictions about what is going to happen in a demonstration (I, 271). The third, and arguably most important purpose of using responders in the classroom is to have students vote on think-pair-share questions (I, 272; II, 48), which Paul refers to as concept questions, and which are discussed in some more detail below. Think-pair-share questions are one of the techniques of peer instruction, where students teach students. In physics, this method was pioneered by Eric Mazur from Harvard university in his book Peer Instruction (Mazur, 1997). In Paul’s classroom, think-pair-share questions are implemented in the following way. On a PowerPoint slide, Paul poses a multiple-choice question with several answer options. Students individually answer the question using the responders. Paul then looks at the distribution of answers and depending on how many students have the answer correct (typically between 30 and 80 percent), he directs them discuss the question and then vote again (II, 392). Thinkpair-share questions have been documented in the literature to be successful in moving the class in general to the right answer. Paul uses these questions at key points in the lecture (I, 48), which he defines as points where he wants to proceed to another topic, which may or may not build on previous material, and wants to make sure that all the students are on the same page (II, 65). Paul then discusses and debriefs the question so that all students know the right answer. In the subsection on the lesson plan Paul made
197 for the HR diagram, some of the technicalities of using think-pair-share question are discussed further. Another piece of technology Paul uses extensively in this class, primarily for homework purposes is Mastering Astronomy. Mastering Astronomy is an online system developed by Pearson Education with computer exercises in astronomy, about which he is very enthusiastic. Exercises can be matching games, ranking tasks, and other problems that require some virtual manipulation of objects on the computer. Mastering Astronomy comes in a bundle with the textbook Paul uses for the class, and students get a login code for the system when they buy the book. As an aside, the textbook for the class comes with an instructor’s guide that includes a series of ready-to-use PowerPoint presentations for use in the classroom. An interesting detail in this respect is that Paul was contracted a few years ago by the publishing company to write those PowerPoint presentations (I, 820). The Mastering Astronomy exercises concerning the HR diagram are briefly discussed in section 4.12.1. A third piece of technology Paul uses in his classroom are video clips from The Universe the Infinite Frontier series (Stone, 1994), which features astronomers talking about topics in astronomy. Paul uses these videos to reinforce what the students have just heard him talk about in lecture. In class, he refers to these videos as the “talking heads” videos (II, 498), because of the most commonly used shot in the videos. It gives the students a moment to relax in class, not needing to take notes (as the material was just covered in class), and hear the material in different words from a different astronomer. According to Paul, the best result he can get from a video snippet like this is when
198 students tell him it was a waste of time, because it was so obvious. To Paul, that indicates that the students understood the material (II, 516). Another piece of technology features during the multiple-choice tests Paul gives in his class. Paul uses what he calls “slide ideas”, a concept he adopted from his former mentor (I, 319). At a certain point in the exam all students have to answer about six questions at the same time, which he projects on the screen. These questions can involve either animations or pictures. Paul uses these slide ideas for two reasons. First, he uses them as a motivational tool for the students, because “astronomy is a colorful subject, so why should I give them an exam that is devoid of color?” (I, 331) and second, he uses them as a pedagogical tool, because using slide ideas expand the number of questions he can ask to better probe students’ understanding (I, 336). Based on the examples in this subsection, it is clear that Paul tries to use the technology to further his students’ learning. In the next section, Paul’s classroom and his students are discussed.
4.11.3 Students in the course and classroom environment Paul mentions that the class is very varied, with students from a lot of different backgrounds (I, 649). He also uses the phrase “captive audience” (I, 394) to describe the students, as students are required by university policy to take general education credits in the natural sciences, whether they want to or not. Paul sees it as his job to generate interest in the subject matter (I, 348), and to create a classroom environment in which the majority of students can learn (I, 379). His showmanship which was mentioned earlier,
199 meant to turn the class into an event students want to come to, is his way to try and generate interest in the subject matter. In order to create a classroom environment conducive to student learning, Paul is strict when it comes to disruptive behavior in the class and does his utmost to prevent cheating and deals “harshly” with people who are academically dishonest (I, 285, 365). Academic dishonesty is combated using technology and Paul uses turnitin.com, a website that checks submitted papers for plagiarism, for which Paul is also the college coordinator (I, 179), to discourage students from even trying to plagiarize. Astronomy in its core is physical and mathematical in nature, and in Paul’s nats102 course about a quarter of the class is devoted to physics (I, 666). When dealing with the physics aspect of the course, Paul tries to show the students that to really understand astronomy, one needs to know the physics behind it. He does not have his students perform mathematical manipulations, but instead presents the material in a more qualitative manner. Paul does this to have students give the material a chance, rather than that they default to the position in which they “automatically close their minds to the fact that this is science, or this is physics, this is math, this is hard, I can’t understand it” (I, 678). Though the mathematics may not be part of Paul’s nats102 course, in his courses for majors he would take a different approach. This is discussed in the next subsection.
4.11.4 The difference between teaching nats102 and astro250 Paul does not expect his nats102 students to use mathematics as part of the course. But while Paul’s nats102 students are not expected to do the mathematical
200 aspects of physics, the same cannot be said of science majors taking an introductory course in astronomy, which is a separate course called astr250. If Paul were to teach this introductory class for majors, he would teach it quite differently than the nats102 class. As the students in astro250 “all signed up for this, they’ve all eh indicated a willingness that they wanna major in astronomy and in physics.” (II, 268) Paul would take out some of his theatrical elements from the classroom, as he assumes that he does not have to motivate the students in astro250 to the extent that he has to motivate nats102 students. Instead, he would focus more on the mathematical underpinnings of the physics. Paul summarizes the differences in teaching astr250 and nats102 succinctly as “more math and less showmanship” (II, 278).
4.11.5. Teaching nats102 in the ideal world Paul indicates that he does not feel constrained by resources and is very content with the way the course is currently going, and would not make major changes to the existing format (I, 1265). He would add more teaching assistants to each class and have them teach break-out sessions, to increase the teaching assistants’ participation in teaching the course. In addition, he would have those break-out sessions be taught in kaleidoscope rooms that are well equipped with educational technology (I, 1279). Other than those two things, he would keep the format of the nats102 course the way that it is.
201 4.12 Paul’s approach to teaching the HR diagram 4.12.1 Goals for and approach to teaching the HR diagram For Paul, the HR diagram lesson is an example of the course goal of showing the students how scientists know things, tying in to scientific literacy and science as a process. Students learn the difference between measurable, and calculated parameters of stars, and the inferences that can be made (II, 566). The lesson builds upon previous lessons on the properties of stars, distances, parallaxes, brightnesses and luminosities. Immediately following HR diagram are lessons about binary stars, how masses are obtained from measurements of those systems, and where stars of different mass fall on the HR diagram, which leads into stellar evolution (I, 937). In the HR diagram lesson itself, Paul follows the structure laid out in the book, something he would recommend to his colleague in the lesson plan task as well. The sequence is basically: properties of stars, measuring surface temperatures of stars, measuring luminosities, and comparing the two (II, 288). Paul follows this sequence by going back to the concept of luminosity and how the brightness depends on the distance to the star via the inverse square law. After talking about temperature and spectral class, Paul plots luminosity and temperature against one another and talks about the importance of noticing that the stars are not scattered all over the diagram, but instead fall into distinct places (I, 955). The textbook shows a colored HR diagram where the colors and brightnesses are indicated, which is useful, according to Paul (I, 1003). He ends with concept questions about temperature, luminosity, and size, for example: if two stars have the same spectral type, but one is
202 brighter than the other, what can you say about their sizes? (I, 971). Some of the concept questions are discussed in more detail in section 4.9.2, where the lesson plan task is discussed. Paul assigns his students homework about the HR diagram on the online system Mastering Astronomy to reinforce the concepts as well (I, 963). Mastering Astronomy, and the HR diagram exercise, is discussed in more detail below. Mastering Astronomy The Mastering Astronomy exercise is one of Paul’s favorite ways to help students understand the HR diagram. It is where he would refer students for additional practice when they encounter problems, for example the one mentioned in the stereotypical misconception where the student thinks the HR diagram is a picture, rather than a graph. (II, 817). Paul explained the general setup of a tutorial, which is paraphrased here. Each Mastering Astronomy tutorial is set up with stated learning goals, followed by a predictive question encompassing the central concept of the tutorial. Students answer the question and write down why they chose that answer. After that, there is some expository information, illustrated with an animation or figure. The information is followed by a tool, in which the students can alter parameters themselves, rearrange sequences, and answer questions based on what they see changing, after which students answer multiple choice questions about the concept. Each distractor in the multiple choice question is chosen with a particular student misconception in mind, giving feedback in the form of a hint pertaining to that misconception when that distractor is chosen. After this, students are redirected back to their predictive question and are asked
203 if they want to change their answer or reasoning, followed by several additional exercises (I, 1061). Paul explains that the Mastering Astronomy exercise about the HR diagram shows an animation in which a star evolves and the students can follow its path on the HR diagram. In a separate panel, students see a view of the outside of the star with a cutaway to the core. Students can see the star changing size and color on the outside, and observe which fusion reactions are going on in the core as the star moves along the HR diagram in its evolution (II, 798). According to Paul, this helps students understand that the HR diagram is a road map, yet not an actual map of positions of stars in the sky. Paul provides road maps as well, in the form of a detailed lesson plan. This lesson plan and its intricate details, are discussed in the next subsection.
4.12.2 Cognitive task I: Lesson plan Paul produces a comprehensive lesson plan for his fictitious colleague, including PowerPoint slides the colleague can use. In the interview, he elaborated extensively on the points raised in the plan. The most important point from the lesson that the students should take away is that certain properties of stars are interrelated (II, 464). Paul uses mini-lectures and think-pair-share concept questions to get the message across (II, 296, 477). The lesson plan Paul provides is given below.
1. For a typical intro astronomy course, e.g. NATS 102, I would give this lesson as the second class of the 9th week of a 16-week semester.
204 2. If I were teaching this course on the Tue/Thu schedule, I would not spend an entire 75-minute class on the HR-Diagram. I would also cover binary stars, measuring stellar mass, and the Mass-Luminosity Relation. 3. I would advise the new instructor to keep order in class, play to the class, show enthusiasm for the subject, and play music with a stars theme as students walk into class to set the mood. 4. I would encourage the instructor to use responder technology for interactive learning; use of colored paper a la Ed Prather would also suffice. 5. Think-pair-share questions: Students answer first in silence via responders with 45 sec time limit. Then, mute screen and view results. If > 80% have correct answer, move on to next element of lesson plan. If < 80% but > 30% have correct answer, allow students to discuss the question amongst themselves for about 3 minutes. Address the class as follows: “If you are confident you gave the correct answer, and then convince your classmates that you are correct. If you are not sure, listen to what your classmates are saying and decide if it makes more sense that what you were thinking.” Then poll the students again with the second polling slide, this time revealing the results and the correct answer. If < 30% have the correct answer on the first poll, then skip the discussion and prepare to alter lesson plan to revisit those concepts which the students do not comprehend. Perhaps you could call on some students to explain their reasons for their response. 5 min 15 min 10 min 5 min 10 min 5 min 5 min 5 min 15 min
PLAN announcements and attendance (if using responders) mini-lecture: spectral types (PPT Slides 1-5) mini-lecture: construction of HR-Diagram (PPT Slides 6-8) think-pair-share question: spectral type is temperature (PPT Slides 9-10) mini-lecture: stellar radii and luminosity classes (PPT Slides 11-14) think-pair-share question: stellar radius (PPT Slides 15-16) summary of Main Sequence star characteristics (PPT Slide 17) video clip about HR Diagram from the Universe: The Infinite Frontier series think-pair-share questions: HR-Diagram review (PPT Slides 18-31)
Music in class In his own lectures, Paul plays music before class while he is setting up and the students come in, and advices his colleague to do the same. The music serves a dual purpose. First, it adds to the show element that is central to Paul’s teaching and second, he chooses music that hints at the topic of the day to prime the students for what is coming. He cites an example of playing the Beatles’ “Here comes the Sun” when the Sun is the topic of the day. (II, 321). Mini-lectures back-to-back
205 Paul has two mini-lectures back-to-back in his plan. When asked about these, he explains that the two deal with distinct pieces of information, so in his mind they are separate. Students need to have an understanding of the spectral types of stars before one can move on to the construction of the HR diagram (II, 347). Think-pair-share In the HR diagram lesson, there are various instances where he would advice his colleague to use think-pair-share questions, or concept questions as Paul tends to call them, as well. In Paul’s lesson, a think-pair-share question is a multiple-choice question in the PowerPoint presentation projected on the screen. If responders are used in his colleague’s classroom, students can vote using those, and the software to collect and display votes interfaces with the PowerPoint software. If the technology is not available, colored cards marked A B C D will do as well. After the students vote (individually) the results can be seen electronically (or by a quick glance to the distribution of colors in the classroom). Depending on how many students have the answer right the first time, classroom discussion can follow. Paul mentioned that if the class is between 30 to 80 percent correct, he will have them discuss. Otherwise there are too few people to make the discussion worthwhile (“the blind leading the blind”, as Paul coins it), or so many people having it right that discussion is pointless. Note that Paul advises his colleague to mute the screen, so that the students cannot see the results of the first round of voting. Though it is not mentioned in the interview, from earlier conversations with Paul the reasoning for doing this had become clear. If students were to see the result of the vote, they would most likely be drawn toward the answer that has the most people supporting it
206 for the second round of voting, rather than actively thinking and engaging in discussion. During student discussion, Paul encourages his colleague to wander around the classroom, to listen in on conversations, push students to participate, and occasionally interject with a question to get students back on track (II, 415). After discussion, students vote a second time (II, 368, 392, 415). In the lesson plan, Paul reserves considerable time for think-pair-share questions at the end of his lesson plan. He does this to serve as a sort of a mini-quiz in preparation for the exam, but also because the students will be required to interpret different HR diagrams. As many students struggle at first with the material and with the concept of a graph, he wants to give them ample opportunity to discuss it among themselves as part of the think-pair-share structure (II, 442).
Paul mentions that this lesson plan helps meeting his course goal for scientific literacy, in helping the students understand the differences between measureable or observable quantities, and the calculated or derived quantities. He notes that the intricate relations between the concepts in the HR diagram allow for a range of problem-solving activities (II, 566). The intricate relations are shown graphically in the concept map, which is discussed in the next subsection.
4.12.3 Cognitive task II and III: Concept map and Pathfinder network map Paul’s concept map, illustrated below in Figure 8, gives an overview of how he would like the students to think about the HR diagram after instruction. In the interview, Paul made one distinction. He teaches both nats102 and astro203, a class completely
207 devoted to stars and stellar astronomy, in which he spends more time and teaches the HR diagram in more detail. In the concept map below, he does not expect a nats102 student to know all aspects, especially the more advanced concepts related to more detailed physics on the top and the right of the concept map, like surface gravity, core temperatures, mass, and fusion rates (II, 652). Those concepts are reserved for his astro203 students. Paul talks about the concept map as a flow chart, where specific variables are needed to proceed to the next level. When asked how he went about creating the concept map, Paul stated that he started off with the two variables that are actually plotted, the surface temperature and the luminosity, which is placed in the center. As luminosity not only depends on temperature, but also on radius, that variable is placed near the center as well. Next, Paul proceeded to distinguish between observed and inferred parameters. In a diagram he drew on his whiteboard, distance, apparent brightness, spectral type, and color were originally marked in green, to indicate that these were observed parameters (I, 592). Distance and apparent brightness are needed to calculate the luminosity, and the surface temperature determines spectral type or color, which are equivalent (II, 611). Paul also talked about luminosity class, and expect the students to know that that is simply a definition based on certain values of temperature and luminosity II, 616). How luminosity class is determined is not something he would expect his nats102 students to know (II, 619). The right hand side of the diagram is more for the astro203 students. For nats102, Paul’s bottom line is that there is a complex interrelationship between the
208 variables in the HR diagram, and that the main sequence is a special case where stars are relatively straightforward (II, 632).
Figure 8: Concept map made by Paul
Paul’s Pathfinder network map is presented in Figure 9 below. The measure for the internal coherence of the map was 0.49, which is above the threshold of 0.2 to have confidence in the results (Interlink, 2009). As can be seen in the map, “student centered” forms the core node in the map. Paul mentioned that he sees student-centeredness as central to his teaching, and he was thus not surprised that it showed up in the map as a central node. The other interesting thing in the network map that Paul briefly commented on is the fact that “teaching facts” is quite isolated at the bottom left. He commented
209 that, though he does not employ the strategy in nats102, he does allow his advanced students in astro203 to make a crib sheet for the exams, on which they can write whatever they want. It forces the students to organize and prioritize the materials and reinforces the idea that conceptual learning is at the heart of the course, rather than memorizing facts (I, 361; II, 750).
Figure 9: Paul's Pathfinder network map
4.12.4 Common student problems and stereotypical student statements Paul addressed several student problems he encounters about the HR diagram. One of them is the confusion between size and mass of a star. According to Paul, this is because students do not really think about the concept of density (II, 550) or the concept of mass, preferring to use weight instead (which is valid as long as everyone is in the same gravitational field, like the Earth’s). Paul tries to circumvent this misconception by
210 carefully using the words “big” or “large”, using them only to refer to size. When talking about mass and comparing masses of stars, he uses “more massive” or “less massive” (II, 530). Besides the students’ confusion about mass and size, and the use of words like “big” and “large”, Paul encounters other problems that have their root in the difference between normal English and astronomy jargon. For example, another student misunderstanding that Paul occasionally deals with has to do with nomenclature of stars. In astronomy, main sequence stars are commonly called “dwarf”. Depending on their spectral type, they have a color. So a star at the far right of the HR diagram on the main sequence would be called a “red dwarf”, because it is a red main sequence star. Conversely, the main sequence stars at the top left of the HR diagram are called “blue dwarfs”, again because of their color. Students occasionally have the tendency to call certain main sequence stars in the middle (A type stars) “white dwarfs”, which is in fact the name for a different type of object (II, 962). Although he encounters this misunderstanding more in his astro203 class about stars, he has seen it in nats102 as well (II, 979). Another case where the difference between normal English and astronomy jargon surfaces, is in the discussion about the nuclear fusion of hydrogen. In astronomer jargon, this process is referred to as “burning” hydrogen. If “burning” is used in class however, it may lead students to believe that hydrogen fusion is a chemical, rather than a nuclear reaction. Careful phrasing is thus important to not introduce this misunderstanding. Although the videos Paul shows (the “talking heads”) occasionally make this slip of the
211 tongue, Paul himself tries to consistently stick to the phrase “fusion”, as to not confuse the students (II, 986).
Besides choosing his own words carefully to avoid confusion between regular English and astronomy jargon, Paul uses another element of the language arts in his responses to the stereotypical student statements, namely the analogy. In his teaching of the HR diagram, Paul uses analogies to make the concepts clear to the students. These analogies showed up when Paul was asked to respond to the stereotypical student statements, in which commonly held misconceptions were laid out. These stereotypical student statements are discussed below, followed by the two stereotypical student statements in which Paul did not use an analogy. How can a star live longer if it has less fuel? Confronting the student misconception that if a star is twice as massive, it should live twice as long, because it has twice the fuel, Paul uses an analogy of gas tanks, comparing an RV with a Prius. The RV has a bigger gas tank, but has to fill up much more frequently than a Prius does. It is not the size of the tank that matters, but how quickly the fuel is consumed. Massive stars have bigger gas tanks, but they also use up their fuel much more quickly. (II, 823) How do you know a star is big? Paul’s most elaborate response comes when dealing with the stereotypical student statement in which a student asks about the top left and top right of the HR diagram, and how we know that the stars at the top right are actually bigger. He would first talk about
212 the star Betelgeuse (the left shoulder in the constellation Orion), the diameter of which has actually been measured (II, 839). He would then use a poster obtained from the publisher of the book, showing a large HR diagram in which Betelgeuse is marked, as well as Barnard’s star, a star of the same spectral type (and hence temperature). Yet Barnard’s star is much less luminous than Betelgeuse, and the only way that can happen is if Betelgeuse is much bigger than Barnard’s star. To illustrate this further, Paul uses an analogy with light bulbs. Comparing a 300 Watt to a 60 Watt lightbulb, the students readily agree that they are both the same size, yet the 300 Watt bulb gives off more energy, owing to the fact that the filament gets hotter. Then Paul talks about bringing a thousand 60 Watt light bulbs to compare to the one 300 Watt light bulb. Students will then agree that the 1000 light bulbs will give off more light than the sole 300 Watt bulb, illustrating that there is more to luminosity than simply temperature, allowing them to understand that if the 300 Watt bulb were to be replaced with a 60 Watt light bulb (to even the temperatures out) the sheer size of the combined 1000 bulbs will be much more luminous, illustrating that if you have two stars of the same temperature, but one is more luminous, it has to be much bigger (II, 851). How does temperature tell you about brightness? The last example for which Paul used analogies was when he was asked to respond to the stereotypical student statement in which the student is confused about how temperature can tell you about brightness. Paul uses the analogy of hot plates, which is actually demonstrated in his “talking heads” video. Increasing the amount of current sent through the hot pad, and filming it with an infrared camera, students can see that if the
213 amount of current increases (a measure for temperature) that the hot pad starts to get brighter and brighter, until eventually it becomes visibly red and even white or blue. So the hotter it gets, the brighter it gets and the bluer it gets, which is also true for stars (II, 884).
In the previous three stereotypical student statements Paul used analogies to help his students understand the material. In two other stereotypical student statements, Paul used the Mastering Astronomy homework exercise that he has his students do. These two are discussed next. How should I study the HR diagram for the test? Paul would respond to this stereotypical student statement by first asking the student whether he or she had done the Mastering Astronomy exercises about the HR diagram. If they have, they should redo it for practice. Paul thinks that the exercises are very well done and he uses material from the Mastering Astronomy tutorials in his exams. He would advice the student to do the exercises, and in addition to study the textbook. Should the student have further questions, then he or she should come to office hours where Paul can work one-on-one with the student (II, 782). Do stars physically move on the HR diagram? In answering this stereotypical student statement, Paul would start by mentioning that the HR diagram is not a star chart, but that it instead represents properties of stars and serves as a roadmap for stellar evolution. He would then refer the student back to the Mastering Astronomy exercises (II, 798) as in the applet, students can manipulate
214 properties of stars and see the star “move” in the diagram, reinforcing that movement in the diagram is not physical movement in the sky, but a change in stellar properties. Ranking task The last in the series of stereotypical student statements is not so much a statement, as a question of whether students in Paul’s class would be able to correctly solve a ranking task concerning the relative surface areas of four stars, and justify their choice. Paul mentions that his students would probably rank the order correctly, because they had learned from the diagram that the white dwarfs were in the bottom left, and the giants in the top right. He doubts that students would think in terms of the StefanBoltzmann relation between size, temperature, and luminosity, and reason the problem out from first principles (II, 918).
4.13 Concluding remarks about the case of Paul Reading over the case study of Paul, as well as the raw data, several themes emerge. In this section, these emerging themes, showman, high tech, road map, and learner-centered are discussed in more detail. Showman Paul refers to his teaching style as theatrical, and he wants to make every class an event so that students will come to class. Classroom attendance in Paul’s mind is important for student success, and the showman aspect of his teaching serves as a hook for this population of students. The showmanship thus serves a motivational purpose, and Paul mentioned that in the astro250 class, there would be less of it, as he would
215 assume that the majors don’t have to be motivated as much as the non-science majors. Class attendance is also encouraged by course policy, which makes attendance a part of the grade, and the use of responders to take attendance. High tech Part of Paul’s job in the astronomy department is to serve as a go-to person for teaching related matters and educational technology. As a result, Paul himself uses a wide array of technology in the classroom. Important to note is that his use of technology serves a clear pedagogical purpose. The most noticeable feature is the use of the responder devices, both for taking class attendance (encouraging students to come to class, as it is included in the course grade) and for answering think-pair-share or other types of questions in class (as a check to see if students have understood, and as a means to initiate peer instruction). The responders are thus used both as a motivational and assessment tool. Paul also places great value in the online system Mastering Astronomy, which his students have access to through the textbook Paul uses for the class. Road map Paul sees the HR diagram as a road map to stellar evolution, where the physics of the properties of stars, both observable and inferred, come together to provide information of how stars change. To help make this visible to his students, Paul once again uses the technology of Mastering Astronomy. With respect to the HR diagram, Mastering Astronomy exercises, which are discussed in more detail in section 4.12.1, allow students to manipulate stellar parameters to show and reinforce not only how stellar properties change and influence each other, but also that the HR diagram is a road map
216 for stellar evolution. Paul mentions in passing that students have problems interpreting graphs, and he sees the Mastering Astronomy exercises on the HR diagram as a tool to help students understand a graph better, as they can see the change in the graph as a result of their manipulation of parameters. Learner-centered teaching One of the most eye catching elements of Paul’s classroom is the learner-centered climate. In fact, a section on his syllabus is devoted to learner-centered teaching, explaining to the students how the class is set up and what the expectations are (Syl, 3). During the interviews, Paul refers to the research underpinning learner-centered education. He mentioned that the evidence from the educational research convinced him that learner-centered education was more effective than lecture-based instruction. Paul’s classroom is carefully designed to facilitate student learning. His classroom policies are meant to create an environment in which students are encouraged to learn, and are presented with the course material in a multitude of ways, by demonstrations, computer animations, videos, and lecture. He paces around the classroom gives a sense that the classroom is his, and that there is no “back of the room” where students can zone out. He changes teaching mode regularly and tries to do something different every 15 to 20 minutes, to keep the students alert. As mentioned above, Paul uses the responder devices for think-pair-share questions, in which an important part is peer instruction. This gets students talking to one another and serves, besides the benefits for student learning, as a means to do something different in class.
217 4.14 The case of William William is a full astronomer in the department, which is a position equivalent to a full professor. William works primarily in stellar astronomy and as such, has extensive experience with using the HR diagram for professional research and a deep knowledge of the details and the intricacies of the physics that determine the HR diagram. The case study of William follows the general format of the case study as outlined in the introduction of this chapter. However, in section 4.15.1 the reader will encounter an interesting pedagogical technique that is unique to William; the pretend trip, a narrative journey that he uses in his advanced class about stars (astro203) to talk about different concepts and their interdependencies. In the first part of this case study, the general course goals are discussed prior to the course mechanics, as in William’s case, the goals determine the mechanics of the course to a large degree.
4.14.1 General course goals for nats102 William expressed two different sets of goals for the nats102 classroom. The first of these goals is to “show that there’s a method to the madness of science” and to lead the students through the arguments that lead scientists to understand that stars and the universe change. His second goal relates to content, where Williams expressed that he would expect students to know “a list of hundred or two hundred ideas” (I, 335). The reason for covering this many topics is partly because students expect certain topics, like the beauty of the night sky, the constellations, and the cause of the seasons (I, 422). Yet those topics are not likely to be covered in what students would hear later in life when
218 reading a newspaper article on astronomy, which is more likely to cover topics in modern astrophysics, like advances in cosmology (I, 475; II, 109). Therefore, William wants to cover both the historical parts of astronomy and the more modern astrophysical aspects (I, 430), which he thinks deserve the majority of the time, as the course is a “college level science class for smart people” (I, 445), though he recognizes that there are other topics that get the students excited. As a result, William tends to cover a wide variety of topics, to the depth that he thinks a nats102 student should comprehend them (I, 162, 458), so that they will be able to understand a newspaper story in the future (I, 502). Over the years, he has found that he covers the material now in less depth than he used to, as he realized that he could not cover everything he wanted to a certain depth in a 15 week semester (I, 351). The way that William tries to achieve his course goals for the nats102 class is the topic of the next subsection.
4.14.2 General course mechanics for nats102 In covering all the material he wants, William describes his course as “feeding from the fire hose” for students (I, 462), indicating a rapid succession of topics. In his selection of topics to cover in the nats102 course, William is guided in part by the textbook he is using. According to William, each chapter in the textbook “has a factor of two too much material” (II, 93). However, he notes that students tend to get upset when they have bought a book for quite some money, and not every topic or chapter from the book is used in class (II, 108), which William says is partly responsible in forcing him to
219 set a high pace (II, 102). In addition, William found that students do not like it when he does not follow the sequence of the textbook, and as a result follows the text rather closely (I, 623). His primary mode of instruction is what he refers to as a “pretty old fashioned” lecture style (I, 160), based on the way he saw teaching happening in graduate school as a teaching assistant (I, 208). The prime reason for using lecture is that he feels he does not have the manpower to do much else, like break-out sessions, as the course is managed by two instructors, William himself and his teaching assistant. With only him and the teaching assistant, a group of 150 students would split into two groups of 75 in a breakout session, which is still not an easily manageable size in his mind (I, 158). William does not use preceptors (undergraduate students who act as peer mentors and who either have taken the class before or are currently taking it) in his class, as he doesn’t think they have the background knowledge and experience to explain the material (I, 228). The required knowledge and experience is present in his teaching assistant in William’s eyes, as the teaching assistant has typically completed all the astronomy graduate course work and is thus intellectually prepared (I, 265). Lack of manpower is a recurrent theme in the interviews with William and is addressed throughout this case study. In his teaching, William approaches the material from different angles, using both the teaching assistant and the textbook as different resources, different voices the students can hear explaining the material, and expects the students to use those resources when they do not understand the material in class. William more or less expects his students to
220 be confused by the material presented in class, yet the confusion is purposeful in his mind. On this topic he notes: My goal is to go through the material and to confuse them, I hope, because I believe firmly that if they can understand everything I say the first time, that what I’ve said is not worth talking about.” (I, 190) If students get confused about something William says in class, he expects them to do their jobs and try to “unconfuse” themselves, by going to either the teaching assistant or the book, as those are other voices to be heard to frame the concepts in a different way which may better connect to the student (I, 194; II, 115). The notion of hearing a different voice works both ways. When the teaching assistant lectures, William is the primary contact point for when students have problems, as he will most likely phrase the material in a different way than the teaching assistant does (I, 254). As mentioned, a third voice students can hear is the book. William found however, that students seldom read the book, meaning that this voice is lost. More importantly, especially with respect to the concept of the HR diagram, students do not look at the figures in William’s experience, but focus on the words instead (I, 366). He contrasts this approach of his students with the way professional scientists approach a text. As you know, as a scientist, when you’re reading a paper, we all, we can ignore the words and just look at the figures, come to our own conclusion, and then go, and see what the authors actually said. And I would say no student does that. (I, 373)
221 At one point, William tried an experiment to address his observation that students do not pay attention to figures and graphs in the book. He and the teaching assistant would only discuss the figures in the break-out sessions, but he found out that the experiment did not work as well as he had hoped, as the discussion resulted in the students listening to the instructor again (I, 375). William admits that plots are alien to the students, and has so far not found a good strategy to deal with that fact (I, 706), save using the height versus weight diagram, which is discussed in section 4.15.1.
Assessment William uses several methods to assess his students. Due to the lack of manpower in the large nats102 class, William uses multiple choice exams for his midterms and final, which together account for 65 percent of the final grade in the class (Syl, 2). The lowest score on the four midterms is not weighed into the final grade (I, 542). In addition, students complete several homework sets on the online Mastering Astronomy (Stone, 1994) system (I, 531), which was discussed in more detail in the case study of Paul, and this part of the assessment is worth 10 percent of the final grade. William also uses what he refers to as “labs” (I, 533), exercises in which students work with real data, primarily from the Sloan Digital Sky Survey and the Contemporary Laboratory Experiences in Astronomy (CLEA) computer lab exercises. Both sets of exercises have been rewritten by William and his TAs to adjust the level, length, expectations, and wording for use in the classroom (I, 540, 591; II, 158, II, 178). These labs are worth 20 percent of the final grade. The remaining 5 percent of the grade is an
222 observing project, where students use the 21 inch telescope on campus for observations (Syl, 3). In addition, students can earn extra credit by going to one of the star parties William organizes throughout the semester. In his syllabus, William devotes considerable attention to the grading scheme and explicitly notes that the students are not competing against each other (Syl, 3), but are graded on an absolute scale. Even though the class has up to 150 people enrolled, William occasionally assigns papers to his students. However, he tends to find term papers rather frustrating, “partly because the amount you actually have to put into to write something fun to read is very large, and partly because of the whole cheating problem” (I, 549). Instead, he gives a few very small papers, partly to reduce student anxiety over big papers, and partly because in his experience, students put as much effort in to writing a small paper as in writing a big paper (I, 560). In this section, William has mentioned several of his perceptions of the nats102 student: they don’t read the book, they don’t look at figures and graphs, and their writing leaves something to be desired. The next logical question then became: what is a typical nats102 student, and how does William cater to this audience? The answers to these questions are the topic of the next subsection.
4.14.3 Students in the course and classroom environment William remarked that in his opinion there is no such thing as a typical nats102 student, which creates an interesting teaching problem. The students have all levels of ability and interest in the subject material, from “people who would be A students at
223 Princeton […] to students who have no business being even at a junior college” (I, 309). As a result, pitching the level of the class is challenging, and William is aware that he cannot make everybody happy (I, 320). He pitches his class to the student he expects to get A’s and B’s: “a smart, willing, interested non-major” (I, 325). William recognizes that the students are generally smart, but simply have little experience in the area of science. Asked about the single most important piece of advice that he would give a colleague who is teaching nats102 for the first time he mentions this explicitly: […] assume that they’re smart people with a completely empty brain for this kind of work. So they’re not stupid because they don’t have all of the twenty years of love of science and science classes and everything, that we have. They can grasp complicated ideas but [pause] things that we take for granted, we’ve forgotten that we ever actually had to learn them. They’re going to have to pass that hurdle. […] And [pause] try as best you can to limit the amount of jargon. […] this is essentially a foreign language class in that there’s this enormous set of vocabulary that they have to learn and manipulate and it’s, you know, how much French could you learn in one semester, you know, would you be reading Camus while you’re still learning your conjugations. […] the more esoteric the thought is, the more work you have to put into getting them there. And that is impossible to do in one semester. (II, 843) Describing the general classroom atmosphere, William mentions that overall, the in-class interaction between him and the students is not optimal, especially in the give and take with the students. For reasons that he does not understand, he is perceived as scary by
224 the students. This precludes most of the students from asking questions in class, though once some do, it works out fine (I, 175). William suggests that it may have to do with the students realizing that interruptions may mean that they will not be able to get through all the material, but he mentions that he is not sure about that (I, 183). The in-class interaction clearly is an aspect in which William would like to improve the course. In the next subsection, William was asked to consider how he would teach nats102 if he could do and have everything he wanted.
4.14.4 Teaching nats102 in the ideal world William mentioned the lack of manpower in the class several times in the interviews. When asked about the ideal world, in which he could teach nats102, William mentioned that besides having the lecture, which he still values as he perceives a need for the students to hear the professor talk, there would also be more small group break-outs in which students can discuss the material (I, 379). He does note however, that if he were to add sessions outside of lecture, it would also require the students to not have to take four other classes (I, 389), so that they can focus solely on astronomy. In addition to having the class split in smaller groups, William would also like to include more observing, as students expect that they will be looking at stars (I, 422), even though “one can teach a modern astrophysics class where you never ever look at the stars”, this would be very abstract to the students (I, 413). In his class, William holds two star parties at Saguaro Park West, a park outside of town where light pollution is less of
225 an issue, and with more manpower he would expand the observing requirements, for example having students chart the time of sunset over the semester (I, 448).
The nats102 course is specifically meant for non-science major students, a fact of which William is well aware as evidenced by this subsection. So if William were to teach the introductory course for majors instead, how would the teaching change? This question is explored in the next subsection.
4.14.5 The difference between teaching nats102 and astro250 When asked how teaching nats102 would differ from teaching astro250, the introductory course for science majors, William responded that with respect to the HR diagram the big ideas would still be the same, yet the underlying mathematical details of the HR diagram would surface in astro250 (II, 259). According to William, one can get a good idea of what scientists do without having to go through the mathematics, but if one would want to do science later in life, the mathematics is needed (II, 261). In practice, this means that William would have his students do more calculations for themselves in class and run some stellar models (on the computer), to get more of a feel for the physics that is behind the HR diagram, rather than what he dubs the more hand waving approach taken in nats102 (II, 238).
The discussion about the differences between nats102 and astro250 concludes the first part of the case study, dealing with the nats102 course in general. In the next section
226 and subsequent subsections, William’s approach to teaching the HR diagram is examined in detail.
4.15 William’s approach to teaching the HR diagram 4.15.1 Goals for and approach to teaching the HR diagram As mentioned in the first part of the case study, William tries to follow the textbook in his course. By doing so, the placement of the HR diagram in the course sequence mimics the placement of the HR diagram in the book. Stellar astronomy, of which the HR diagram is a part, is typically placed after historical astronomy, causes of seasons, eclipses, some physics on the nature of light, and the Sun (I, 623). The underlying thought in the books is “how do we know the stars are just like the Sun?” (I, 628). For William, the HR diagram represents a jumping off point between studying how we know and measure colors and temperatures of stars, and determining the physical properties of stars and stellar evolution. The HR diagram represents these physical properties in a diagram, and, observing that the diagram is not a scatter plot (I, 658) the question then becomes what the implications of that diagram are for stellar evolution (I, 632), as there are laws of physics underpinning the shape of the diagram. According to William, the HR diagram is a fundamental diagram in stellar astronomy, on par with the Hubble diagram in extra-galactic astronomy and cosmology (I, 662). The Hubble diagram relates the velocity with which a galaxy is moving away from us to the distance between us and that galaxy. William’s main content related point in the HR diagram
227 lesson is not so much linked to the diagram, but to stellar evolution. Discussing his concept map, he mentioned that the single most fundamental thing he wants the students to take away is that the Sun is leaking energy that this fact implies that the Sun, and by extension other stars as well, are changing, or evolving and that some of the most exotic objects in the universe, like white dwarfs, neutron stars, and black holes are normal consequences of this evolution (II, 547). William uses an analogy of the height versus weight diagram, discussed in more detail below, to try and get across the importance of the HR diagram for its use as a tool to make inferences about stellar evolution.
The analogy of the height versus weight diagram William uses the analogy of the height versus weight diagram to help teach about the HR diagram for two reasons. The first reason is to teach about what trends in a diagram can tell you, and the second is to alleviate student anxiety about the concept of a graph, as many students have not seen a graph since algebra I in middle or high school (II, 347). The height versus weight diagram analogy allows the complex concept of a graph to be cast into subjects from daily life. William mentioned that he is not quite sure on how to approach this concept, and suggested that a tutorial at the beginning would probably be good, but …we would have that problem that some of the students would be insulted by the eight grade level of that, and some of the students would find it very hard. And, so I always end up coming back to “what do you do with a group of 150”, and the answer seems to be “plough ahead”. (II, 138)
228
He uses the analogy in the following way: say that you are a Martian, and you come to the class and try to figure out how humans worked, what observations can you make to learn something about humans without cutting them? Plotting for example height versus hair color would not get you very far, but plotting height versus weight, you can learn something. When you plot height versus weight for boys and for girls separately, you learn something equivalent but a bit more detailed. Generally, if a person is taller, he or she will weigh more. So even without understanding exactly how humans work, we can reasonably guess a person’s weight when given the height. From that, William refers back to the temperature versus luminosity of stars. However, when he does that, he mentioned that he loses some students, as the concept then suddenly becomes abstract again (I, 666; II, 302). It usually takes one or two repetitions before the analogy makes sense to the students (II, 377).
4.15.2 Cognitive task I: Lesson plan William produced a large lesson plan, about which he noted that it could not be covered in 75 minutes, but instead would take three to four class periods. The lesson plan is outlined below. I. I assume that the students have already learned a) parallax b) Wien's law c) Stefan-boltzman law d) Kepler's laws and Newton's improvements on them e) the difference between intrinsic and apparent properties f) PERHAPS the magnitude system g) Some knowledge of the Sun, perhaps including what powers the sun. h) Introduction to Bohr Atom
229 II. Start with "are the stars like the Sun?" a) the Greeks realized that the stars showed no by-eye parallax. I guess the leap that they are therefore VERY far away was too scary. b) What do we need to know to test this question? Ideally we'd know the luminosity and mass of at least one star. 1) We need to know the distance to at least one star. Technology allowed this to be measured in around 1840. We can visit or revisit parallax here. 2) We need to know the mass of at least one star. We can revisit orbits and mass determinations here. We can walk students through Newton's P^2=a^3 equation with the mass term and show how this makes sense. We can run an orbit applet if we want. III. Move on to trends among the stars. We can jump off from Herschel's discovery of optical binaries, or we can take a pretend trip to Alpha Cen. In either case, we can see that there's a trend... the optically fainter star of a binary is generally cooler. Something interesting is going on here. But sometimes this trend fails. Does this mean the end of this notion, or is something else interesting going on? We can give the example of height versus weight diagrams for people. Or body-mass index. Or of a useless thing like weight versus hair color. What would a martian plot to "see inside" people without cutting them open? What does a height versus weight diagram for elephants look like? IV. Now move on to Hertzsprung and Russell a) In the first 1/4th of the 20th century, H and R independently plotted a couple of intrinsic properties of stars against each other, and saw a most definite trend. We have to remind people why luminosity is an intrinsic property, and how we calculate it. We have to explain spectral types, or better yet, lie a little bit a plot luminosity against temperature, and come back to spectral types later b) we see a definite trend. Even though at this moment in the class we cannot explain this trend (we'll get to it within a week), the trend is telling us that the properties of stars follow some rule. c) We can in fact exploit the H-R diagram to derive distances to stars without knowing how stars work. We introduce the notion of standard candles here.
230 Students will see standard candles again soon, when we discuss Cepheid variables. And students will see standard candles when we talk about the distance scale of galaxies and/or the expanding universe. V. More on H-R a) Again, without knowing how stars work, we can use Wien's law and Stefan-Boltzman law to figure out differences among stars. We perhaps introduce spectral types here. We remind students of different ways of measuring temperature. We play "red star/ blue star" where we show that red giants are large in radius, and that white dwarfs are small in radius. b) We use binary stars to show that the main sequence is a mass sequence. VI. Ages of stars a) Knowing the the Sun is 1-Solar-mass, and the the Sun can be shown to be 4.5-4.6 Gyr old (and that stellar models say it's halfway through its evolution) we can calculate the lifetimes fo stars. 0) We remind students that the stars and the sun are "leaking energy". A gas ball has to change its structure, ie evolve, if it's leaking energy. Furthermore, energy flows from a warm place to a cooler place. 1) We introduce the idea that the lifetime of a star depends on how much fuel it has and on how fast it uses the fuel. Give example of a Hummer and a VW bug. 2) So we have labelled the H-R diagram in mass. What do we know about a 100 solar mass star? It's around 1 million solar luminosities. Doing the math, we know that if the Sun survices for 10 billion years, that this star will only survice 1 million! 1 million is long by a single human's lifetime, but it's not long compared to evolution of mankind. And it's certainly not long by end of the era of dinosaurs. How many such stars have to be born and die to keep at least one such star in the earth's night sky at all times? 3) What about 1/10th of a solar mass stars. The age of the Universe is longer than the lifetime of these stars. VII. Now we go back to gas balls. We remind students about how the Earth's atmosphere works, and how a gas ball holds itself up against gravity. We remind students about how energy is transported: radiation, convection, conduction. We remind students, from Bohr atom, that photons can be absorbed.
231 We can introduce stellar models here, but in concert with that, we can show that the center of a self-gravitating gas ball must be really hot. (and really dense) VIII. We have now to talk about the chemical composition of stars. We talk about Cecilia Payne Gaposchkin and quantum. She discovered stars are 75% H, no matter what their temperature. (Spectral types are a temperature sequence, not a composition sequence) So we now know that all stars are basically H. That there are trends of central T with mass. that the core of a star is really hot and really dense. That a gas ball uses motions of particles to hold itself up against gravity. That a star is leaking energy into space. IX. Now we have to talk about Einstein (and fission and fusion). Very generally talk about e=mc^2. Talk about the bomb dropped on Hiroshima and about H bombs. Talk about how the Palo Verde nuclear power plant makes electricity. Talk about the long unfulfilled history of fusion reactors. If you have time, talk about nuclear waste and Yucca Mountain. So, how is this applicable to the Sun? Well, if you were designing a fusion power plant a) lowest mass fuel b) high temperatures c) some containerWhat container works in Pricenton New Jersey--- magnetic bottle. How else might you bottle up a "bomb"? What's the difference between a bomb and a controlled reaction? So the sun has a) lots of the lowest-mass fuel b) high central temp because it's a self-gravitating gas c) a container (the "rest of the star") X. Back to H-R diagram We can make plots of mass versus luminosity How can we understand that in terms of item IX? So bow we can derive lifetimes of all sorts of stars. XI. What about those red giants and white dwarfs anyway? We can't understand them without help from models. It wasn't until about 1950 that stellar models were sophisticated enough to show what happens when the H runs out in the core of a star. Given this, we can make a stick-figure discussion of stellar evolution. Our main conclusion is that the main-seq turnoff luminosity is a function of age.
232 We can use models to interpret star clusters. Star clusters are nice because the assumptions that the stars are all at same distance from earth, that the stars all have the same L, that the stars all have the same age, are not too bad. If we look at H-R diagrams of a bunch of star clusters, with different turnoff L, we see that nature pretty much does what stellar models say it should be doing. So now we can tell you what happens to the Sun as it ages, what happens as the fuel runs out in center, etc.
William’s central take-away message for this series of lessons is that there is a set of underlying physics that determines how stars radiate light and that we can use the properties of nearby stars to extend farther out into the universe (II, 338). He wants the students to know how nature makes stars with the properties that put it where it is on the HR diagram, that these properties can change over time, and what the consequences of these changes are (II, 704). These elements showed up in William’s response to the first stereotypical student statement, in which a student asks how to study the HR diagram for the test. In his answer, William seconded the statements about the central take-away message above, and mentioned that the students should understand how nature makes stars with the properties it has, how that determines where the star ends up on the HR diagram, and how the properties of stars change over time (II, 704). The series of lessons on the HR diagram reinforce the overall course goal of “showing that there is a method to the madness of science” in the sense that with the laws of physics about gravity and light in hand, one can understand why stars are where they are on the HR diagram. The lessons support the course goal “following what is being said in the newspaper” in the sense that the lessons talk about distance scales, which has
233 been a major issue in astronomy, or gamma ray bursts, which is a current topical event in astronomy (II, 461). The first lesson in the series would deal with (having discussed gravity and properties of light earlier) using distances to stars to obtain their luminosities, and the important difference between intrinsic and apparent properties of stars. Noting that for certain stars, the obtained luminosities are comparable to the Sun, we can learn something about other stars using the Sun as a template. A variety of plots can be generated, one of which would be the HR diagram, and even without completely understanding the HR diagram, we can learn things about the properties of stars (II, 274, 291). The trends in the HR diagram (the fact that it is not a scatter plot) can be explored in further lessons using the analogy of the height versus weight diagram to talk about temperature and luminosity. Using the law of gravity and applying it to binary star systems (like in the pretend trip to Alpha Centauri, discussed below) one can obtain masses of stars and the trends in the HR diagram of the masses of stars (which align with the main sequence). Using arguments of balance from physics (hydrostatic equilibrium) one can then talk about central core temperatures of stars, and that the higher the central temperature is, the more light will come out of the star (II, 306)
Pretend trips Under point III in the lesson plan, William mentions a “pretend trip”. In a pretend trip, the students are imagined to be on a space ship, which visits various
234 destinations. These pretend trips explain astronomical concepts in a more complex context, in situations as they occur in the universe, where multiple concepts are at work in any given situation. William uses a set of notes from one of his collaborators, who originally came up with the idea of a pretend trip, in his more advanced stars class (astro203, the second tier general education science class). In one of these pretend trips the students are taken to Alpha Centauri, a nearby binary star system. William explains how he uses the Alpha Centauri system to introduce or revisit a number of physical concepts, among which is the HR diagram. And when you go to Alpha Cen[tauri] and you look out the windows of your space ship, you know, you discover that Alpha Cen[tauri]’s a binary. And that’s a perfect place, while once we discovered that Alpha Cen[tauri]’s a binary, we can talk about Kepler’s Laws, and how we can then use the fact that Alpha Cen[tauri]’s a binary to deduce the masses. Then, we can also look, you know, we’re in the star system, when we look that geee, the redder star Alpha Cen[tauri] C, and the kinda normal stars Alpha Cen[tauri] A and B, there’s a relationship between how bright they are, and what their color is. So we sort of sneak into the.. HR diagram that way. (I, 738) William mentioned that the lesson plan and the concept map are quite similar. As the reader will notice, this is indeed the case. The concept map and the Pathfinder network map are discussed in the next subsection.
Yucca Mountain
235 Under point IX in the lesson plan William mentions nuclear waste and Yucca Mountain. Asked why he put this point in the lesson plan, William explained that the same physical processes that control how stars work, namely nuclear fusion, has applications on Earth. William wants to “pay more than lip service to the myth of the informed voter” (II, 398) to help students understand that there are differences between nuclear fusion and nuclear fission. The former is very hard to control on Earth and has so far only been successfully applied in nuclear weapons, but the latter forms the basic operating principle of nuclear reactors that generate electricity and as such, directly impacts the lives and communities of students. He notes: …one of the jobs of the astro one-hundred teacher is to not just talk about things many light years away, but eh when that same physics is impacting our lives here on Earth, we have to say stuff about it. (II, 404)
4.15.3 Cognitive task II and III: Concept map and Pathfinder network map William, in line with his elaborate lesson plan, produced a large and detailed concept map encompassing the material on the HR diagram he teaches in both nats102 and astro203. In contrast to the other case studies, where the original concept map of the participant is displayed, William’s concept map was redrawn electronically to fit the format of this dissertation, as the original was about three feet long. The redrawn figure is displayed in Figure 10. William mentions that he would expect his A level students to have this diagram to a “reasonable approximation” in their mind at the end of the lecture series (note: it is not clear from the data if he was referring to nats102 students or
236 astro203 students in this case). For the C level students he would be happy if they would say that “there’s a bunch of physics, there’s the HR diagram itself and from the HR diagram we learn a bunch of stuff. And maybe they can list some of this stuff” (II, 559).
237
Figure 10: Concept map made by William
238
William notes that the concept map can be seen as a computer program, with inputs (the physics) at the top, the program in the middle (the HR diagram) and outputs (the inferences for stellar evolution) at the bottom (II, 529). The approach he took was determining what physics was needed to create the HR diagram (gravity, Wien’s law, Stefan-Boltzmann law, the Sun as a template), then the HR diagram itself, followed by the inferences one can draw from the HR diagram. Depending on time, he has several asides that he can go into at a deeper level (II, 481, 504). Most of these asides deal with technical issues, but one of them is what William refers to as “astro-sociology”, which appears in three locations in the concept map. Asked what he meant by this term, William talked about the human side of science and added a personal note: I think it’s important for the students to understand that it’s not been that many years since half the population, the women, were denied the same university intellectual rights, and it’s actually kind of scary to think that three of the biggest ideas in stellar evolution, namely that the stars are mostly hydrogen, ehm Leavitt’s dis..disc.. Leavitt figuring out the period-luminosity relation, you know, which is the reason we built the Hubble Space Telescope, and Jocelyn Bell discovering quasars, I mean ehm pulsars, were done not with full representation. And so then to ask the question what would happen if we got, I mean, we may or may not have gotten rid of the prejudice in university life on against female scientists, but there’s lots of other under represented in the sciences, minorities, and you wonder how many brilliant ideas we’re missing. And..and..and I think
239 it’s important for the students to see that it’s not just men in white lab coats. Ehm, so in like the stars class I have them read some stuff by Jocelyn Bell, you know, about why she is not bitter that she got screwed out of the Nobel prize. For them to see that, even though science itself ultimately, you know, the math and the physics makes it a self-correcting thing, there’s this human part of the enterprise that at least in time scales of a generation make it so they’re not self-correcting. [pause] And, you know, Celilia Payne-Gaposchkin is my academic grandmother [dissertation advisor’s dissertation advisor], so I like talking about her every semester. (II, 616)
William’s Pathfinder network map, depicted below in Figure 11 shows one strong central node on “student interest”, about which he commented that “if I’m doing my job and if the students doing their job, they will discover whether they want to or not that there’s a lot of interesting stuff” (II, 683). However, William had indicated that the purpose of the network map assignment eluded him, and used primarily the values 1 and 9 for the ratings. As such, the ratings suffer from a severe range restriction. This range restriction becomes evident in the measure of internal coherence of the map, which stands at 0.03. The Pathfinder manual (Interlink, 2009) and Buxner (personal communication) mention that values less than 0.2 in the internal coherence should be treated with extreme caution. As such, the map is very difficult to interpret and no the low internal coherence means that no meaningful conclusions can be drawn from it.
240
Figure 11: William’s Pathfinder network map
4.15.4 Common student problems and stereotypical student statements William encounters student difficulties with the material related to the HR diagram in his classes. The student difficulty of reading and interpreting graphs was discussed in section 4.15.1 where William uses the height versus weight diagram to help students understand the concept of a graph. In this subsection several other student difficulties are discussed, both volunteered by William, or as part of the stereotypical student statements. Red star, blue star, temperature, luminosity and size One of these difficulties is what William refers to as “red star, blue star”, where two stars have the same temperature, but different luminosities, and students are asked to place them on the HR diagram, which, in William’s experience, takes some practice (II, 436). The reader is reminded that color relates to temperature, that blue stars are hot, and
241 occupy the left part of the HR diagram (owing to the fact that the horizontal axis, denoting temperature, goes from hot to cool), whereas red stars are cool. This problem is analogous to the item in the stereotypical student statements, where the participants were asked if their students could solve a ranking task. Recall that in this ranking task students are given a plot of temperature versus luminosity, on which four stars are placed in a diagonal line from lower left to upper right. No numbers are given for the stars and only a rough scale is given for the axes. This task is more complicated than the “red star, blue star” problem William encountered in his students, as the ranking task contains two free parameters, temperature and luminosity, from which the relative size has to be deduced (in essence the Stefan-Boltzmann law). William mentioned that his students would probably not be able to do this particular ranking task. The reason for that is that his students would not have seen the particular plot before, meaning that student anxiety about plots will start to factor in, and the plot does not show a real HR diagram nor does it have numbers to work with (II, 795, 824). What is a young star? Another student difficulty William encounters is the fact that massive stars are young and the young in years versus young in evolutionary phase. In its core, this is a semantics problem more than anything else, as the word “young” is used by professional astronomers in both senses. Massive stars don’t live that long, so when they are seen, they must have recently formed. However, less massive stars are not by definition old, as they could have formed recently, but instead will live for a long time (II, 440). How can a star live longer if it has less fuel?
242 The student confusion about life times of stars mentioned above comes back l in the second stereotypical student statement. Recall that this statement has a student say that a star that is twice as massive should live twice as long because it has twice the amount of fuel available. William uses the analogy of gas tanks in cars to help students with this misconception. He would begin by acknowledging the student’s reasoning and states the student would be right to assume that a car with a bigger gas tank would go farther, all other things being equal. He then proceeds with asking the student questions that should give the student pause. He asks them to compare a Volkswagen to a Hummer, would there be something else going on besides the size of the gas tank that determines how long the car will be able to drive? Is there something else going on that is changing as the amount of available fuel changes too? (II, 747) Do stars physically move on the HR diagram? Responding to the stereotypical student statement in which the student mistakenly describes stellar evolution as movement of stars in the sky, followed by the question which telescopes are used to observe that (physical) motion, William acknowledges that it is easy for students to get confused about motion on a diagram and motion in space. He would explain to the students that motion on a diagram is shorthand for the physical properties of stars changing over time, allowing us to look up the properties quickly. As a star evolves, its properties change, and so will its place on the HR diagram. He added that he would try and avoid students raising this question, by constantly reinforcing what a diagram is, and what it represents (II, 722, 730). How do you know a star is big?
243 Responding to the stereotypical student statement about how we know whether stars at the top right of the HR diagram are actually bigger than stars at the top left, William used an analogy of a hot iron rod to explain the concepts of Wien’s Law and Stefan-Boltzmann’s Law. He would opt for an analogy as he noted that explaining this through a constant times temperature to the fourth power equation would be too abstract, and arguing that astronomers have actually been able to measure sizes of stars would require mentioning astronomical techniques that are beyond the scope of the course (II, 757). The analogy of a hot iron rod works as follows: …if you take two iron rods out of a fire they have the same temperature, the bigger of the two is brighter, and if you take two identical hot iron rods, out of two different temperature fires, the hotter of the two is brighter. (II, 766) William would then link the analogy back to Stefan-Boltzmann’s Law with temperature to the fourth power and the diameter of the stars that go into that law. How does temperature tell you about brightness? The last stereotypical student statement has a student confused on how the temperature of a star would tell something about the brightness of that star. William briefly mentioned the underlying physics of hydrostatic equilibrium, and the related concepts of central temperature and fusion rates, but responded that most students actually do not have too much of a problem with the idea that hotter stars (and therefore more massive stars) are brighter (II, 776).
244 4.16 Concluding remarks about the case of William The themes coming out of the data that seem to drive William’s thinking are “content”, “voices”, “method”, “lack of manpower”, “flow chart”, and “human side of astronomy”. Each of these themes is discussed in more detail below. Content The first theme to emerge from the data is that William’s course is content driven. William seems to be a man in a hurry to get through a large amount of material, using lecture as the dominant mode of instruction. Yet, as has become clear in this case study, there are clear reasons for why he chooses to do so. To apply his own words in a slightly different context: there is a method to the madness. William wants to prepare his students to be able to follow a news story in the media about astronomy, which is likely to cover some new advancement in modern astrophysics. William wants to spend the most time on modern astrophysics, but is confronted with two expectations from the students. The first is that students expect that he follows the textbook, which typically covers a lot of non-astrophysics aspects of astronomy in the first half, and covers all concepts in astronomy in great depth. The second is that students expect to hear about these non-astrophysics ideas like constellations, the night sky, seasons, moon phases, and eclipses in an astronomy class. William’s goal to expose the students to a wide variety of topics, so that they have at least heard about most of the things they are likely to encounter in a news story, combined with the student expectations about the classroom, are in conflict given the amount of time available in the semester. Arguably, this tension is the primary reason for
245 William to use the “feeding from the fire hose” strategy in class, in which a large number of topics are covered in rapid succession. Voices The second theme emerging from the data is the idea of different voices. William made a course implementation decision to assist the students in their learning by exposing them to a multitude of voices explaining the material; himself, the teaching assistant, the textbook, and Mastering Astronomy. This indicates a realization that students learn in different ways, and profit from hearing the same material from a different source, or explained in a slightly different way to make it “click”. William purposefully sets up class this way, directing students to the teaching assistant if he was the lecturer of the day, and vice versa. William does expect his students to play their part in the learning process, by actively taking steps to ameliorate their confusion about the materials. Although the data obtained from William does not address this specifically, it is easy to imagine what would happen in the course if the students do not live up to this expectation or buy in to the idea and system of multiple voices. Method The third theme that emerges from William’s case study is method. William’s content goal for the nats102 class is supplemented by his goal that “there is a method to the madness of science”, in other words, that science is a systematic process to understand nature. William aims to show the students how scientists know things and how trends and regularities can be exploited to learn something new, which is central to scientific thinking. This goal becomes clear when talking about the HR diagram.
246 Emphasizing the trends in the diagram, and exploring how the physics of stars ensures that the HR diagram is not a scatter plot, William tries to make the students understand how inferences about stellar evolution can be made based on the patterns in the diagram. The centrality of data, organizing data, and inferring results from data is a defining aspect of professional science, and by emphasizing this method William exposes the students to how science is done in real life. Lack of manpower The fourth theme that emerged from the data was what William coined “lack of manpower”. He uses this phrase to indicate a constraining factor in his teaching. He has 150 students, and only himself and the teaching assistant as instructors. For this reason, all his exams are machine graded and multiple choice, as grading 150 open-ended exams several times during the course of the semester is logistically not feasible. For the same reason, William rarely assigns papers to his students. The first thing William would change if he were to have unlimited resources is to have the class be split into smaller, more manageable groups more regularly. Although not specifically stated in the data, the implied message is that smaller groups allow for more varied forms of teaching and assessment. This indicates that William’s assessment decisions for the course are not necessarily driven by what he believes is best, but by what is the most practical and logistically feasible in the given setting. Flow chart The fifth theme, dealing specifically with the HR diagram, was using the diagram as a flow chart. William works in stellar astrophysics, and as such has a very thorough
247 knowledge about the HR diagram, the people who have worked in the field, the underlying physics, and the inferences that can be drawn from the diagram. It can be speculated that this deep knowledge, combined with his own passion for the topic, led him to create a lesson plan that could cover four class periods, rather than one. He considered the lesson plan and his concept map to be comparable, using it as a flow diagram of input physics, the HR diagram itself, and the inferences drawn from the diagram for stellar evolution. By using the diagram in this way, William adheres to his course goal of showing that science is systematic, and that there is an underlying set of physics that determines the shape of the diagram. In addressing common student problems with the material, he uses everyday life analogies to get the concepts across, in particular the analogies for gas-mileage to explain stellar life time and a hot iron rod for Wien’s law. A particular student problem is the concept of a graph and the ability to read a figure, where William comments that the students are almost the opposite of professional scientists, who typically look first at the figures in any article or text, rather than at the words. William reinforces the idea of what a graph is numerous times throughout the course, and uses the height versus weight analogy to help get the concept of what the HR diagram represents across. Human side of astronomy The last major theme that came out of William’s case study is the human side of astronomy, and the human side of science in general. The example of Yucca Mountain William gave in his lesson plan for the HR diagram, linking the physics of stars to real effects here on Earth, speaks to a goal, never explicitly expressed in the data, of making
248 science relevant to the students. Another example of the human side of astronomy comes from his concept map, where he inserted several pointers to talk about what he coined astro-sociology. He especially emphasizes the way women have been denied intellectual rights, not only in astronomy, but in academia in general. This is especially relevant in the context of the HR diagram, where several crucial discoveries in stellar astrophysics have been made by women, and William wants to highlight this fact. Though William never said this in either of the two interviews, one can argue that this attention to astrosociology serves as a role model for the young women in his classroom, to show them that despite the stereotypes regarding women and science, science can, and is done by men and women alike.
4.17 Concluding remarks about the individual case studies In this chapter, the case studies of the five participants were presented. The reader will have noticed that the cases are rather descriptive in nature and will also have noticed several trends that appeared in the data across the cases. In the next chapter, the trends across the different cases are combined with the highlights from the individual cases to describe and interpret the more general themes in the cases.
249 CHAPTER 5: IDENTIFICATION AND DISCUSSION OF THEMES EMERGING FROM THE INDIVIDUAL CASES 5.1 Introduction In the previous chapter, the five individual case studies were presented, and the reader was introduced to the classrooms, the goals, and the teaching strategies, both for the course in generals as for the HR diagram, for the participants in this study. The cases presented in the previous chapter naturally only offer a glimpse into the richness of the total data collection. Examining these single case studies yielded interesting information about the goals and strategies of a participant, and the reasoning behind the chosen approach. Yet it is only when comparing the case studies that patterns become visible, when tidbits of information that seemed incidental at first turn into trends. While creating the case studies, as well as in the process of writing them, I came across trends, similarities, and contrasts that sparked my attention. In this chapter, the highlights from the individual cases are combined with these more general trends across the cases. In addition, the chapter contains a comparison between the cases of Hugh and Linda, who are team teaching the nats102 course, as an example of how similarities and differences between cases play out.
250 5.2 Emerging themes For each of the individual participants, several highlights were pointed out at the end of each case study. They are summarized in Table 7 below.
Hugh Flexibility of content Student anxiety The concept of a graph
Jeff Working with real data Difference in teaching approach Being effective as a teacher Willingness to experiment
Linda Scientific literacy In-class exercises
Paul Showman
William Voices
High tech
Human side of astronomy
Flow chart
Road map
Technical explanations
Learner-centered teaching
Lack of manpower Flow chart Method
Table 7: Highlights from the individual cases
It should be noted that some of the highlights of participants also showed up in case studies of others, but were less prevalent and were therefore not included in the concluding remarks at the end of the case. From these highlights, four main themes with regards to instructor thinking were identified. These were the thinking about instructional goals, choosing instructional strategies, assumptions about students and student learning in the classroom environment, and the HR diagram as an instructional object. In addition, the following trends emerged from the case studies that became apparent when all the data was aggregated. These trends were the differences between teaching astro250 and nats102, the similarities and differences in assessments, the approach to substitute teaching, the similarities and differences in reinforcement
251 techniques, and the similarities and difference in the approaches the participants would take if resources were no consideration for the nats102 course. These trends were subsequently subsumed under the four categories that surfaced from Table 7 above. Together they provide evidence that the instructional goals are mediated by the assumptions about students, student learning and the learning environment, that the instructional strategies are mediated by both the goals and the assumptions mentioned above. The HR diagram serves as a case in point in which these goals, strategies, and assumptions are played out. In the following sections, the four categories, and the subsequent subcategories, are explored and discussed in more detail. Because assumptions influence goals, which influence practice, this chapter is constructed in that order. First, the ideas, assumptions, and beliefs the participants have about the students, student learning, and the learning environment are discussed. This is then followed by the trends in goals the participants have, after which the choices of instructional strategies are commented on. Finally, the HR diagram as a learning object is discussed, encapsulating elements from the previous sections.
5.3 Assumptions about the students, student learning, and the learning environment All participants mentioned that the large nats102 class has a very diverse, both in aptitude and attitude toward astronomy, audience. However, they point out that the students are for the most part smart young human beings, who have simply chosen a different career path than the natural sciences. They noted that the top of the class could easily be at an Ivy League institution, while the bottom of the class consists of people
252 who are not ready for college. According to the participants, the students generally have limited experience with mathematics and science, and may actually be anxious about taking a science class, though as noted, they do not consider that indicative of overall intelligence of the students. Phrases like “they have to take it”, “captive audience” were used by the participants, as nats102 is one of the options to fulfill a general education science requirement. The large size of the class (up to 150 students) is less personal and provided some challenges in maintaining order in the classroom and engaging all students, though all participants try to draw out student questions. Smaller class sizes is one of the things all participants but Paul would institute if they had no limits on resources. All participants spoke about the student expectations about the course. Learning about astronomy was not necessarily high on the priority list of students, according to the participants. Passing the class and getting three credits in a general education science course that fits the students’ schedule was a much more common answer. Participants talked about the discrepancy between modern astrophysics and what students expect from an introductory astronomy class, which is more related to looking at stars and other concepts (like the cause of seasons) that are far removed from the avant garde of modern astronomy, though most students are also very interested in some of these topics, for example black holes. Another student expectation that participants mentioned was and using the (expensive) textbook and following its sequence of topics. This expectation primarily drives the order of topics in the course. All participants use a form of presentation equipment in class: Jeff and Paul use PowerPoint, Linda and Hugh use their cd-rom, which uses primarily html, and William
253 uses html. Of the five participants, Paul uses the most technology in his classroom, as it is partly his job to pioneer new educational technology for the department. Other participants expressed the desire to experiment with different strategies in teaching, either in technology or classroom setup, but noted that they do not have the time to reinvent the wheel. Hugh put it succinctly: teaching is my top time priority, but not my top career priority. Time constraints also showed in the choice of assessments, which is discussed in section 5.5 in more detail.
5.3.1 Interpretive comments Experience seems to be the main driver for the participants’ beliefs about students, student learning, and the learning environment. All participants had, as has been noted elsewhere, considerable experience teaching, both the nats102 course as well as other courses in the astronomy department. Participants are well aware of the nonscience major nature of the course and the fact that nats102 is most likely the terminal science course for the students. In addition, they are aware of, and try to mitigate the discrepancy between student expectations for an astronomy class and the reality of an astronomy class. Participants attempt to engage all students and try to mitigate the discrepancies by partly meeting student expectations, which can be seen as an attempt to increase the buy-in of the students to increase motivation for, and engagement in the course. Participants tie the course material to examples in daily life to make the material more relevant to the students. This can be interpreted as an effort to increase the sense of relatedness students feel toward the course material, which in turn can increase the
254 intrinsic motivation to engage with the material. An obstacle the participants identify is the large size of the class, which has two effects. This obstacle is discussed in more detail in section 5.5.2.
5.4 Instructional goals 5.4.1 General course goals As can be seen from the individual case studies, the participants expressed a variety of course goals over the course of this study. However, on closer examination, those course goals shared similarities. The differences between the individual participants’ course goals turned out to be considerably less than the similarities. In the interpretive coding stage of the study, the master list of all course goals espoused by the participants was taken and examined. The descriptive codes from the master list could be put into three distinct generalized categories. These categories for the course goals were the following. Goal I: Affect Affect goals try to reach the students at an emotional, rather than cognitive level, and fall into three different subcategories. The first of these goals is enjoyment of science. Participants want students to enjoy science, appreciate the work scientists do, and not be afraid of (participating and engaging in) science. The second of the affect goals can be expressed as empowerment, where participants noted that they want the students to realize that they can understand, and engage in science. The third expression
255 of an affect goal the participants mentioned is relevance. Participants want students to see how science, and astronomy, is part of everyday life, and how science impacts them as citizens. Goal II: Process The second major category of goals falls under the umbrella of science as a process. Participants want students to understand how science works in practice, what its methodology is, how the standards of evidence work, and how to reason in a scientific manner. This set of goals was most commonly phrased by the participants as giving the students an idea about “how we know”. Participants cited the HR diagram as a good example of uncovering the process of “how we know” in astronomy. Closely related to the science as a process goal (“how we know”) the participants have a goal that can best be described as “how it came to be”. Science, as Jeff rightly pointed out in his interview, is not the nice linear process as is portrayed in textbooks. Reality tends to be a lot messier than that, with dead ends in research, blind walls, and errors, as well as the whole array of (nasty) human emotions that come into play the endeavor of science, for example ethics, competition, envy, backstabbing, and scooping, just to name a few. Goal III: Content The third and last major category of course goals is related to science content. Participants want students to have been exposed to, and have an understanding of, a certain body of scientific knowledge. It should be noted that even though nats102 is nominally an astronomy course, the content of the course can be more varied than only
256 astronomy (for example in the cases of Hugh and Linda). The emphasis in the courses taught by the participants is not so much on knowing astronomy details, but a more general knowledge of science to become more scientifically literate. This emphasis is in line with the general philosophy of the general education science program at the university. In nats102 there is no standardized curriculum and all instructors are free to teach the course as they see fit, in accordance with the principle of academic freedom. As a result, as has been illustrated in the individual case studies, the student experiences in the different sections of nats102 will vary greatly. It should be noted though that the content of the courses is less different than one might think, given that most of the participants use a textbook and follow that, and textbooks for introductory astronomy do not vary all that much as Jeff mentioned in his interview (Jeff, I, 415). So although the learning environment for the students is very different, and the content varies (slightly) as well, the participants all hold to the tenet of the general education science program, which focuses on scientific literacy.
To a degree, participants shared these three goals, affect, process, and content, but put the emphasis differently, making the classrooms of the participants look very different as a result. Where Hugh expressed affective goals strongly (wanting the students “to like science”) William expressed more content focus. Of these three generalized goals, the most prevalent was science as a process and the development of scientific literacy, which all five participants mentioned. Explaining to students “how we know” was a phrase that showed up in every interview, as well as notions of what it
257 means to make a scientific claim, and the rules for evaluating and judging of data. Hugh and Linda incorporate a science literacy project, in collaboration with the science library, to help students understand how scientists know and how to evaluate data. Affective and relevance goals were typically used as motivational tools to engage students in the material. The content goals were not as prevalent, with William and Jeff speaking most of it. Mostly the astronomy content was used as a vehicle to talk about science processes and to help promote scientific literacy in the students. Elements from the history of science were used by the participants for multiple reasons. Sometimes it was used to illustrate where certain terminology of techniques came from, for example the magnitude system, but mostly it was used to illustrate how science and the scientific method work. Illustrating the scientific method and showing that science is a human enterprise showed in the interviews as well. When appropriate for the topic at hand, several participants noted they mention their own research in class, to show the students that their professors are part of the community the students hear about, giving “science” a human face. Jeff explicitly mentioned that science is not as linear as the textbooks make it out to be, and that it is a true human endeavor with all its, not always positive, aspects. Another example of how science is portrayed as a real human endeavor is discussed in the next subsection.
5.4.2 Impact of science on the world Science and technology have a profound impact on human (quality of) life and has significant influence on the habitat of humans and the environment in general. New
258 discoveries and technological advances have consequences that not only influence public debate and policy, but can have a direct (positive or negative) impact on communities. The participants noted that they wanted to show students that science is ubiquitous in modern society, and that being informed about science is a good thing when they exercise their right to vote (especially when connected to science and technology policy). William especially was also concerned about showing the students how science impacts the daily life of the students, mentioning Yucca Mountain in his lesson plan as an example of how the course material relates to real things happening here on Earth. Linda also mentioned that she would like students to be able to read a newspaper article and determine whether “the reading makes sense from a scientific standpoint” (Linda, I, 505). These concerns from William and Linda mentioned above, as well as the general scientific literacy goals for the course, can be interpreted in the light of the affect goal of student empowerment, to provide students with the tools they need to become knowledgeable and informed about the background of the science and technology in modern society.
5.4.3 The differences in goals between nats102 and astro250 The participants note that the students by and large are smart people, who simply are on a different career path and are most likely taking the last science course of their career, giving the participants one last opportunity toward promoting science literacy and appreciation for science, and giving the students some exposure to, and practice with, the way science works. Participants also take care as to not confuse the students with “astro-
259 speak”, common words and phrases used in astronomy that are part of the vernacular of the field, or the use of units that are not commonly found outside astronomy. An example of the former, which participants subsequently try to avoid in their teaching, is “burning”, rather than “fusing” hydrogen (which thus can be confused with a chemical, rather than a nuclear process). An example of the latter would be “magnitude”, a measure for the brightness of a star, rather than more common units for luminosity like Watts. In the introductory course for science majors, things are slightly different. This astro250 course was instituted to give science majors a taste for what studying astronomy would entail and to ensure that people are in the major for the right reason. Participants mentioned they would teach the material at a “higher level”, with which they typically meant more emphasis on the mathematics and the physical processes of astronomy and participants would expect a higher level of preparation in those subjects. They also would expect a higher level of self-motivation of the students in the course, which would allow for some of the “entertainment” elements of nats102 to be removed in astro250. Although the use of language for this course was not discussed in the interviews with participants, it is conceivable that in astro250, students are introduced to some of the vernacular common in professional astronomy to enculturate the students and help them prepare to speak like professional astronomers (Baleisis, 2008). Some participants talked explicitly about the differences in teaching the HR diagram between nats102 and astro250. They noted that although the concepts covered in astro250 with respect to the HR diagram would be similar to those covered in nats102,
260 the level of physical and mathematical sophistication would be increased. It appears that the astro250 students are being held more to the standards of the profession, which is not unsurprising as these students are astronomy majors.
5.4.4 Interpretive comments It is clear that the characteristics of the student population influence the selection of course goals and instructional strategies, as evidenced by the differences in goals and strategies from nats102 and astro250. In nats102 the mathematical rigor of astronomy is largely absent, whereas it would be present in astro250. This can be interpreted as the participants knowing they do not have to act as gatekeepers to the astronomy profession in the courses. The student population in nats102 is very different than in astro250 in interest, motivation, and aptitude with respect to astronomy. Talking about the nats102 course, all participants were aware that these students would never be, nor desire to be, professional astronomers. As a result, and most likely also influenced by the overhaul of the general education science curriculum in the mid-1990s and by the general education philosophy of the university, which emphasized scientific literacy (see section 3.4.2), participants deemphasized astronomy content goals, focusing more on building scientific literacy and developing an appreciation of science. One interesting aspect is that goals are sometimes used not just as an end in and of themselves, but are used to achieve other goals. Paul specifically mentioned that his showmanship (an affective construct) is meant as a hook for the students to engage them (a motivational construct) in the material so that they can become more scientifically
261 literate (a process goal. William uses a similar technique, but he uses content goals (covering a lot of content) to achieve an affect goal (students would be able to follow science news later in life). In other cases, the goals stand on their own, such as for example the case of Hugh, who stated that he wanted students “to like science”. The emphasis on process and affect goals for the course can be interpreted, though it was barely mentioned in the interviews, as participants subscribing to the Jeffersonian ideal of an informed citizenry, which states that in order for a democratic society to function, the voters (and tax payers) need to be aware of the backgrounds of policy issues (science in this case) so they can make informed decisions as to where they want policy to go. The emphasis on affect goals serves another purpose, which Hugh alluded to in his interview. Many students come into the classroom with anxiety about science and their ability to do science. Especially women and minorities can be under stereotype threat about their performance in science, and the affect and process goals can help alleviate some of that stereotype threat, by showing the students that they can like, and can do, science. The process and affect goals formulated for nats102, and the emphasis on content goals in astro250 (at the expense of affect goals), are interpreted as participants changing their goals (and instructional strategies, as will be discussed later in this chapter) based on the student population they teach. It is not clear to what extent the selection of these goals are inherent to the participants, and to what extent they are influenced by the general education science curriculum policy of the university. However, if participants do
262 not subscribe to the general education science policy of the university, they are free to set up the course in a manner of their own choosing, in accordance with the principles of academic freedom. The fact that they share the process and affect goals is indicative of the participants sharing the general education science curriculum policy of the university. Now that the assumptions and beliefs of the participants are discussed, and how those influence the goals of the course, the attention is now turned in how those beliefs, assumptions and goals are played out in the classroom in the form of the instructional strategies of the participants.
5.5 General instructional strategies 5.5.1 Assessment Participants typically use a combination of lecture, labs, and classroom demonstrations to teach the course. Table 7 below summarizes the assessment types given by the participants, with the relative weight into the final grade. Given the large nature of the class, with up to 150 students enrolled in a single section, participants rely on machine graded multiple choice exams for midterm and final examinations. Midterm Final Homework Observing Quiz Project / paper Attendance Labs Extra credit
Hugh 3 x 100 200
Jeff 2 x 15 30 20 10 10
150 N x 15 *** 100 3 x 2.5
Linda 3 x 100 200
Paul 2 x 100 100 200
150 N x 15 *** 100
100 40 60
William 3 x 15 ** 20 10 5
20 5 max
263 Total A B C D cut off % score
750 + N x 15 90, 80, 70, 60
100 + 7.5 90, 80, 65, 50
750 + N x 15 90, 80, 70, 60
700
100 + 5
90, 80, 65, 50* 83, 73, 53, 53*
Table 8: Course assessment overview * ** ***
Reserve the right to lower the standards, under no circumstances will a score lower than 50 percent be a passing grade Four midterms, drop the lowest score Students get full credit after obtaining a minimum number of participation points
Though several participants would prefer more open-ended assessments, there is no time available with usually only one teaching assistant to grade such assessments. With the exception of Paul, all participants rely for more than 60 percent of the grade on machine graded multiple-choice exams. In his interview, Paul explicitly stated that he purposefully deemphasized multiple-choice exams over the years in favor of other types of assessment. Linda mentioned that the information literacy project she and Hugh do in class is in part to allow students to show their capabilities in a different format. In addition, both Jeff and William require observing as part of the course grade. Observing is typically done with the 21 inch telescope on campus, which is operated by student workers. The observation projects are instituted with the additional reason that students expect to be looking at stars in an astronomy course. It is worth noting that all participants use an absolute grading scheme, in which the students are not in competition with one another, rather than curving the grade. Though only William notes it explicitly in his syllabus (in capital letters), this grading scheme means that students are not competing with one another for a high grade. This ostensibly sets the classroom up for a more open and trusting environment in which the
264 students are arguably more likely to engage in group work, knowing that they are not competing.
5.5.2 Classroom techniques The participants all have a distinct style in the classroom. While all use lecture as the primary mode of instruction, the implementation varies considerably, depending on the personality of the participant. Paul is a self-described theatrical instructor, who tries to make a classroom into an event that students want to go to, whereas the other participants have a more traditional lecture style. Besides lecture, participants use a variety of techniques to engage the students. An overview of in-class activities is given in Table 9. The participants place value in lecture demonstrations, labs, and observing projects. These projects, which can occur during class time (demonstrations, labs) or out of class (observing) are typically done for multiple purposes. One reason is the belief that working with real data, seeing something happening for real (as opposed to a movie), and working with instruments enhance the students’ learning experience, as it is more authentic than just talking or reading about it.
Think-pair-share Discussion Lecture Demonstrations Labs Lecture-Tutorial / in-class exercise
Hugh x x x x x x
Jeff x x x
Linda x x x x x x
Paul x x x x x
William x x
265 Table 9: Classroom activities
As was noted earlier, the content of the course is less a consideration than the process and affect goals. This flexibility with the content (using it as a vehicle to talk about science) was explored a bit further by asking the participants how they would substitute teach for someone else in the department when asked. All participants except Paul would take the approach of having the resident instructor determine the curriculum and style of the lecture. Paul on the other hand would simply take his own lecture materials for the topic and use it as if he were the main instructor for the course. This result is somewhat remarkable, as I would have expected Paul to style his substitute teaching the most toward the resident instructor, given his background in teaching and knowledge of learners. However, save for the concession that he would not use responders if the regular course did not have those (which is more a logistical concession than a pedagogical one), he would use his own lesson as-is. In chapter 6, this will be revisited briefly.
5.5.3 Teaching nats102 in the ideal world Asking participants about the teaching of nats102 in the ideal world, where resources were not a concern, gave some insight in the participants’ beliefs about teaching and learning in the nats102 course. With the exception of Paul, all participants indicated that when given unlimited resources, they would institute changes in the way the nats102 course was taught. The reason Paul did not want to change his course was
266 that he has his system in place that works well for the large classroom. The most cited change would be to reduce the number of students in the class considerably, from 150 now to about 25 to 50. Participants prefer these smaller classes to give students a better and more engaging learning environment, in which more interaction and discussion can take place. A second reason for these smaller classes is that in smaller classes disruptive behavior is less, as there is less anonymity both among the students and between the students and the instructor. Hugh mentioned that it would be a good way to be able to learn the students’ names, helping reduce disruptive behavior in class. This is of course easier in a small class than in a large class. In addition, it would allow the participants to rely less on machine graded multiple-choice exams, which they now sometimes feel forced to use due to the logistics of the course. Last, most of the participants voiced a desire to have more and better lecture demonstrations available for use in the classroom.
5.5.4 Interpretive comments These two elements, creating a more interactive, and arguably more learnercentered environment, while at the same time reducing anonymity as the main source for disruptive behavior in the classroom is interpreted as participants caring about the classroom environment and the educational opportunities of their students. In general, participants showed a rich and deep thinking about educational matters throughout the interviews and the cognitive tasks. Interview questions like “how would you characterize your teaching”, “how do you go about teaching the HR diagram”, and “why do you use
267 this strategy” were answered promptly and thoughtfully. This means that participants have thought about these issues to so promptly respond, and all were able to tell the researcher why they do what they do in the classroom. The participants in this study, who are all highly regarded in their fields, showed in their answers and in their thinking that the deeply care about their teaching and that they take their instructional responsibilities very seriously. With regards to the wish for more and better lecture demonstration material, the general belief that students learn the material better when they are working with real equipment, real data, and real experiments can be inferred. The precise reasons for this thinking remain unclear, though two possibilities can be distilled from the participants’ responses. The first is that doing science experiments is an authentic task in the sense that experiments and hands-on work are one of the cornerstones of science. The second can be a notion that actually doing things yourself is a more salient experience than just hearing about it. The belief that working with real equipment and data is important would also explain the resistance that some participants (Linda, Jeff) voiced about discontinuing the complementing astro110a lab course during the overhaul of the general education science courses at the university, as was noted earlier. By discontinuing the lab, the learning environment for the students was thus diminished in the eyes of these participants. It is also important to note that while not having as advanced a set of demonstrations may be a local issue, the issue of class size is not limited to this university. Under budget pressure, more and more large universities will revert to increasing the class size to reduce costs, which means less instructional support per
268 student and less opportunity for students to discuss the material in small groups or do experiments. Several participants also expressed frustration that the time commitments they have precluded them from exploring their teaching in more detail, and expressed a desire to have someone on staff to help them with teaching, teaching technology and lecture demonstrations. This suggests that they would be open to work with professional developers to provide them with techniques and strategies to change their teaching in a manner that is more to their liking. With regards to teaching nats102 in the ideal world, the participants realized that their wishes would go largely unfulfilled. However, their responses show that the pedagogical and curricular thinking of the participants is in part guided by the constraints set by external factors, like class size. This means that the participants try to do the best they can given the circumstances, not the best they believe it could be. In more mathematical terms, they strive for a local maximum, rather than a global maximum. Clearly, the participants in this study see room for improvement in the nats102 course.
The third cognitive task, the Pathfinder rating task, was originally envisioned to elicit more about the relationships among logistical factors that could be of influence in the day-to-day practice of teaching nats102. However, the results of this task were far from unambiguous. For this reason, the Pathfinder rating task is discussed separately and in detail in the next section.
269 5.6 Pathfinder network map In the individual participants’ case studies in chapter 4, the third cognitive task, the Pathfinder network rating task, received relatively little attention. One of the reasons for this was that the participants generally found it difficult to interpret the map and to make comments about them. In the case studies, only the measure of internal coherence was quoted, which reflects the internal consistency with which the participants did the rating task. It was mentioned there that a value of 0.2 or above reflected some confidence in the results, but additional statistics were not mentioned. In addition, a single Pathfinder map is not necessarily all that informative; it is much more revealing to compare maps to one another. Hence, in this chapter on cross case analyses, the Pathfinder maps of all participants are given more attention. Another issue regarding this cognitive task, which was not discussed in the individual case studies as it had no real place there, has to do with the validity of the Pathfinder instrument itself. In this section, the statistics of the network maps are discussed. The participants are compared to one another to examine similarity of the maps. In order to anchor the results of any network map, a reference map is needed. Typically the reference map is the “expert” map. In the case of this study, as mentioned in chapter 3, I chose my own network map which can be used as a reference. This is not to say that my map is to be considered the expert map as is commonly used in the Pathfinder literature (see e.g. Buxner (2007) for a review), but simply as a reference to give the comparisons a common ground. My network map is given below in Figure 12.
270 In order to help the reader interpret my network map, it is instructive to explain the considerations I used when doing the rating task myself. Note that this thought process not necessarily reflects my views on science education, but are instead stereotypes I thought could be present in participants. I thought of instructor-centered education as the result of several factors. These were the need to cover a large amount of content material, for which I determined lecture was the most efficient method to transmit the content to the students, given the large class size and the limited instructional support. These considerations and stereotypes led to the bottom cluster in the network map. On the other hand, with smaller classes there is more opportunity for small-group instruction and a more learner-centered pedagogy, which could lead to a better understanding of the material, as well as providing a more open and friendly classroom climate. These considerations led to the upper cluster in the diagram.
271 Figure 12: Erik’s Pathfinder network map
In the individual case studies in chapter 4, the measure for internal coherence was quoted for the participants. These values are summarized again in Table 10 below.
Internal coherence
Hugh 0.79
Jeff 0.17
William Paul 0.03 0.49
Linda 0.49
Erik 0.76
Table 10: Summary of the internal coherence measures of the participants’ maps
Note that both Jeff and William have internal coherence scores that are lower than the value of confidence of 0.2 (Interlink, 2009). A low value for coherence means that participants for whatever reason were not consistent in their ratings across the instrument. In this study, a possible reason for these low coherence values is that terms on the rating task change meaning in the minds of the participants depending on the individual rating they do. In chapter 6, this will be discussed in more detail. The second statistic provided as output from the Pathfinder software is proximity correlations, which are shown in Table 11 below. A proximity correlation is a measure of how much a participant rated exactly the same as another participant. It is a correlation measure, which is restricted to the interval [-1,1]. It is not surprising that most of the values in the table below are not close to the extremes, as participants (and me) interpret measurements on a scale from 1-9 differently (what is an “eight” for one participant may not be an “eight” for another participants). Subsequently and the likelihood of two participants rating all the 136 items (all possible combinations of 17
272 terms) identical is very small indeed. Instead, rather than focusing on the numbers per se, it is instructive to focus on the relative correlations to a reference map. If one takes my map as a reference, it can be seen that Hugh rated the most like me, and William the least.
Hugh Jeff William Paul Linda Erik
Hugh 1 0.27 -0.15 0.39 0.43 0.69
Jeff 0.27 1 0.14 0.14 0.19 0.24
William -0.15 0.14 1 0.04 0.11 0.01
Paul 0.39 0.14 0.04 1 0.36 0.49
Linda 0.43 0.19 0.11 0.36 1 0.34
Erik 0.69 0.24 0.01 0.49 0.34 1
Table 11: Network map proximity correlations
The third statistic that Pathfinder provides are the number of links between terms that participants have in common, which are given in Table 12 below. In the Pathfinder literature dealing with content areas, the number of links is often indicative of expertise. The fewer links and the sparser the map, the more expert-like the map is considered to be. In the case of this study, this inference cannot be made, as the terms are not related to a specific content area in which one can have expertise. In Table 13, the number of links is corrected for chance, giving slightly lower values. Keep in mind that there were 17 terms that were used in the map.
Hugh Jeff William Paul Linda
Hugh 20 10 10 4 5
Jeff 10 37 13 10 12
William 10 13 36 6 12
Paul 4 10 6 28 7
Linda 5 12 12 7 24
Erik 11 13 10 10 11
273 11
Erik
13
10
10
11
32
Paul -0.1 2.4 -1.4 22.2 2.1 3.4
Linda 1.5 5.5 5.6 2.1 19.8 5.4
Erik 6.3 4.3 1.5 3.4 5.4 24.5
Table 12: Number of links in common
Hugh Jeff William Paul Linda Erik
Hugh 17.1 4.6 4.7 -0.1 1.5 6.3
Jeff 4.6 26.9 3.2 2.4 5.5 4.3
William 4.7 3.2 26.5 -1.4 5.6 1.5
Table 13: Number of links in common, corrected for chance
It should be noted that these probabilistic corrections are purely mathematical, and have no “real” meaning. Values below zero in Table 13 should be regarded as zero, as it is nonsensical to have negative links in common (or decimal links in common for that matter). It is simply a correction for chance effects.
What this data reveals is that Jeff and William have many more links between the various terms (37 and 36 respectively), whereas Hugh’s map is much sparser (20 links). It is interesting to note that Hugh and Linda have very few links in common, even though they do have a high proximity correlation, are team teaching and have set up and discussed the course. Linda has more links in common with Jeff and William. In section 5.13, the cases of Linda and Hugh are compared and contrasted in more detail. Paul has very few links in common with the other participants, which is not all that surprising given how differently Paul’s classroom is organized and that his professional situation is
274 different from the other participants. Recall that Paul’s primary responsibilities are in the area of teaching, rather than research as it is for the other participants.
The fourth and last statistic given by Pathfinder show the measure of similarity of the maps, which are shown in Table 14 and the values corrected for chance are listed in Table 15. It should be noted that numbers for this parameter are typically low as it is a measure for overall similarity of the entire network maps.
Hugh Jeff William Paul Linda Erik
Hugh 1 0.21 0.22 0.09 0.13 0.27
Jeff 0.21 1 0.22 0.18 0.24 0.23
William 0.22 0.22 1 0.10 0.25 0.17
Paul 0.09 0.18 0.10 1 0.16 0.20
Linda 0.13 0.24 0.25 0.16 1 0.24
Erik 0.27 0.23 0.17 0.20 0.24 1
Linda 0.04 0.12 0.13 0.05 0.90 0.13
Erik 0.17 0.09 0.03 0.08 0.13 0.87
Table 14: Similarity of the maps to one another
Hugh Jeff William Paul Linda Erik
Hugh 0.91 0.11 0.11 -0.005 0.04 0.17
Jeff 0.11 0.84 0.06 0.05 0.12 0.09
William 0.11 0.06 0.85 -0.03 0.13 0.03
Paul -0.005 0.05 -0.03 0.88 0.05 0.08
Table 15: Similarity of the maps to one another, corrected for chance
The numbers indicate that William and Jeff are most similar to Linda, Hugh most similar to William and Jeff. Note again that the similarity between the network maps of Linda and Hugh is rather low, despite the relatively high proximity correlation value in Table 11. This means that on those items that Linda and Hugh did not rate the same
275 (dropping the proximity correlation below 1) the ratings were considerably different. Linda and Hugh are compared and contrasted in more detail in section 5.13. Paul is not really similar to any other participant Given how much different Paul’s classroom is compared to the other participants, and how Paul’s primary job is related to teaching (hence less conflict with research), this latter result is not too surprising.
No interpretive comments regarding the Pathfinder instrument are made in this section. The reason for this is that the instrument suffers from serious validity issues, making interpretations beyond descriptions suspect. As these issues are methodological in nature, they do not have a place in this chapter, but will instead be addressed in chapter 6. Nonetheless, despite the fact that the Pathfinder cognitive task was not very helpful in helping to answer the research question, there are some interesting elements that can be learned. For example the shapes of the network maps are quite different between the participants. Of special note is the difference between Linda and Hugh, as they are team teaching. In section 5.11, the cases of Linda and Hugh will be compared and contrasted in more detail.
5.7 The Hertzsprung-Russell diagram within the nats102 course Now that the general themes of assumptions about the students, student learning and the learning environment, the instructional goals and strategies have been discussed, we will discuss the special case in which these three themes were applied: the Hertzsprung-Russell diagram as a learning object in the course. Before the three themes
276 are addressed, it is useful to explore where the participants teach about the HR diagram in the course. From the syllabi, lesson plans, and the subsequent discussion in the interviews, it is clear that all participants cover the HR diagram at roughly the same time in the semester, in between properties of stars and stellar evolution. Paul and Jeff, who are on the Tuesday, Thursday schedule, cover the HR diagram around week 9 in the semester. Hugh and Linda, who are on the Monday, Wednesday, Friday schedule, cover it around week 6 or 7, though Hugh (and by extension Linda) noted that they do not cover the HR diagram as a stand-alone unit, but integrate it into lessons about the properties of stars and stellar evolution. William did not mention at what time in the semester he covers the HR diagram, but noted that he would cover it in between the same topics as the rest of the participants, from which it can be inferred that he will cover it at around the same time as the other participants. Part of the reason that the participants cover the HR diagram around the same time in the semesters is that in order for students to make sense the HR diagram, some properties of stars (temperature, luminosity) and the physics of light need to be covered (to understand how temperature and luminosity are measured). This material is usually covered later in the semester, because the textbooks the participants use for the course typically cover it in later chapters, and the participants tend to follow the textbook, as was noted earlier. The exceptions are Linda and Hugh, who do not use a textbook, but they still follow the general sequence the other participants are using. Based on its location in the course sequence as well as the integration within a larger flow chart the participants envision the students thinking about the HR diagram,
277 one can infer that the HR diagram is to be considered an advanced as well as a bridge topic. It is advanced in the sense that it requires a substantial amount of physics and properties of stars. As the participants valued this physics in their concept maps, the position in the course sequence is logical. It is a bridge topic in the sense that the HR diagram serves as a spring board to the topic of stellar evolution. This bridge function makes the HR diagram special as an example of how science works and organizes data. This will be discussed in the next section.
5.8 Instructional goals for teaching the HR diagram From the interviews and the cognitive tasks, two trends in the instructional goals for teaching the HR diagram surfaced. These were the HR diagram as an example of how science works (process goal) as well as an example of role models in science (an affect and motivational goal). In the next subsections, these two goals are explored in more detail. 5.8.1 Serving process goals In the individual case studies one common feature of the lesson plans and the concept maps was prevalent. This was that fact that participants use the HR diagram as part of a flow chart. They talk about what physics goes in, and how properties of stars are measured or inferred. Trends in the diagram are exploited as to learn something new about stars and stellar evolution. The HR diagram closely follows the course goal that all participants share: science as a process, or simply “how we know”. Participants varied in
278 the degree of detail they went into the physics. Where William’s concept map was very large and his lesson plan long enough to cover four class sessions, others’ concept maps and lesson plans were much sparser and focused less on the details of the physics. This may have had to do with the fact that William views the HR diagram as one of the most important diagrams in the course. In his interview, he placed the HR diagram on par with the Hubble diagram that is fundamental in cosmology. On the other hand, Hugh simply stated that he did not care if students understood the diagram, but he wanted them to be able to follow the stellar evolution that is inferred from the diagram. With respect to the physics of the diagram, participants placed much emphasis on which parameters were observable with telescopes and other equipment, and which of them had to be calculated using the laws of physics. For example, in his original diagram that he had drawn on his white board in his office, Paul had marked the observable and calculated variables in a different color. Jeff also indicated the observable parameters in his concept map. The emphasis again in teaching these aspects was again on what can be measure and what can be learned from these measured quantities. The participants mentioned that the HR diagram is a data organizing tool, and the trends in the diagram can be exploited. The participants would notice the trends that are apparent in the HR diagram, and guide the students to what can be inferred from those trends using the laws of physics. All this is consistent with providing an example of science as a process, or as the participants phrase it “how we know”. Participants also use the HR diagram as an example of a graph, noting that many students have difficulty with the concept of a graph, and how to read and interpret one.
279 The concept of a graph, and the pedagogy participants employ to explain a graph, is considered in more detail in section 5.10.1. However, the concept of a graph is not the only potential stumbling block for students in learning about the HR diagram. In section 5.9 various reinforcement techniques that participants use to help students better understand the material are discussed.
5.8.2 Serving affect goals: Role models Several of the participants pay attention to the human side of astronomy and place some of the discoveries in their human and historical context. In particular, they talk about the status of women in science and the impact women had in the development and understanding of the HR diagram, a topic William refers to as astro-sociology. The participants specifically mentioned the work of Annie Jump-Cannon and Cecilia PayneGaposchkin for their significant contributions in understanding the HR diagram, at a time where women were even less represented in academia and science than they are today, and were in many cases actively discriminated against. For example, women were not allowed to obtain doctorates in astronomy. The HR diagram is an excellent opportunity to confront societal stereotypes regarding women and science. The participants mention these early contributors in part because of the role model these women represent, who furthered the field of stellar astrophysics despite the deck being stacked against them. Hugh and William in particular pay attention to the sociology that surrounded the discoveries and advances in the field, and hold Annie Jump-Cannon and Cecilia Payne-Gaposchkin up as role models,
280 especially for the young women in the class who, as Hugh observed, tend to have more anxiety about doing science and have less self-confidence than the men. It is interesting to note that Linda, the only female in this study, made no explicit mention of either using the historical women to serve as a role model, or herself as a role model for the female students. Brief biographies of Cecilia Payne-Gaposchkin and Annie Jump-Cannon are given in appendix C of this dissertation.
5.8.3 Interpretive comments The participants use the HR diagram for a variety of educational objectives: a springboard to stellar evolution, as an example of data organizing, as an example of a graph and what one can infer from trends in a graph. However, none of these objectives is content related, but can all be categorized under process goals. Given the complexity and richness of the diagram, this agreement among the participants in using the HR diagram to pursue the process goals of the course is noteworthy. Rather than focusing on the content of the diagram, most participants use the diagram as an example of “how we know”. The HR diagram serves as a case in point to demonstrate how scientists collect data, organize data in graphs, and use the trends in the graph to learn something new. The details of the physics are far less important than the demonstration of how science works and how science advances. The diagram’s history, with Annie Jump-Cannon and Cecilia Payne-Gaposchkin as role models, is used in the lesson plan and apparently serves as a motivational (affect) construct to relate the process of development and advances in science to the students.
281 While all participants mentioned talking about the development of the HR diagram, not everyone listed it in the concept map of how they want the students to think about the HR diagram at the end of the course. This can be interpreted as the process goal, how the HR diagram is part of a flow chart and how data is organized, is more important than the affect goal. Though participants consider content less important than the process goals in the teaching of the HR diagram, the content is not ignored. In the next section, several reinforcement techniques the participants use to help the students understand the complex physics of the HR diagram are discussed.
5.9 The use of reinforcement techniques in teaching the HR diagram During the study, participants were asked about, and often volunteered, common student difficulties with respect to the HR diagram. The participants were asked how they would go about helping students overcome these difficulties. They offered a variety of hands-on, interactive, and learner-centered activities to help students understand the physics of the HR diagram. The central element in the physics was the Stefan-Boltzmann law, which links stellar temperature, the size of the star, and its luminosity together. Several of the techniques the participants used are discussed below.
282 5.9.1 Lecture-Tutorials and in-class exercises Several participants (Linda, Hugh, and Jeff) use (elements of) the LectureTutorials for Introductory Astronomy (Prather et al., 2008) to help reinforce concepts related to the HR diagram, in particular Stefan-Boltzmann’s law, which ties size, temperature, and luminosity together. Jeff suggests in his lesson plan to use several of these tutorials, and Linda and Hugh based their in-class exercise for the HR diagram based on one of the original tutorials, though the in-class exercise is a modified version. The tutorials were developed by people affiliated with Steward Observatory, and as such have got exposure within the department. Hugh noted that he had had conversations with Prather on several occasions regarding educational issues in nats102. Jeff was introduced to the tutorials (both the HR diagram one as well as the blackbody tutorial) by me when I was his teaching assistant in nats102. In all cases, the tutorials are used as reinforcement tools, as supplementary materials to the lecture or other activities. They were not used in lieu of lecture. This is consistent with the suggested implementation for the tutorials. The background of the (suggested) use of lecture-tutorials is discussed in one of my earlier articles (Brogt, 2007c) to which the reader is referred for additional information. While Jeff used the tutorials as-is, Linda and Hugh modified the tutorials to fit their own personal needs for the course. This is in line with what Dokter (2008) found in her examination of the use of Lecture-Tutorials for Introductory Astronomy (Prather et al., 2008), where participants used the tutorials in a way that aligned with their goals for the course and their views on teaching.
283 5.9.2 Think-pair-share In his lesson plan, Paul pays considerable attention to think-pair-share questions, which he uses in combination with electronic responder devices. Other participants are not currently using these electronic responder devices as part of their classroom. As the reader may recall, a think-pair-share question is typically a multiple choice question on which the students vote, then discuss their answer with their classmates, after which a second vote is conducted. Typically the class as a whole will gravitate toward the correct answer in the second vote, provided there is a critical mass of students that got the answer right in the first round. In the case study of Paul, the procedure for doing think-pair-share questions is outlined in more detail. Though Paul uses think-pair-share as an integral, and daily part of his classroom, he is not the only participant to use (elements of) it. In his lesson plan, Hugh suggested to quiz the students on certain questions from the in-class exercise on the HR diagram. The questions are multiple-choice like in their nature (which of the stars is larger, hotter, etc.) and Hugh uses them to hold a class vote using pieces of paper, though he did not mention whether he would have students discuss their answer with one another. Though it was not mentioned in the interviews, it is reasonable to assume that Linda adopts a similar strategy, given that she and Hugh team teach. Jeff mentioned that he would like to start using the electronic responder devices (though he did not specify their anticipated use, but think-pair-share questions are something he has seen Paul use), acknowledging that it would be a technological challenge for him, implying that he would like to have assistance in making it work effectively in the classroom.
284
5.9.3 Mastering Astronomy and (digital) labs Both Paul and William use the online system Mastering Astronomy for homework assignments. Mastering Astronomy offers simulations, applets, tutorials, and other manipulative activities to help students understand the material better. This system is described in detail in the case study of Paul. Paul noted that he can adjust the automatic grading settings in Mastering Astronomy to fit his personal strategy. Students get half credit for simply doing the assignments, regardless of how many tries they need to get the answer correct (Paul, I, 1134). Paul and William also use the Contemporary Laboratory Experiences in Astronomy (CLEA), and William uses some of the (electronic) educational materials created by the Sloan Digital Sky Survey. It should be noted that William modified those latter two materials to fit his own personal needs for the course. The same observation as made in the subsection on the Lecture-Tutorials applies here. Modifying curricular materials is something also found by Dokter (2008). In her study she noted that participants used Lecture-Tutorials in ways that aligned with their goals for the course and their views on teaching.
5.9.4 Analogies In teaching about the HR diagram, participants routinely used analogies to try to help the students understand the concepts under consideration. Nowhere was this more apparent than in the participants’ responses to the stereotypical student statements. The
285 use of analogies turned out to be so pervasive that it is discussed separately in the next section. At the end of that section, interpretations will be made for both sections.
5.10 The use of analogies to help students overcome difficulties Participants routinely used analogies to help students understand concepts about the HR diagram. In four of the six stereotypical student statements specific common misunderstandings with respect to the HR diagram and stellar astronomy were put in front of the participants with the request to respond as if a student had just said it to them. These four statements were: 1. A star starts out in the lower right, then go to the upper left, then to the upper right and then to the bottom left. What telescopes are used to observe the HR diagram and the motions of stellar evolution in the sky? 2. If a star is twice as massive, it should live twice as long, because it has twice the fuel 3. You called the stars at the top right giants, but how do we know that they are actually bigger than other stars? 4. I don’t understand how temperature can tell you about brightness
In responding to these statements, the participants primarily used analogies. Besides the use of analogies in responding to the stereotypical student statements, most participants used an analogy in explaining the concept of a graph. In Table 16 these analogies are summarized, with the numbers corresponding to the number of the
286 stereotypical student statement above. Of note is that the participants used the exact same analogies in a number of cases.
1 Hugh
2 Gas mileage
Jeff
Snapshot
Gas mileage
Linda Paul
Road map
Gluttonous Gas mileage
William
Shorthand
Gas mileage
3
Light bulbs Hot iron rod
4
Stove, forge Hot pads
Graph Height versus weight Height versus weight Height versus weight Height versus weight
Table 16: Use of analogies in the stereotypical student statements and the concept of a graph
Stereotypical student statements 3 and 4 both address the Stefan-Boltzmann law. In the case of Linda, Jeff, and Hugh this is partly dealt with in the in-class exercise or lecture-tutorial as well. The most commonly used analogies; the height versus weight, the gas mileage, and the stove burner analogy are discussed in the subsections below.
5.10.1 The height versus weight analogy The most common student problems that all participants referred to, was the concept of a graph. Participants noted that students have difficulty discriminating between a graph and a picture, which leads to the misunderstanding that the HR diagram is a picture of a constellation. Participants used an analogy they referred to as the height
287 versus weight diagram. This analogy came in two different variants, that are called variant A and variant B here. Variant A This variant of the height versus weight analogy was used by most participants to explain the HR diagram. The analogy was phrased slightly differently among participants, but the general theme was as follows. Suppose you want to find out something about how humans work. What observations can you make to help you do that? You can make a plot of properties of humans and see if there are trends in there. So let’s say you make a graph of the height of a person versus the hair color of that person. What you will find is a scatter plot, there is no apparent connection between the height of a person and his or her hair color. However, what happens if you plot the height of a person versus the weight of a person? (this is than asked at the class, and invariably someone will mention that taller people in general will be heavier than shorter people). Although there will be some scatter, there is a general trend that taller people will be heavier. So now you learned something about humans. We can do the same thing for stars, where we plot the luminosity of the star versus its temperature. And what you’ll find it that, like the height versus weight diagram, there are trends in this plot. (the analogy ends here and a discussion about the three main properties of the HRD, main sequence, white dwarfs, and red giants commences) Variant B
288 Jeff, in contrast to the other participants who used the height versus weight analogy, took the analogy one step further. Rather than setting up the example of the classroom and taking every student’s height and weight to create the diagram, he extended the analogy to also include different populations than just students. He uses an aggregate of people, from the very young to the very old and takes their heights and weights. He then uses this to predict properties of people, as he now no longer is restricted to a small subsample of humans, but spans the entire range, completely “filling” the parameter space that his humans can have.
5.10.2 The gas mileage analogy Participants brought up the gas tank analogy to illustrate why massive stars consume their hydrogen fuel a lot faster than low mass stars. Even though a bigger gas has a larger gas tank, it will have to fuel up faster than a small car, because of its poorer fuel economy. To make this analogy more accessible to the students, sometimes real car brands were invoked. The classical is one between the Hummer and a Honda Civic, though the latter seems to be replaced now by the Prius, due to its increased popularity and reputation as a very fuel efficient vehicle. Hugh mentioned that the last time he taught the class, US gas prices were very high (by American standards), and the students were quite aware of gas mileage of vehicles.
289 5.10.3 The stove burner analogy The stove burner, hot iron rod, and hot pad analogies (and to a lesser extent the light bulb analogy Paul uses) all tie into the Stefan-Boltzmann law, trying to link total energy output (luminosity) to temperature and size. The common element in these analogies is that the participants take some common household items or daily life experiences, like the stove burner, and tie the students’ life experience into the StefanBoltzmann law. The analogy, which is discussed in more detail in the case study of Hugh, works as follows. Assume you have two electric stove burners, one small and one large, and you can vary the settings from low to medium to high. Not knowing the numbers, students cannot discriminate which burner gives off most energy (measured in time to boil a pan of spaghetti) between a small burner set to the high setting, and a large burner set to a low setting. This helps the students realize that in the total energy given off by the burner, two parameters are at play. The light bulb analogy, explained in more detail in the case study of Paul, similarly ties temperature (the wattage of a lamp) and size (the number of lamps used) to the total energy output. The hot iron rod analogy, explained in a bit more detail in the case study of William, uses two iron rods of different size in a fire of the same temperature, and two fires of different temperature with identical iron rods, to make a similar analogy of temperature, size, and total energy output.
290 5.10.4 Interpretive comments Participants seem well aware of the challenges the HR diagram itself, the underlying, and inferred physics present for the nats102 students. In the teaching of the HR diagram, a rough order of questions emerges: What is a graph, how does a graph like the HR diagram get made, and what can we learn from the diagram? Each question requires understanding of the previous one. Participants have learned through experience that students do not understand what a graph is, and several pay explicit attention to what a graph represents, as understanding what a graph is and how to read one is fundamental in understanding the HR diagram. Participants employ a variety of teaching strategies and (digital) reinforcement tools to make the content clear, which suggests that content remains rather important in the HR diagram. Given that the HR diagram is used as a spring board to stellar evolution, another large topic in the nats102 course, some content emphasis is not unsurprising. The central piece of content the participants want the students to understand is the Stefan-Boltzmann law, which links size, temperature, and luminosity. This is not surprising as this law is the cornerstone of the physics of the HR diagram. With regards to the external curricular materials, it is interesting to note that participants rewrite them for their own personal use, despite their professed lack of time and/or manpower. This signals careful consideration of curricular materials, regardless of who developed them (some developers claim their products to be “research based”), so that the materials are optimally suited for the particular classroom experience the participant wants his or her students to have.
291 Participants use analogies to relate the physics of the HR diagram (both the physics going into, and inferred from the diagram) to the students in terms of daily life experiences, increasing the chance that students will understand the material through successful transfer. With regards to the use of analogies, it is not clear from the data how it came to be that participants use the exact same analogies for stellar lifetime, the concept of a graph, and to a lesser extent the Stefan-Boltzmann law. Jeff mentioned in his interview that he got the height versus weight analogy from one of Michael Zeilik’s introductory astronomy books. It could be that the other analogies have similar textbook origins. Regardless of the source of the analogies, the fact that all participants use similar analogies in similar circumstances can be interpreted as evidence of instructor pedagogical content knowledge that is shared in the community of astronomers, at least in this astronomy department.
5.11 Comparing and contrasting Hugh and Linda As mentioned elsewhere in this dissertation, Linda and Hugh are married to each other and team teach two sections of nats102 each year. It is instructive to compare and contrast their two cases as an example of a general, but instructive example of similarities and differences of pedagogical and curricular thinking of two instructors teaching the same students. In the next three subsections, Linda and Hugh are compared and contrasted on elements that emerged from their case studies; the course goals, the time they invest in their teaching, and the teaching of the HR diagram.
292 5.11.1 Course goals for nats102 Hugh and Linda have slightly different goals for the course, as the reader may recall from the individual case studies. Hugh’s goal, and only goal for the course was for the students to learn to like science (Hugh, I, 192), and other goals would flow out of that single goal. Linda on the other hands wanted for students to appreciate what science is and how scientists work (Linda, I, 282). In the second interview, both Hugh and Linda were asked if they thought their goals for the nats102 course was compatible with the other. Hugh noted that he thinks his goal is compatible with Linda’s (“they’d better be compatible”, Hugh, II, 84), because if you like science, you are also more likely to appreciate it. A peculiar detail was that he did ask in the interview what Linda’s goals were. As far as Linda’s opinion about the compatibility of course goals is concerned, it is useful to recall that in the first interview, as was mentioned in her case study, she had mentioned that the general education science courses were overhauled in the mid-1990, prompting more discussion about the goals and purposes of nats102. This eventually led to the construction of the cd-rom that Linda and Hugh now use in lieu of a textbook in the course. Linda mentioned in her second interview that she and Josh have discussed and agreed upon the goals of understanding how scientists work and to not to try to turn the students into astronomers, though they hadn’t discussed the students being able to appreciate a story in the newspaper (Linda, II, 184). Linda also noted that Hugh places more emphasis on astronomy as a cultural activity that she would have done on her own, though she does like the approach (Linda, II, 187).
293 Clearly, and not entirely unexpectedly, Linda and Hugh have thought about, and discussed their goals for the course, which are certainly compatible to one another, but also leaving some wiggle room for individual preferences. Discussions about the course happen every year with Linda and Hugh, though these discussions are more in the realm of logistics, which are part of the discussion in the next subsection.
5.11.2 Time for teaching Linda did mention that she and Hugh spend quite some time preparing the course. They usually teach in the spring semester and organize most of the logistics of the course around Thanksgiving. They do this to be well prepared for class, as they may have to rush in at the last minute due to their hectic travel schedules (Linda, I, 888). Linda mentioned that “it’s not a good idea to wing it when you’re in a rush” (Linda, I, 893). Taking the time to devote to teaching is another commonality in the cases of Linda and Hugh. As mentioned, both have large demands on their time as the result of them being principle investigators and having a fair number of graduate students and postdoctoral fellows. Yet they both demarcate clear time for their teaching and make teaching a priority. Hugh compared teaching to raising a child. He stated it as follows. you simply have to devote enough time to do it well, so at some funny level it’s what gets the time off the top. It’s a little bit like raising a child, you know, when the child needs attention, you gotta drop everything and give the child attention. Likewise you can’t get to your class twenty minutes late, cos there was some other priority. (Hugh, I, 119)
294
Linda, who is currently dealing with a lot of parties in order to get an instrument ready for integration in a space mission, sometimes brushes off people in the project. She stated: I’ve tried to keep certain chunks of time free and I’ve just told people on the project “don’t call me now”. And sometimes they’ll call me during the middle of lecture and [pause] the cell phone is off, hehe, and it’s tough luck folks. When I’m teaching, I’m teaching (Linda, I, 876) Both Linda and Hugh explicitly set time aside for their teaching, and block out the rest of the cacophony of the life of a professor when they take up their teaching responsibilities, which they take very seriously. In the teaching itself, there are some interesting differences that came out of the case studies. The teaching of Linda and Hugh is compared and contrasted in the next subsection.
5.11.3 The teaching of Linda and Hugh As a teaching team, Linda and Hugh naturally use the same curriculum, the cdrom that Hugh made. They also use the same course syllabus, assessments, and policies. As was noted in the previous two sections, the course goals of Linda and Hugh overlap as well. This overlap extends to the teaching of the HR diagram as well, with both Hugh and Linda viewing the HR diagram as a flow chart and the build-up from the history of the diagram. The emphasis is slightly different in the sense that Hugh sees the HR diagram as a tool to understand stellar evolution, while Linda sees the HR diagram more
295 as an example of how scientists organize data. These differences are minor though, as the result of the data organization means the HR diagram can be used as a tool for stellar evolution. All this is not too surprising given the common curriculum. In certain points though, the data from the interviews suggested small differences in teaching and approach. For example, in his interview Hugh stated that he does not aim for a particular audience with the level of his teaching, as he does not want to make students feel left out (Hugh, I, 192). Linda however mentioned in her interview that the course is aimed at the B-plus students (Linda, I, 336). Another difference in teaching surfaced when Linda and Hugh responded to the stereotypical student statements regarding the HR diagram. Hugh used more analogies than Linda to help the students understand the material, whereas Linda used more technical explanations. This was most visible in the response to the stereotypical student statement where the student thinks a more massive star should live longer because it has more fuel available. Linda was the only participant who did not use the analogy of a gas tank in cars, instead speaking in more technical terms about the number of hydrogen atoms colliding in the cores of stars. A last interesting difference between the cases of Linda and Hugh can be seen in the Pathfinder network maps. Although it was argued in section 5.6 that the results of the map need to be taken with a large grain of salt, it is interesting to note that when comparing the map similarities (Table 11) of Linda’s map to the other participants, hers is least like Hugh. Comparing Hugh’s map to the rest of the participants yielded that his is least like Paul’s, but the second least is Linda’s. Linda’s map has a strong central point in “scientific literacy”, while Hugh’s map does not have a strong central node. Both
296 Linda and Hugh have fewer links in common with each other than with any other participant. In the second interview, Hugh was curious if the network maps of his and Linda’s were similar, and expressed some surprise that they were not.
5.11.4 Interpretive comments The construction of the cd-rom and the topics of the course seem to be primarily set by Hugh. He took the initiative to create the cd-rom and expressed more ownership of the material than Linda did. It was interesting that though Hugh and Linda noted that they talked to each other regarding educational matters, that Hugh’s first response to the question whether he thought his and Linda’s goals were compatible was asking what her goals were. Though this may have been said facetiously (Hugh has a dry sense of humor) it is nevertheless a point to note. The goals and teaching strategies differ only slightly, and are highly compatible. The minor differences, as well as Hugh question about Linda’s goals, may have been a matter of not explicitly stating the goals or writing them down. It is also possible that with the course set in its current form that the educational discussions between Hugh and Linda are more logistical in nature, given that they both have heavy time commitments. Even with those commitments, they purposefully set time aside for their teaching, with Linda explicitly telling her contractors that she is busy with her teaching responsibilities at certain times. In the interview, she was very matter-of-factly about this, signaling that her contractors would simply have to deal with this, as teaching is part
297 of the responsibilities of a professor, that she takes that responsibility very seriously, and that teaching is a priority at times.
5.12 General concluding comments regarding the themes In the past two chapters, the participants have been presented individually and together. They have shown a wide variety of instructional styles and classroom environments, yet they shared many elements as well. Participants shared course goals, especially with regards to science as a process, but approached that goal from very different perspectives and angles. Teaching the HR diagram in the nats102 course had multiple purposes, and served process, affect, and content goals. Even in those different teaching styles there were commonalities. The use of the exact same analogies to help students understand concepts related to the HR diagram is the most prominent of those. In the sixth and final chapter of this dissertation, these data and findings are discussed in the light of the research question and the scholarly literature. After this discussion, the implications of this dissertation for future research and practice are outlined.
298 CHAPTER 6: CONCLUSIONS AND FUTURE WORK 6.1 Introduction In this last chapter of the dissertation, the results that were presented in chapter 4 and 5 are summarized, discussed in light of the research question, and placed into the literature context that was discussed in chapter 2. To remind the reader, the dissertation set out to answer the research question What is the pedagogical and curricular thinking of professional astronomers when teaching the Hertzsprung-Russell diagram and to what ideas is this thinking related? This chapter is set up as follows. In the next section, the findings of the study are summarized. In sections 6.3 and 6.4, the findings are placed within the context of the literature on instructor beliefs and pedagogical content knowledge respectively. In section 6.5, some of the morality issues on teaching are discussed. In section 6.6 several methodological issues that emerged in this study are addressed and in section 6.7, the overall impact of the dissertation in light of the findings and the literature is discussed. Section 6.8 and 6.9 address the implications of the study, for science education research and for practice respectively. Finally, in section 6.10, the final concluding remarks of this dissertation are made.
299 6.2 Summary of the findings In this dissertation, several variables were found that influence the curricular and pedagogical thinking of faculty, both with regards to the introductory astronomy course in general and the teaching of the HR diagram in particular. In the previous chapter, broad themes in thinking were identified from the individual case studies and discussed. Taken together, these themes help answer the research question noted above. Pedagogical and curricular thinking about the HR diagram cannot be seen independently from pedagogical and curricular thinking regarding course goals and course structures. The primary factor which is driving the decisions of the participants with regards to the course is the audience; the non-science major students. Participants were well aware that they were teaching a non-science major population consisting of people who are not necessarily interested in, good at, and quite typically afraid of, science. Perhaps as a result, the goals of the course in general were typically not content based, but focused instead on process and affect. In the process domain, participants focused on scientific literacy, reasoning and problem solving, and science as a process. Participants wanted to give the students an idea of what it is scientists do, how scientists think, get them to practice and appreciate that way of thinking. In the affective domain, participants focused on liking and appreciating science, empowerment and lessening of science anxiety. Participants were aware of the fact that the course serves a large fraction of the undergraduates, and for many of these students the nats102 course would serve as a terminal science course, meaning that the participants could do a lot to promote scientific literacy and interest in science in undergraduate non-science major students.
300
Following those science as a process goal, the participants used the teaching of the HR diagram as a case in point, as an example of scientific thinking. Participants used the HR diagram as a means to show how scientists organize data, the difference between observed and calculated variables, and the use of trends in the data. As William mentioned in his interview, the first thing an astronomer does with data is to plot it. Graphs and diagrams are extremely important in the daily practice of science to make data visible and to identify trends that can be used. Students on the other hand seem to focus more on the written word.
Participants used a wide variety of instructional methods with regards to the HR diagram, though the primary mode of instruction remains the in-class lecture. These methods primary goal is to reinforce the concepts of the class that students typically have difficulty with in the content, especially the Stefan-Boltzmann law. Participants use demonstrations and labs, following their belief that students learn best through working with real data and real equipment. As such, the demonstrations and labs serve a goal that is in line with the instructor’s belief of good pedagogy.
So in conclusion, answering the research question listed above, one could say the following. The HR diagram is taught at a specific place in the course sequence, based on the need to cover some prerequisite physics and the place the HR diagram is allotted in the
301 textbooks the participants use, which they follow to accommodate students’ wishes. Each participant teaches the HR diagram slightly differently, but there is a common core in which the HR diagram is seen as part of a flow chart using input physics that is organized in the diagram, after which inferences can be made for stellar evolution. The HR diagram is used as an example of how scientists organize data and learn something from trends in graphs, which is in line with the general course goal of the process of science. The content of the HR diagram is less important than the ideas the diagram conveys. This is done because participants know that for most students nats102 is the terminal science course, and conveying the message of what science is, how it works, and getting students to like and appreciate science is considered more important than conveying a body of knowledge. Participants build up to the concept of the diagram as to not overwhelm students with too much information and use learner-centered activities like and analogies to help students understand the potentially difficult points in the HR diagram, in particular the concept of a graph and what it denotes, and the StefanBoltzmann law. Put in a broader context, one can say that faculty members, when faced with the task of teaching complex content to non-majors, reinterpret the science content from content goals to affect and process goals. The HR diagram serves as an example of that reinterpretation process. Its complex nature and the history of the development of the diagram offer opportunities to touch on the process and affect goals of the course and open avenues to talk about the history and sociology of astronomy, and science in general.
302 In the next two sections, these findings are placed within the context of the literature on instructor beliefs and pedagogical content knowledge.
6.3 Relations to the literature on instructor beliefs Most of the research on instructor beliefs seems to be an ill fit for this study. The participants are not easily classifiable, indicating that the nature of instructor beliefs in higher education in complex, flexible, or both. In this section, I contrast this study with the notions in the literature about instructor beliefs and argue that the participants in this study were more guided by a pragmatic approach to teaching than by deeply held beliefs about teaching and learning. In Dall’Alba (1991) list of conceptions of teaching that was mentioned in chapter 2, the participants in this study latch onto two out of those seven in their teaching of the HR diagram. Those are “teaching as illustrating the application of theory to practice” and “teaching as developing concepts/principles and their interactions”. The other conceptions of teaching Dall’Alba mention are much less important in this case. This may have to do with the de-emphasis of content and the prominence of cognitive and affect goals. In the same vein, this study does not really follow the Kember (1997) division of “teacher-centered, content-oriented” and “student-centered, learner-oriented” (with their subdivisions) scheme of instructor beliefs. It also does not does fit the third category in which more student-instructor interaction would take place (Kember & Kwan, 2000). All these divisions assume that the goal is to have an understanding or mastery of content.
303 However, in this study content knowledge was the least important goal the participants cited. If anything, the participants are more teacher-centered, learner-oriented, though the teacher-centeredness appears to be largely due to the large class size. They are learner-oriented in the sense that they have adapted their course goals and teaching approaches to fit the particular target audience. Based on the participants’ responses to the question how they would approach their teaching in the ideal world, where most of them would make class sizes smaller, one can conclude that teacher-centeredness is not the result of a belief, but rather a pragmatic consideration given the environment of the classroom. Kokkelenberg, Dillon and Christy (2008) in a large study of 760,000 students at a large university in the northeastern United States showed that class size negatively impacts grades. McKeachie and Svinicki note that (2006) that large classes increase the feeling of anonymity for students, which leads to a diminished sense of personal responsibility for the class, which can be detrimental to learning. In his interview Hugh described how pedagogically powerful he thought learning the students’ names is (Hugh, I, 254), again showing both concern for the students’ learning environment and a pragmatic approach to classroom management.
Most participants seem to take a pragmatic approach to teaching, and there is little evidence in the data that they were guided by strongly held beliefs about teaching and learning. Instead, they seemed to rely mostly on the experience they had teaching the course and the observations they made in those classes. This pragmatism also showed up in the approach participants took to substitute teaching, where they would adapt their
304 teaching and materials to fit the style of the particular instructor they would be substitute teaching for. The exception to this is Paul, who seemed to hold somewhat stronger beliefs about teaching and learning, though his beliefs were founded in the data provided by educational research. Paul’s classroom is arguably the most learner-centered of the participants, and Paul was the only participant to bring up educational research in the interviews. Though Paul showed less flexibility in adapting his teaching to other instructors in the case of substitute teaching; he noted he would take his own lesson and use it, he was flexible in the content of his course should some topic in astronomy become a news event. This “mixed flexibility” stand in contrast to what Rahilly and Saroyan (Rahilly & Saroyan, 1997a) where award-winning teachers like to adapt their teaching on the fly. Though one could speculate on why Paul shows this mixed flexibility, there is no data in this study to verify such assertions.
Instructor beliefs are noted in the literature to influence course and lesson planning (Stark, 2000) and guide practice This was most obvious in the exploration of the differences in teaching between nats102 and astro250, where participants would change the format of the instruction to the audience. Part of this change may be due to the fact that the role of the instructor changes in these classes. In astro250, instructors may see themselves more as gatekeepers to the discipline and profession, which guides the shift of course goals.
305 The homogeneous goal of “how scientists know” in the nats102 class is consistent with Quinlan (1999), who noted that the history academics in her study agreed on course goals for the introductory course. However, in this study, part of the reason for the homogeneity may be the result of influences from the general education goals of the university. Despite the homogeneity in the course goals, some variation of course existed, especially in conceptualization of the content. However, the observation made by Veal and Kubasko (2003) that the professional background of an instructor plays a role in content representation could not be found, not surprising as the participants were all astronomers (or physicists who have worked in astronomy for 30 years, in the case of Linda and Hugh). The only difference in content representation of the HR diagram was the relative focus on the HR diagram itself; William assigned much more importance to the diagram than for example Hugh, who focused more on the applications of the diagram to stellar evolution. However, it would be premature to conclude that that is because Hugh and William have different backgrounds, as the difference in course goals and teaching approaches can be used to explain this difference as well. The differences were small compared to the differences in conceptions about the concepts that Southerland et al. (2003) found, but this is most likely due to the fact that Southerland et al. looked at the concept of the “nature of science”, which is more nebulous than the more concrete (but still complex) concept of the HR diagram.
306 As noted, the participants in this study seemed to be guided primarily by pragmatic considerations, rather than deeply held beliefs teaching and learning. The target audience seemed to determine the goals for the course. In the case of nats102 the emphasis was put on affect and process goals, in the case of astro250 the emphasis was more on content. Once goals were established, participants moved to achieve those goals. How to achieve those goals is the domain of pedagogical content knowledge, which is discussed in the next section.
6.4 Relations to the literature on pedagogical content knowledge Pedagogical content knowledge, in the form it was discussed in chapter 2, defined the construct as the craft knowledge to mold subject matter in a form suitable for teaching (Carter, 1990; Doyle, 1992; Shulman, 1986b, 1987, 2004; Van Driel et al., 1998). However, it is a question whether this definition is sufficient with regards to this dissertation. Recall that the main objective of the participants was not content per se. Rather, the content was used as a vehicle to reach other goals; learning to like science, understanding how science works, being able to follow a story in the newspaper. In other words, the content was a means to an end, and not an end in itself. The participants reframed the astronomy content to pursue those goals (Lundgren, 1976). Because participants reframed the content to suit a particular audience, the original definition of pedagogical content knowledge needs to be refined to reflect this. Rather than pedagogical content knowledge being a representation of subject matter that is suitable for teaching, it should be expressed as “representation of subject matter
307 suitable for teaching a specific audience to reach a specific educational objective”. This definition reflects the target audience and the teaching goal as additional variables. Though the target audience is implied in the word “teaching”, making it explicit avoids the potential confusion that teaching can be done in vacuo, independent of the target audience. One could also argue that the setting of the educational objective reflects the instructors’ values, making values part of the construct of pedagogical content knowledge, as was argued by Gudmundsdottir (1990). Though I do not argue that values and beliefs shape the selection of content and the formulation of goals for a course, I would be hesitant to include values and beliefs in the construct of pedagogical content knowledge. This is because pedagogical content knowledge is inherently craft knowledge and as such, it is more concerned with how something is accomplished, rather than why something is accomplished. Following the taxonomy of pedagogical content knowledge as mentioned by Veal and Makinster (1999) and Magnusson et al. (1999) I argue that the analogies the participants used are examples of topic-specific pedagogical content knowledge with respect to the physics of the HR diagram. It is not unambiguously clear what the source of this topic-specific pedagogical content knowledge is. Jeff noted that he had got some of the analogies from a popular introductory astronomy textbook, which may be true for other participants as well, though this is difficult to pinpoint, as most participants have used various books and editions over the years.
308 6.5 The morality of teaching As was mentioned several times in chapter 4 and 5, participants’ goals for the course are primarily affect and process related, rather than content related. This is in part due to the demographics of the classroom. The participants mentioned that for most of the students, nats102 will be the terminal science course, so trying to cover content is seen as less important as conveying the methods of science and an attitude about science. This sets up the students to be able to explore science in a more content related fashion on their own, but in order to do that, they have to be motivated first. Participants in the study mentioned the importance of giving students an idea of what science is, how it works, and try to lesson typical student anxiety regarding science, with the purpose of when the students encounter science later in life or in the media, they will stay engaged rather than “flip the channel”. In a sense, this can be interpreted as a moral component of the instruction (Lortie, 1975),with the purpose of making students “good citizens”, in the meaning of the students begin informed about the world in which they live. This follows the old Jeffersonian ideal of having an informed citizenry as essential for the functioning of a democratic society. Science literacy, one of the goals of the university’s general education program, and a goal of all participants, follows this tradition in that way. A second moral aspect of the participants in their teaching is the creation of interest. Though it can be argued that this is more a pedagogical tool to keep disruptive behavior from the classroom, it cannot be seen separate from the motivational aspects.
309 Participants use daily life examples an in numerous cases actively tie the course material to events happening on Earth (for example William’s Yucca mountain example). By doing this, the participants follow in the footsteps of the words of Dewey in The Child and the Curriculum (Dewey, 1902), where he mentioned that the content can be developed by identifying aspects of the curriculum within the student. In other words, the content needs to be related to the students, so that they see that parts of the content are already part of their experience. Participants then used their expert knowledge to guide the students to where they want them to be with regards to the content. Putting the words of Dewey in a more modern psychological perspective, one can use subjective task value model of Eccles et al. (Eccles (Parsons) et al., 1983; Eccles, Wigfield, & Schiefele, 1998; Wigfield & Eccles, 1992) the utility value and the intrinsic motivation have to be triggered in order for a student to engage in a task, in this case learning about science later in life. The fact that the course goals are not content based raises some interesting issues regarding the current trend in astronomy education research to use concept inventories as diagnostics for course effectiveness. These are discussed in section 6.7.3. A last point where participants engaged in a moral point is in the discussion of the role of women in science. The HR diagram in that respect serves as a prime example, as major contributions in this field have been made by women, especially in a time where women were largely, if not completely, excluded from academia. The HR diagram allows for touching on these subjects in a natural way, as it is part of the content and part of the history, which participants wanted to cover anyway as it ties in to the overall
310 course goal on how science works and progresses. Highlighting the contributions of women in astronomy arguably serves as a role model for the young women in the classroom. It may also help to lessen stereotype threat regarding women and math and science. Though there is no direct evidence that participants challenged the stereotype threat directly, raising awareness of these contributions may help decrease anxiety caused by stereotype threat, which has been shown to be beneficial to performance (Johns, Schmader, & Martens, 2005).
6.6 Methodological comments In this dissertation, two aspects of the methodology had some unexpected effects. These were the Pathfinder rating task and the concept map task, where the Pathfinder task performed worse than expected, and the concept map better than expected. Both issues are discussed below.
6.6.1 Conclusions regarding the Pathfinder network task As was mentioned in chapter 5, the Pathfinder instrument used in this study had some issues regarding validity, which means that it was not clear whether the instrument was measuring what it was supposed to be measuring. These validity issues stem from two sources: internal and external validation. With regards to the external validity, the main problem with the Pathfinder rating task as it was used in this study was that the terms were not validated on a larger sample, specifically a sample of people who had
311 been determined to be different types of pedagogical thinkers by some other means, before administering the instrument to the participants. The internal validity issues stem from the fact that the terms may have been too vague. A large fraction of the literature on the Pathfinder technique is using terms that deal with a specific content area (Buxner, 2007, 2009), and as such are much more narrowly defined. However, as soon as terms get introduced that can be interpreted in multiple ways, validity issues arise. If this room for interpretation is present, it is not clear how the term is used by a particular participant, which incurs serious measurement issues, specifically with regards to the instrument validity (Buxner, personal communication, 2009). For example, consider the following hypothetical situation. The term “lack of resources” could be interpreted differently in the rating “lack of resources” versus “large classroom” as compared to the rating “lack of resources” versus “lack of time”. In the former, one could conceivably think about “lack of resources” as a lack of classroom demonstrations one could do in a large classroom, or a lack of support staff to give alternatives to machine graded exams. In the latter, one could argue that the rating triggers the notion of time as a resource, changing the meaning of the term from rating to rating. There is some evidence that this was indeed what happened in the participants. In the second interview, William questioned the use of the instrument. According to him, the ratings were either trivially equal, to diametrically opposed. For this reason, he mainly used 1 and 9 to rate the task (the two extremes), leading to a range restriction which could have been an influence in his low internal coherence score.
312 As a quantitative instrument to measure (logistical) constraints on the course the Pathfinder rating task did not yield useful information to be used as a triangulation method for the qualitative work, nor was it all that useful to generate discussion in the interview. As a conversation starter in the second interview, the instrument failed. Participants, when seeing the resulting map during the second interview, found the map hard to interpret and could not give much meaningful commentary. Yet, it would go too far to label the Pathfinder task a failure. Though there was little direct use of the task to help answer the research question, it makes a methodological point. When dealing with multidimensional constructs, which refers to the fact that terms can be interpreted differently from moment to moment, like the terms in this task that triggered beliefs, emotions and feelings, a quantitative instrument is less useful than a qualitative instrument, as the quantitative instrument must assume unidimensionality for validity purposes. If an item on a test can be interpreted in multiple ways, it adds a dimension to the item, which makes the answer not easily interpretable, as the participants may have chosen an answer for multiple reasons, which the researcher cannot discriminate using only the quantitative data. The terms used in this study were very rich, so the null result is not surprising. For future research, quantitative instruments may not be useful to examine emotive terms like learner-centered teaching and beliefs. A qualitative instrument does not suffer from this validity problem, but is of course less easy to use on large samples. In conclusion, the Pathfinder rating task used in this study suffered from validity issues, which made the result difficult to interpret. This supports the primarily
313 methodological design of the study, which was qualitative in nature, emotions and feelings are difficult to capture in a valid manner using a quantitative instrument. In addition, the potential of interpreting terms in multiple ways needs to be addressed and more attention also needs to be paid to the validity of the instrument before any meaningful conclusions can be drawn from this cognitive task (Buxner, personal communication, 2009).
6.6.2 Concept maps and lesson plans as pedagogical tools An interesting side effect of this study was that several participants noted that they had got ideas for the nats102 classroom as a result of participating. Although it had been considered as a possibility that participants would become more aware and reflective of their teaching as a result of participating (see chapter 3, section 2), the possibility had been considered to be remote. However, both Hugh and Jeff mentioned in their respective case studies that they got pedagogical ideas from the cognitive tasks. Hugh mentioned that he got an idea of using students’ height and weights to create a height versus weight diagram for the class from doing the lesson plan and concept map tasks. Though he already uses the analogy of the height versus weight diagram in his classroom he wanted to make it more interactive with the students, to gain more buy-in and interest, and use their height and weight data (anonymously) to make a class height and weight diagram. Jeff noted that he should spend more time on the concept of a graph in class and noted he would use the concept map to help explain to students how to study the HR
314 diagram for the test. Though the finding only occurred in one participant and should be investigated further, it appears that having instructors make a concept map of how they want their students to think about a topic can be a powerful tool for teaching, teacher preparation, and professional development.
6.7 Impact of this dissertation This dissertation has been a study of pedagogical and curricular thinking, and pedagogical content knowledge in action, where the decisions of the participants were mitigated by their views on how the nats102 course should be taught, given the constraints under which the participants operate. This study adds to the literature in three main areas. The first is that not much research has been done on the pedagogical content knowledge of college science faculty. This study showed that science faculty teaching the non-science major courses have complex thoughts about the goals for the course, the students, and the representation of the content, and have common strategies and analogies in dealing with student academic difficulties. The origin of these thoughts seems to be primarily experience, as the participants in this study had no prior training in teaching. The implications of the use of analogies and metaphors for future research are discussed in section 6.8.1. The second contribution of this dissertation is the difference in focus on pedagogical content knowledge, putting the content aspect in a different light. It was found that for the introductory astronomy course for non-science majors, content goals are not as prevalent as process and affect goals. This means that in the case of
315 investigating instructor pedagogical content knowledge in non-science major courses explicit attention should be paid to these non content related goals. In section 6.8.2 the implications for future research on pedagogical content knowledge in these non-science major introductory courses are discussed. The fact that the participants deemphasized content goals in favor of affect and process goals also has consequences for the evaluation of courses. In section 6.8.3 this is discussed in more detail.
Studying science faculty is important precisely because they have had no teacher preparation, yet they are teaching important and high enrollment courses. A significant number of students taking general education science courses expressed interested in obtaining teacher certification at some point (Lawrenz, Huffman, & Appeldoorn, 2005) and for a large number of students, an introductory college science course serves not as an introductory, but as a terminal science course. Promote science literacy among the students are part of the goals of the general education science courses at the university and are especially relevant for students who go on to become elementary teachers, as they will have to teach the material to children themselves. This study showed that science faculty have clear reasons for conducting their classes in the way that they do. Yet some commented that they had not reached their own educational goals and would like assistance reaching those goals. By studying the pedagogical content knowledge of faculty, it may be possible to design professional development that is better tailored to faculty and more relevant to their own circumstances. In section 6.8 this is discussed in more detail.
316
6.8 Implications for research The results of this study point at several potential avenues for current future research. In this section, three of these research directions are highlighted. They deal with the use of analogies and metaphors in classrooms, pedagogical content knowledge in faculty, and the use of diagnostic tests.
6.8.1 The use of analogies and metaphors In her dissertation, Dokter (2008) examined the metaphors instructors use to describe their teaching. She did not examine the metaphors used to represent content. In this dissertation, it was found that instructors use analogies to help students understand the content. In addition, the used analogies were very similar. Building on Dokter’s work and this dissertation, it would be interesting to explore the metaphors and analogies used in astronomy in more depth, to determine how and when analogies are used, and to what extent they help or hinder student learning. For example, astronomers use the metaphor of living beings to describe aspects of stellar evolution. Stars are “born”, “live”, and “die”. This analogy may help connect and relate the concept of a star to students, by representing it as a living being, making the analogy useful from a motivational point of view. However, some of the analogies and metaphors used can actually introduce or strengthen incorrect student ideas. For example, the common use of the phrase “burning” in reference to the fusion processes of hydrogen in the cores of
317 stars, can lead to students thinking about chemical burning, which is much closer to their own experiences, rather than a nuclear process. However, the phrase “burning” is part of the astronomical jargon, which leads to an interesting dilemma for introductory courses for majors, as was alluded to in chapter 5. As an instructor in such a course, would one use the phrase “burning” for example? On one hand, the instructor may choose to use it, as part of initiation into the world of professional astronomy, but on the other hand the instructor may be hesitant to either introduce, or reinforce an existing misunderstanding about stellar physics. It would be of interest to see under which circumstances which analogies are used to gain a better understanding of the operational definition of pedagogical content knowledge in astronomy. Pedagogical content knowledge is the art of making the content accessible to a particular audience to reach an educational objective. Using that logic, the representation of the content will vary depending on the audience. It would also give an indication on when instructors start to see the students as junior peers, rather than students, assuming that among peers, more specific jargon is used.
6.8.2 Pedagogical content knowledge of science faculty The participants in this study shared similar goals for the course as has been mentioned throughout the dissertation, but chose different approaches to reach those goals, in part based on the participants’ personalities and beliefs about teaching and learning. However, the number of similarities was quite large. The similarities in approach the faculty showed toward the course materials, from the general sequencing of
318 the course to the use of similar pedagogical tools. It is not clear where these similarities come from, though most likely the teaching environment; the large class size, the limits of time and instructional support, play a role. However, it may also be indicative of an underlying structure of pedagogical content knowledge that the participants, and maybe even the community of astronomy, share. A logical follow-up on this study would be to expand the types of introductory astronomy classes to include both large and small class sizes, different levels of instructional and technological support, instructors of different academic rank, among other things. This would give an indication whether the similarities in structure are due to external factors, or whether they are part of the communal teaching knowledge of astronomy. A second follow-up would be to study faculty with a more diverse range of teaching experiences than was the case in this dissertation. All participants in this study had been teaching for at least 15 years at this university, meaning they are well acquainted with the student population and demographics. This knowledge of learners is one of the aspects McAlpine and Weston (2000) note in experienced teachers (in their scale novice, experienced, award winning instructors). However, in this dissertation that distinction could not be made, though Paul had won an award for his teaching. Investigating instructors with less knowledge of the students or less experience teaching would provide additional information on which aspects of the findings are part of the pedagogical capital of astronomy and which are part of experience with the demographic.
319 Pedagogical capital in this sense is define as the shared understanding within a community on pedagogical matters. Another important aspect to consider is the non-content based goals of the instruction, which appeared as a major finding in this study. As most of the research on instructors has been done with improving student (cognitive) performance in mind, it would be interesting to explore the other goals for teaching the introductory astronomy course for non-science majors in more detail. In the next subsection, the moral and motivational aspects of teaching are discussed. One study one might do is to examine astronomy instructors, with no formal training in teaching or pedagogy, at different stages in their astronomy career and make an inventory of their pedagogical tools and thinking with regards to a piece of content, for example the HR diagram. If there is a common set of pedagogical tools and thinking one can argue that that set is the pedagogical capital of the discipline, whereas the rest can be attributed to experience in the field. This study would be analogous to the HR diagram itself. We cannot follow an individual from undergraduate to professor, much like we cannot follow a single star over the course of its lifetime. Yet, by examining a large enough sample of astronomers, we can learn something about the pedagogy in the discipline, much like we can learn about stellar evolution by examining a large number of stars.
320 6.8.3 Implication for the use of diagnostic tests to assess course effectiveness The focus of the research has been on student misconceptions and the development of curricular materials to help students overcome these misconceptions. One way of measuring how much students learned is through the use of concept inventories. Concept inventories are multiple-choice diagnostic instruments to assess students (conceptual) knowledge about a certain topic. By administering these diagnostics pre and post instruction, the growth in knowledge can be measured. In a often cited study, Richard Hake (1998) used several diagnostic tools in physics to ascertain instructional effectiveness, concluding that traditional lecture based courses were less effective in obtaining growth than what he called “interactive engagement” classes. However, the instruments Hake examined were very topic specific, dealing with classical Newtonian mechanics, which, while usually a course on its own in the college physics curriculum, only a very small aspect of physics. In addition, it should be noted the instruments in physics were designed for classes in which the students were expected to need physics later in their (academic) careers (physics for majors, engineers, nursing, etc.) rather than a non-science major population that is more commonly found in the nats102, or astro101 courses that fulfill a general education science requirement as part of the liberal arts curriculum. In an introductory astronomy course, a large number of topics are typically addressed; many more than in an introductory classical mechanics course. It is not impossible, but highly impractical, to create a diagnostic covering all off astronomy. In order to obtain good item statistics, each concept has to be covered by multiple questions,
321 which could easily lead to an instrument of 200 items or more. One much smaller diagnostic was developed, the Astronomy Diagnostic Test (Zeilik, 2003), which could not make the same discrimination in course effectiveness (as measured by growth in content knowledge) as the instruments in physics (Brogt, Sabers et al., 2007). Instead, the trend has been over the last few years to develop single-topic diagnostic instruments for the introductory astronomy class. Several such instruments have become available in the last few years, on topics such as phases of the moon (Lindell, 2001), properties of stars (Bailey, 2006), the greenhouse effect (Keller, 2006), and light and spectra (Bardar, 2006). However, in the light of the results of this dissertation, some questions can be asked about the usefulness of these instruments, besides the obvious fallacy to assess the effectiveness of an entire course on a single topic from that course, which may or may not have gotten much attention in class. There is more to an introductory astronomy class than content, and students are more than a collection of misconceptions to be measured and fixed. The main concern of these concept inventory instruments is that they are based on content, and course effectiveness is based on knowledge growth in the content. However, as has become clear in this study, the participants in this study did not consider content to be all that important in the nats102 class. Affective and process goals were much more important to the participants than conveying a body of knowledge. As such, one could raise questions about using content diagnostics as a measure of course effectiveness, as well as the use of misconceptions research if content knowledge is not the primary goal of instruction. Rather, different instruments could be
322 used to assess the goals set forth by the instructor. For example, one of the affective goals was for students to feel empowered in their ability to do science and to not be afraid of science. A content measure will not assess whether that goal has been met. A much more useful diagnostic in this case would be the Science Anxiety Questionnaire as it was used by Udo et al. with undergraduate non-science major students (Udo et al., 2004).
In conclusion, one can argue from the points made in this section that when studying the non-science major science classes, careful attention needs to be paid to the goals of the classroom and the constraints placed upon individual faculty members in terms of class size, time and resources. The class is about more than students learning the material; it is about the complex interactions among instructor, students, curriculum, and setting. The pedagogical and curricular decisions made by an instructor will be influenced by the goals, their own experiences and comfort level in teaching, and the constraints under which they operate. Examining teaching in action cannot be seen separate from the context in which that teaching is occurring, and instructors may make decisions not based on what they think is best, but by what they think is best considering the situation in which they find themselves. The study design and instrumentation used to examine the teaching and learning should reflect this complex landscape of parameters, and a diagnostic test, covering one single subject of a broad course, is an insufficient measurement tool to draw conclusions about the effectiveness or quality of the course.
323 6.9 Implications for practice Besides implications for the world of science education research, this dissertation also hints at some more practical and more directly applicable implication. These implications are primarily within the realm of professional development of faculty. In this dissertation, care was taken to steer clear of anything that the participants could see as being judgmental with respect to their teaching, in order to create and preserve rapport. Yet some of the results clearly have implications for professional development of faculty, and as such need to be addressed. Several of the participants regretted the fact that they had received no assistance or induction in teaching. Jeff referred to this as “being thrown into the deep” when he became a faculty member and suddenly had teaching responsibilities. In a sense, the lack of induction into the teaching responsibilities is ironic. In the initiation of a young astronomer into the research world the apprenticeship model is the norm, akin to what Lortie (1975) refers to as socialization into the profession. In astronomy, the apprenticeship model is the norm for research. One does small projects under the supervision of a faculty member, leading up to a master’s thesis and finally a doctoral dissertation. Supervision and induction are the norm in the training of a researcher, yet the teaching component of being a professor does not seem to merit such an induction process. Instead, as instructors scientists are expected to perform all duties of the instructor right away the first time they are teaching. As a faculty member, especially those who do not have tenure yet in the American system, the pressure to produce research is large. Even though the participants in this study either have tenure or are not
324 on the tenure track, it is not surprising, given the other demands on their time, that they noted that they do not have the time to reinvent the wheel in educational matters. Though this naturally signals awareness of that wheel being invented in the first place, it also indicates that participants are aware that they can do something different with the classroom to help them achieve their instructional goals. Participants mentioned several things that could be done, but are currently unable to. Jeff mentions that observing effective teachers in the classroom would be a way to become more proficient in teaching as a new instructor, though he mentions that there are hardly any opportunities for that in the department (Jeff, I, 474), a view that is seconded in a sense by William when he used to stand by the open classroom door and listen in on how other professors were teaching, but that he can no longer do so now that the nats102 class has been moved to a large lecture hall (William, I, 144). Following the idea of wanting to do something different but not having the time is the remark made by Hugh, who mentioned that he does not have the time to develop materials from scratch (even though he developed the cd-rom). Constraints such as large class size, classroom infrastructure, student preparation were also cited by Henderson and Dancy (2008) in their study about reasons why physics faculty did not use curriculum based on physics education research, but used traditional techniques instead. Not surprisingly, some participants expressed a desire to have someone on staff to help them with more and better lecture demonstrations and / or the implementation of learner-centered technologies in the classroom. Taking this idea of a staff person one step further, we arrive at what Offerdahl (2008) calls a “knowledgeable other” in her
325 dissertation. In her work, faculty collaborated with an in-house professional developer, who had a high level of content knowledge about the topics that the faculty were teaching, to modify their instruction. The knowledgeable other serves as a go-to person for educational matters, much in the sense that Paul is for the department, but would also engage in professional development of faculty, working with them in long-term one-onone situations. These situations can be quite fruitful for the instructor in the sense that he or she can experiment in a more apprenticeship like model, though without being a formal apprentice or junior partner in the relationship. It could also be beneficial when the knowledgeable other is outside the regular academic chain of command, as to avoid any implication of the instructor being evaluated. In a previous professional development case I was involved in (Brogt, 2007b), the professional developers were present to help plan and execute the instruction, as part of their “regular” teaching assistant jobs. Engaging in professional development with faculty comes with a few caveats, which are all the more relevant in the light of the results of this study. Given that all participants had very clear ideas of why they were doing what they were doing, a professional development assumption that instructors somehow need to be “fixed” to a particular method of teaching is likely to encounter resistance from the instructors. To be adopted, a practice needs to be seen as consistent with the instructor personality and way of doing things (Dokter, 2008; Lortie, 1975). This is also the model of professional development that I personally subscribe to; working with faculty from their starting point, and helping them get to where they want to be. In the course of this study, two methods that were part of the instrumentation of this study, the first and second cognitive tasks in
326 which the participants make a lesson plan and a concept map on how they want students to think about the topic afterwards, may be useful to help participants think about teaching.
6.10 Final concluding remarks In teaching the HR diagram in introductory astronomy courses for non-science majors, the participants faced, and made, many pedagogical and curricular decisions. This dissertation showed that these decisions are pragmatic, and grounded in the target audience of non-science majors and the educational objectives that participants set. It was argued that the definition of pedagogical content knowledge needs to be amended to include specific educational objectives. The participants in this study gave articulate and well thought-out reasons for conducting the class in the way that they do.
327 APPENDIX A: INSTITUTIONAL REVIEW BOARD APPROVAL MATERIALS A.I: APPROVAL AND AMENDMENT FORM
328
329 A.II: SITE AUTHORIZATION
330 A.III: RECRUITMENT EMAIL / LETTER Dear Professor, As you may know, I am a graduate student in Teaching and Teacher Education where I focus on astronomy education. My dissertation research concerns pedagogical and curricular decision making processes of professional astronomers and I am particularly interested in those processes as applied to the teaching of non-science majors. As you are teaching, or have recently taught, the introductory course for non-science majors, I am very interested in your ideas. With this letter, I would like to formally invite you to become part of my dissertation study, titled “Pedagogical and Curricular Decisions of Professional Astronomers Teaching the Hertzsprung-Russell Diagram in Introductory Astronomy Courses for Non-Science Majors”. The study will consist of 2 interviews, several cognitive tasks and questionnaires, and classroom observations if you are scheduled to teach the introductory course. I anticipate the total amount of time involved to be between 5 and 10 hours, spread over the semester. If you are interested and willing to participate in this study, or if you would like more information, please notify me at
[email protected], Sincerely,
Erik Brogt, M.Sc. M.A. Ph.D. Candidate, Teaching and Teacher Education
331 A.IV: PARTICIPANT INFORMATION SHEET
Participant Information Title of Project: Pedagogical and Curricular Decisions of Professional Astronomers Teaching the Hertzsprung-Russell Diagram in Introductory Astronomy Courses for NonScience Majors You are being invited to voluntarily participate in the above-titled research study. The purpose of the study is an investigation into the personal craft knowledge instructors have about teaching practices, their views and beliefs about teaching. You are eligible to participate because you have been the instructor of record for Nats102, the Physical Universe, at some point in the last six semesters. If you agree to participate, your participation will involve one interview regarding your ideas about the teaching and learning of astronomy at the non-science major level and one interview in which you will be asked to perform certain cognitive tasks, like ranking and sorting tasks. The total amount of time required for this will be between 5 and 10 hours, and will be spread over the semester. The interviews will take place in a location convenient for you and will last approximately an hour to an 90 minutes each. You may choose not to answer some or all of the questions. During the interviews, written notes will be made in order to help the investigator review what is said. Your name will not appear on these notes. Any questions you have will be answered and you may withdraw from the study at any time. There are no known risks from your participation and no direct benefit from your participation is expected. There is no cost to you except for your time and you will not be compensated for your participation. Only the principal investigator and his faculty advisors in the department of Teaching and Teacher Education, Dr. Kathy Carter, Dr. Debra Tomanek and Dr. Walter Doyle, will have access to the your name and the information that you provide. In order to maintain your confidentiality, your name will not be revealed in any reports that result from this project. Interview information will be locked in a cabinet in a secure place. You can obtain further information from the principal investigator, Erik Brogt, M.Sc. M.A., at (520) 626-0647. If you have questions concerning your rights as a research subject, you may call the University of Arizona Human Subjects Protection Program office at (520) 626-6721.
332 By participating in the interview(s), you are giving permission for the investigator to use your information for research purposes. Thank you.
Erik Brogt, M.Sc. M.A. Ph.D. Candidate, Teaching and Teacher Education
333 A.V: CONSENT FORM
334
335
336 APPENDIX B: DATA GATHERING PROTOCOLS B.I: FIRST INTERVIEW QUESTIONS BACKGROUND OF THE PARTICIPANT • Please tell me about the type of research you do. • How did you get interested in this field? • Please tell me a little bit about your academic career and how you came into your current position. • What are your teaching requirements per year? Course load. Is that the same each year? What is the percentage of your time that is devoted to teaching in your contract? • How many times have you taught astro101? When was the last time you taught it? • What is the percentage of your time that is (officially) devoted to teaching? • What were your experiences with teaching / mentoring before you came to your current job? • Can you tell me a little about a few of the most memorable teaching instances you have had? • Have you ever received a form of training in teaching? If so, what sort of training? DISPOSTIONS TOWARD TEACHING • How would you characterize your teaching style? Approach and role • How would you describe the atmosphere in your classroom (interactions between instructor / students, number of questions, what are students doing in the course)? • How do you see your role as an instructor? • Has your opinion about your role as an instructor changed over time? If so, in what way? • Please compare and contrast your teaching in the past with your current teaching. What do you think caused changes in your teaching to occur? • What role do your teaching assistants / preceptors have in your classroom? What do you use your TAs or preceptors for? What do you want them to do in your course? • Can you describe a typical interaction with students in office hours? How do you see the role of office hours in a course? Why? What is it that students ask of you in office hours? • Can you describe the range of interactions with students in office hours? What are the first things that come to mind when I say “assessment of students”? What do you think “assessment of students” entails? • What are your preferred ways of assessing your students, what is it that you are assessing, and why?
337 IDEAS ON THE PURPOSE OF ASTRO 101 AND THE STUDENTS TAKING THE COURSE • How do you see the role of astro101 in the university general education curriculum? • How would you characterize a student in astro101? • Why do you think these students enroll in ASTRO 101? What makes you think that? • What are your goals when teaching ASTRO 101? • How did you develop these specific goals? Where did those goals come from? • How do you try to meet those goals when you are planning the course? • Is there a particular group of students you plan your course for? What group of students are you aiming at with your instruction? (follow-up question: define the group you just named) • Please tell me about your teaching experiences teaching astro101. Please describe to me a typical day in your astro101 classroom. (What are the students like, what is the curriculum like). If I were to walk into your classroom on any given day, what would I see? Zoom in on classroom climate here too. TEACHING THE HERTZSPRUNG-RUSSELL DIAGRAM • How would you describe the place of the HR diagram in an astro101 course? (analytical tool?) Please elaborate • Please describe how you teach the HR diagram. Is this different from how you taught it in the past? Why did you change it? • Where in the astro101 course is the HR diagram scheduled? Why there? • Can you name / describe some teaching approaches you have tried in the course when teaching the HR diagram? • Which worked and which did not? HARD QUESTION • How did you know that a method worked or not? HARD QUESTION • Why do you think certain approaches worked, and others didn’t? • What are the most important things you can do to enhance student learning of the HR diagram? • Can you describe how you prepare for teaching a class? (general question, not specifically related to the HR diagram). Vignette: assume I ask you to sub for me. How would you prepare • How much time does it take you to prepare for a class? (general question, not related to HR). Related to vignette • What other resources, besides yourself, are you using in your teaching? (TA, technical support, audio/visual) • Why do you use those specific resources? • Do you have enough time to prepare your teaching (workload)? INSTITUTIONAL FACTORS THAT AFFECT TEACHING
338 • • • • • • • • • •
Can you tell me about the university’s expectations (and pressures) toward research and teaching? Can you tell me about the department’s expectations (and pressures) toward research and teaching? What do you feel the climate for teaching is at the university? What do you feel is the climate for research at the department? Are there tensions between your teaching and your research responsibilities? If so, can you describe them? If not, how did that come to be? How much support do you feel you get for teaching at the university? Can you elaborate on the types of support that are present? How much support do you feel you get of the department for teaching? Can you elaborate on the types of support that are present? How much support do you feel you get from colleagues for teaching? Can you elaborate on the types of support that are present? Do you talk with your colleagues about teaching? If so, what are those conversations about? (share ideas for lectures, exam questions, activities). How often do these conversations occur? How long are these conversations? In your ideal world, how would you like to approach teaching astro101?
339 B.II: SECOND INTERVIEW QUESTIONS SECOND INTERVIEW JEFF FOLLOW UP FROM FIRST INTERVIEW • Think back to when you were an undergraduate and graduate student. How would you describe the teaching styles of the instructors teaching you? • Was there a difference in teaching style as you progressed through the program? Please comment on that. • Did those professors have an influence on how you view teaching today? Why? • How do you know what students do, and do not understand? • What do you think students expect out of a nats102 class? • In the first interview we talked about homework. You mentioned that you sometimes require it and sometimes not. Why? What is the reasoning behind that? The pedagogical purpose? • How do you decide what topics to include in nats102? (textbooks have more than can be covered in a semester) • Do you teach the non-majors differently than the majors (say astro 250). If so, in what way and why? • If you were asked to design a hands-on, in-class demonstration of the HR diagram, what would it look like? And why? LESSON PLAN WALK-THROUGH • You created a lesson plan for a colleague about teaching the HR diagram. Please walk me through this. Why did you choose this particular sequence of events? What is the story? Please explain how and why you made your choices. • What is the take-away message from this lesson? What question would you ask to see if students got this message? What answers would satisfy you? • What is your goal for this lesson? • What prior knowledge do you expect the students to have? • How are the powerpoints integrated in this lesson plan? • When do you want to do which tutorial? Why? • What are the most common problems students encounter in these lessons? How do you deal with those? • How does your lesson plan align with your course goals you mentioned in the first interview (sense of the scope of the universe and how physical concepts allow us to understand the universe, and that students are in special place at UoA for astronomy)? CONCEPT MAP AND PATHFINDER FOLLOW UP QUESTIONS • This is the concept map you generated about how you want your students to think about the HR diagram after instruction. Please walk me through this and tell me how you see it, what your thoughts were when you generated the map.
340 • • •
•
•
Please create the connector words. Why do you choose that word? Several participants mentioned that students have difficulty reading figures or graphs. Is that your experience as well? How would you go about helping students learn how to read figures, especially the HR diagram? How does this concept map align with your course goals you mentioned in the first interview (sense of the scope of the universe and how physical concepts allow us to understand the universe, and that students are in special place at UoA for astronomy) This is the concept map generated by the Pathfinder software about the views on teaching. Big thing on the right, and lots of nodes connected to demonstrations, appreciation for science and science literacy. Is this consistent with how you view teaching? How does this map align with your course goals you mentioned in interview one (sense of the scope of the universe and how physical concepts allow us to understand the universe, and that students are in special place at UoA for astronomy)?
PEDAGOGICAL AND CURRICULAR VIGNETTES How would you respond to the following situations? VIEWS ON STUDENT ABILITY AND STUDENT MISCONCEPTIONS • What is the most common student misunderstanding in the HR diagram that you have seen and how do you deal with that misunderstanding? Why in that way? • Are there any other common student misunderstandings? How do you deal with those? Why in that way? • Suppose a colleague comes to you and says: I am teaching nats102 for the first time ever. What is the single most important piece of advice that you can give your colleague? SECOND INTERVIEW HUGH: FOLLOW UP FROM FIRST INTERVIEW • Think back to when you were an undergraduate and graduate student. How would you describe the teaching styles of the instructors teaching you? • Was there a difference in teaching style as you progressed through the program? Please comment on that. • Did those professors have an influence on how you view teaching today? Why? • Do you use your research endeavors or results to augment your teaching? Why? • How do you think your course goal (want people to like science) compare to [Linda]’s? Are they compatible? • What do you think students expect out of a nats102 class? • How do you select topics for a nats102 class?
341 • • • • •
You mentioned that many students have problems with graphs and figures. How would you go about helping students learn how to read figures, especially the HR diagram? In your first interview, you mentioned that while using a hand mike, you’d occasionally interview students? What is the reasoning behind doing that? What do you want the students to get out of it? Where were these students sitting? If you were asked to design a hands-on, in-class demonstration of the HR diagram, what would it look like? And why? How do you think instruction of the HR diagram in general can be improved? Better texts, activities, lecture, etc. Why do you think that? Do you teach the non-majors differently than the majors (say astro 250). If so, in what way and why?
LESSON PLAN WALK-THROUGH • You created a lesson plan for a colleague about teaching the HR diagram. Please walk me through this. Why did you choose this particular sequence of events? Please explain how and why you made your choices. • What is the take-away message from this lesson? What question would you ask to see if students got this message? What answers would satisfy you? • What kind of prior knowledge to you want the students to have? Similar to the knowledge they have in your course sequence? • You put some emphasis on teaching about graphs. You noted that your colleague should “not underestimate how many students have this wrong”. Why did you put the emphasis there (point 2 in the plan)? Follow-up: what do you think would happen if you DID NOT put the emphasis there? • Why did you include the height-weight graph in point 3? Why do you think this works at this place? • You mention in 3.3.1 “try to get them to volunteer the weight ~ height^3”. How would you do that? Why in that way? • How do you want to link the height-weight graph to the HR diagram? What is the transition, and why? • Do you think the students understand this link? What do you think students are thinking here? Why do you think that? (what is the evidence you have for that?) • At 4.3, you mention “discuss why it helps to use a cluster”. What do you expect the instructor to say, and what do you expect the students to take away? • You decided to do an in-class exercise in point 5.1. Why did you do that at this particular stage? What was your reasoning? The pedagogical purpose? • You give them 10 minutes to do this. Is that enough? How do you know? • Quiz students on questions 4,5,6. What do you consider ‘when they got it’? • What are the most common problems students encounter in these questions? How do you deal with those? • In point 7, you mention: if time permits. If it doesn’t, then what happens with this point? Next lecture (as it is in your concept map)?
342 •
How does your lesson plan align with your course goals you mentioned in the first interview (want students to like science, HR diagram as an organizational tool)?
CONCEPT MAP AND PATHFINDER FOLLOW UP QUESTIONS • This is the concept map you generated about how you want your students to think about the HR diagram after instruction. Please walk me through this and tell me how you see it. • Please create the connector words. Why do you choose that word? • What do you mean with ‘under the hood’ and ‘characteristics versus position’? • How does this concept map align with your course goals you mentioned in the first interview (want students to like science) • This is the concept map generated by the Pathfinder software about the views on teaching. Can you comment on the map? Does the structure of this map reflect how you are thinking about teaching? • How does this map align with your course goals you mentioned in interview one (want students to like science)? PEDAGOGICAL AND CURRICULAR VIGNETTES How would you respond to the following situations? See separate paper VIEWS ON STUDENT ABILITY AND STUDENT MISCONCEPTIONS • What is the most common student misunderstanding in the HR diagram that you have seen and how do you deal with that misunderstanding? Why in that way? • What do you think causes this (inadequate preparation, math skills, etc)? • Are there any other common student misunderstandings? How do you deal with those? Why in that way? • How do you know what students do, and do not understand? • How do you think your students are prepared academically when they come into the classroom? How do you know this? • Suppose a colleague comes to you and says: I would like to become a better instructor for nats102, what would you say to him or her? • Do you have any other things you want to tell me about teaching and learning, or comments on the cognitive tasks? SECOND INTERVIEW LINDA: FOLLOW UP FROM FIRST INTERVIEW • Think back to when you were an undergraduate and graduate student. How would you describe the teaching styles of the instructors teaching you? • Was there a difference in teaching style as you progressed through the program? Please comment on that. • Did those professors have an influence on how you view teaching today? Why? • Do you use your research endeavors or results to augment your teaching? Why? • How do you know what students do, and do not understand?
343 • • • • • •
What do you think students expect out of a nats102 class? How do you determine what to teach in nats102, what topics? Why? How do your course goals (appreciation for science and what scientists do) compare to [Hugh]’s? You mentioned that students have difficulty reading figures or graphs. How would you go about helping students learn how to read figures, especially the HR diagram? Do you teach the non-majors differently than the majors (say astro 250). If so, in what way and why? If you were asked to design a hands-on, in-class demonstration of the HR diagram, what would it look like? And why?
LESSON PLAN WALK-THROUGH • You created a lesson plan for a colleague about teaching the HR diagram. Please walk me through this. Why did you choose this particular sequence of events? Please explain how and why you made your choices. Have you ever made a lesson plan before? • What question would you ask to see if students got the take-away message? What answers would satisfy you? • You made a note about graphs on the 2nd page. How do you suggest your colleague deals with the situation when he/she encounters that problem? Followup: what do you think would happen if you DID NOT put the emphasis there? • On page 2 you mention that you use the HRD as a means of introducing stellar evolution. Can you elaborate on that? • On page 3 you note 3 points under bullet 2. Can you elaborate on each of them? How do you suggest your colleague does this in practice? • In the lecture outline: what was your reasoning behind the chosen sequence? Can you give some practical suggestions on how to teach these? • You decided to do an in-class exercise in the lecture. Why did you do that at this particular stage? What was your reasoning? The pedagogical purpose? • How much time do you give them. Is that enough? How do you know? • How do you debrief the exercise? What do you consider an acceptable student answer, and why? • What are the most common problems students encounter in these questions? How do you deal with those? • How does your lesson plan align with your course goals you mentioned in the first interview (appreciation for science and what scientists do, HR diagram as means to get to stellar evolution)? CONCEPT MAP AND PATHFINDER FOLLOW UP QUESTIONS • This is the concept map you generated about how you want your students to think about the HR diagram after instruction. Can you tell me how you went about creating the map?
344 • • •
How does this concept map align with your course goals you mentioned in the first interview (appreciation for science and what scientists do) This is the concept map generated by the Pathfinder software about the views on teaching. Is this consistent with how you view teaching? How does this map align with your course goals you mentioned in interview one (appreciation for science and what scientists do)?
PEDAGOGICAL AND CURRICULAR VIGNETTES How would you respond to the following situations? VIEWS ON STUDENT ABILITY AND STUDENT MISCONCEPTIONS • What do you think are the most common problems students have when learning the HR diagram? What do you think causes this (inadequate preparation, math skills, etc) • Do you address these problems specifically in your teaching? If so, where and how? If not, why not? • Suppose a colleague comes to you and says: I am teaching nats102 for the first time ever. What is the single most important piece of advice that you can give your colleague? SECOND INTERVIEW PAUL FOLLOW UP FROM FIRST INTERVIEW • Think back to when you were an undergraduate and graduate student. How would you describe the teaching styles of the instructors teaching you? • Was there a difference in teaching style as you progressed through the program? Please comment on that. • Did those professors have an influence on how you view teaching today? Why? • How do you know what students do, and do not understand? • What do you think students expect out of a nats102 class? • How do you determine what topics to include in nats102? • You mentioned that students have difficulty reading figures or graphs. How would you go about helping students learn how to read figures, especially the HR diagram? • Would you teach the non-majors differently than the majors (say astro 250). If so, in what way and why? • If you were asked to design a hands-on, in-class demonstration of the HR diagram, what would it look like? And why? LESSON PLAN WALK-THROUGH • You created a lesson plan for a colleague about teaching the HR diagram. Please walk me through this. Why did you choose this particular sequence of events? Please explain how and why you made your choices.
345 • • • • • • • • • •
You mention playing music at the beginning of class to “set the mood”. Why? How do you transition from part 2 mini-lecture to part 3 mini-lecture? Why do you incorporate think-pair-share? What is the purpose of the think-pairshare questions? You mention a band of percentages, and discussion only in between 30-80 percent correct answer in the first try on the question. Why? What would happen if you don’t adhere to that band? What is the reason for having 15 minutes of think-pair-share at the end? In part 5, you mention to “maybe alter the lesson plan and have students explain their choices”. What are common problems for students at this stage? What are some common answers you are likely to get and how do you deal with those? What is the take-away message from this lesson? What question would you ask to see if students got this message? What answers would satisfy you? You have a video in the plan about 20 minutes before the end. What is this video about, why is it in here at this place, and what is the purpose? What are the most common problems students encounter in this lesson? How do you deal with those? How does your lesson plan align with your course goals you mentioned in the first interview (science literacy, problem solving, high attendance)?
CONCEPT MAP AND PATHFINDER FOLLOW UP QUESTIONS • This is the concept map you generated about how you want your students to think about the HR diagram after instruction. Can you tell me how you went about creating the map? Why those concepts and those links? • What is the connector word between “spectral type” and “color”? It’s not readable in the picture. • How does this concept map align with your course goals you mentioned in the first interview (science literacy, problem solving, high attendance) • This is the concept map generated by the Pathfinder software about the views on teaching. Strong node on student centered. Do you think the map is consistent with how you view teaching? • How does this map align with your course goals you mentioned in interview one (science literacy, problem solving, high attendance)? PEDAGOGICAL AND CURRICULAR VIGNETTES How would you respond to the following situations? VIEWS ON STUDENT ABILITY AND STUDENT MISCONCEPTIONS • What do you think are the most common problems students have when learning the HR diagram? What do you think causes this (inadequate preparation, math skills, etc) • Do you address these problems specifically in your teaching? If so, where and how? If not, why not?
346 •
Suppose a colleague comes to you and says: I am teaching nats102 for the first time ever. What is the single most important piece of advice that you can give your colleague?
SECOND INTERVIEW WILLIAM FOLLOW UP FROM FIRST INTERVIEW • Think back to when you were an undergraduate and graduate student. How would you describe the teaching styles of the instructors teaching you? • Was there a difference in teaching style as you progressed through the program? Please comment on that. • Did those professors have an influence on how you view teaching today? Why? • How do you know what students do, and do not understand? • What do you think students expect out of a nats102 class? • In the first interview, when we were talking about course goals you mentioned that it was your job to say which topics are important for a nats102 student to have gone through. How do you make that call for a topic? • You mentioned that students have difficulty reading figures or graphs. How would you go about helping students learn how to read figures, especially the HR diagram? • When we were talking about technical support for teaching, you mentioned that you had rewritten some CLEA and Sloan labs. In what way did you rewrite them and why? • Do you teach the non-majors differently than the majors (say astro 250). If so, in what way and why? • If you were asked to design a hands-on, in-class demonstration of the HR diagram, what would it look like? And why? LESSON PLAN WALK-THROUGH • You created a lesson plan for a colleague about teaching the HR diagram. Please walk me through this. Why did you choose this particular sequence of events? Please explain how and why you made your choices. • What is the take-away message from this lesson? What question would you ask to see if students got this message? What answers would satisfy you? • How would you split it in 3,4 lessons? How does it tie in with your own class schedule? • What is your goal for this lesson? • In 1.f you mention that in prior knowledge PERHAPS magnitudes. Would the lesson change much if they did, or did not have this knowledge? Why? • Idem for 1.g, the PERHAPS what powers the Sun. • Why did you include the height-weight graph in point 3? Why do you think this works at this place?
347 •
• • • • •
How do you want to link the height-weight graph to the HR diagram? In the first interview you mentioned that students have difficulty with the transition. What is the transition, and why are students having problems there? How do you help them / would want to help them if you had time? Do you think the students understand this link? What do you think students are thinking here? Why do you think that? (what is the evidence you have for that?) At IX: you talk about nuclear waste. Why is that introduced at this point? at XI: “stick figure model” what do you mean here? What are the most common problems students encounter in these lessons? How do you deal with those? How does your lesson plan align with your course goals you mentioned in the first interview (method to the madness of science + overview b/c they’ll read about it later in life)?
CONCEPT MAP AND PATHFINDER FOLLOW UP QUESTIONS • You mentioned in your emails to me that both the concept map and the rating task “didn’t thrill you”. Can you elaborate on that? • This is the concept map you generated about how you want your students to think about the HR diagram after instruction. Can you tell me how you went about creating the map? Please walk me through this and tell me how you see it. • Please create the connector words from the HR diagram to the other major concepts. Why do you choose that word? • You mention astro-sociology a number of times? Why? • Clarification: difference between dashed and solid lines? L – L range (HR, 7 o’clock) T-L range? • How does this concept map align with your course goals you mentioned in the first interview (method to the madness of science + overview b/c they’ll read about it later in life) • This is the network map generated by the Pathfinder software from your rating task. Strongly centered around student interest. Can you comment on that? • How does this map align with your course goals you mentioned in interview one (method to the madness of science + overview b/c they’ll read about it later in life)? PEDAGOGICAL AND CURRICULAR VIGNETTES How would you respond to the following situations? VIEWS ON STUDENT ABILITY AND STUDENT MISCONCEPTIONS • What is the most common student misunderstanding in the HR diagram that you have seen and how do you deal with that misunderstanding? Why in that way? • What do you think causes this (inadequate preparation, math skills, etc)? • Are there any other common student misunderstandings? How do you deal with those? Why in that way?
348 •
Suppose a colleague comes to you and says: I am teaching nats102 for the first time ever. What is the single most important piece of advice that you can give your colleague?
349 B.III: LESSON PLAN COGNITIVE TASK
Lesson Plan Task Purpose of the task I am interested to see how you think about a real teaching situation, how you structure the lesson, and why you structure it in that way. Also, I am interested in the reasoning behind the pedagogical and curricular decisions you make. In this task, you are being asked to respond in writing to the scenario below and create a lesson plan. For this task, a lesson plan will be considered to be a detailed outline of what you intend for a class; it details the activities for both you and your students, your reasons for what you plan to do, and the schedule of events. Context You are approached by a colleague, who has just started as an assistant professor in the department. She/he is scheduled to teach introductory astronomy for non-science majors (nats102) this semester on the Tuesday / Thursday schedule, which means a 75 minute class period, in N210. This person has never taught before, nor been a TA, and asks you for mentoring in preparing to teach about the HR diagram and crafting the lesson. She/he has not prepared slides, is still considering a textbook and is unsure what to expect when teaching the nats102 class. Task Create a lesson plan document for a 75 minute lesson on the HR diagram to help your junior colleague prepare for teaching. Because your colleague has no teaching experience, please also include where in the nats102 course you envision this lesson to be, and why. Also, you may want to offer suggestions on what to expect in the classroom as the lesson progresses, and suggestions on (and reasoning behind) pedagogical approaches. You may include your own course materials, such as PowerPoint slides, assignments, and the like in this task, but the plan should include more than just the slides or overheads. The lesson plan can be as long as you want or deem necessary, but in essence, everyone who picks up your lesson plan, and has a decent working knowledge of the HR diagram, should be able to teach the lesson consistent with the way you envision the (role of the) lesson to be in the context of the nats102 course.
350 B.IV: CONCEPT MAP COGNITIVE TASK
Concept Map Task Background A concept map is a graphical way of organizing how someone thinks about a particular topic. Typically, a concept map involves one main topic, and shows what concepts are making up that topic, and the way these concepts are related. Two examples of concept maps are given below. This first example is taken from Novak (2002) and shows a concept map about concept maps. The second is a concept map I made about galaxies. Note that the concepts are linked with so-called linker words, often prepositions or verbs.
Figure 1: Example of an hierarchical concept map, from Novak (2002), Science Education 86(4), 548-571
351 Figure 2: Example of a centered concept map
These examples are of course not the only structure a concept map can have. Concepts maps can be hierarchical (like in figure 1), centered around a single word (like figure 2), or other forms. The structure of the map, and its complexity, depends on the topic that is depicted in the concept map and on the way the person creating the map thinks about the topic. As such, there is no “right” answer to a concept map. It simply depicts how an individual thinks about a topic, and how the various concepts are linked. Making a concept map The creation of a concept map typically is an iterative process. One way that can be helpful is to start by making a list of all the concepts you want to include. Some people use 3x5 cards for this, or different color/size sticky notes for the concepts and linker words. You can then arrange the concepts to start looking at the relationships between the various concepts and come up with the linker words to go between them. Often as you do this, you will find that you want to include additional concepts or change linker words. Task In your interview, you indicated how you see the role of the HR diagram in your course and how you approach the teaching of the HR diagram. At the end of the semester, what would you like the students to know and understand about the HR diagram? Please make a concept map of a student’s knowledge and understanding of the HR diagram, as you would like it to be at the end of the semester. The concept map can be as long and complex as you want or deem necessary, but the idea is to give a good impression about how you think a student in your class should think about the important concepts in the HR diagram and the links between them.
352 B.V: PATHFINDER TASK
Rating Task Instructions This task involves your judgments of the relatedness of pairs of concepts, that came out of the first round of interviews. In making these judgments, there are several ways to think about the items being judged. For instance, two concepts might be related because they share common features, one can be a prerequisite for the other, or one can be an inhibitor for the other. The intention of this task is to obtain your initial impression of relatedness. Therefore, please base your ratings on your first impression and don’t spend more than a few seconds on each item. The judgments are on a scale from 1-9, where 1 indicates no relatedness, and 9 indicates a very high relatedness. You will be comparing 17 concepts, for a total of 136 judgments. Please make sure to respond to every question.
instructor centered instruction student centered instruction
1
2
3
4
5
6
7
8
9
teaching facts doing in-class demonstrations
1
2
3
4
5
6
7
8
9
student interest authentic experience
1
2
3
4
5
6
7
8
9
small group work student centered instruction
1
2
3
4
5
6
7
8
9
covering material in depth instructor centered instruction
1
2
3
4
5
6
7
8
9
small class size covering material in depth
1
2
3
4
5
6
7
8
9
lecture teaching facts
1
2
3
4
5
6
7
8
9
student centered instruction doing in-class demonstrations
1
2
3
4
5
6
7
8
9
authentic experience
1
2
3
4
5
6
7
8
9
353 instructor centered instruction lecture doing in-class demonstrations
1
2
3
4
5
6
7
8
9
lack of time the way science is done
1
2
3
4
5
6
7
8
9
student centered instruction promoting scientific literacy
1
2
3
4
5
6
7
8
9
large class size authentic experience
1
2
3
4
5
6
7
8
9
promoting scientific literacy covering material in depth
1
2
3
4
5
6
7
8
9
student centered instruction lack of time
1
2
3
4
5
6
7
8
9
doing in-class demonstrations covering material in depth
1
2
3
4
5
6
7
8
9
lack of resources small class size
1
2
3
4
5
6
7
8
9
student understanding large class size
1
2
3
4
5
6
7
8
9
promoting scientific literacy lecture
1
2
3
4
5
6
7
8
9
covering material in depth lack of resources
1
2
3
4
5
6
7
8
9
small group work authentic experience
1
2
3
4
5
6
7
8
9
lecture student centered instruction
1
2
3
4
5
6
7
8
9
covering material in depth lecture
1
2
3
4
5
6
7
8
9
354 promoting appreciation for science lack of time
1
2
3
4
5
6
7
8
9
student centered instruction covering material in depth
1
2
3
4
5
6
7
8
9
teaching facts promoting scientific literacy
1
2
3
4
5
6
7
8
9
the way science is done authentic experience
1
2
3
4
5
6
7
8
9
the way science is done large class size
1
2
3
4
5
6
7
8
9
lecture the way science is done
1
2
3
4
5
6
7
8
9
instructor centered instruction the way science is done
1
2
3
4
5
6
7
8
9
small group work student interest
1
2
3
4
5
6
7
8
9
student interest small class size
1
2
3
4
5
6
7
8
9
authentic experience doing in-class demonstrations
1
2
3
4
5
6
7
8
9
lack of time small group work
1
2
3
4
5
6
7
8
9
teaching facts authentic experience
1
2
3
4
5
6
7
8
9
the way science is done teaching facts
1
2
3
4
5
6
7
8
9
teaching facts student centered instruction
1
2
3
4
5
6
7
8
9
instructor centered instruction
1
2
3
4
5
6
7
8
9
355 large class size instructor centered instruction teaching facts
1
2
3
4
5
6
7
8
9
instructor centered instruction lack of resources
1
2
3
4
5
6
7
8
9
promoting scientific literacy small group work
1
2
3
4
5
6
7
8
9
small class size lack of time
1
2
3
4
5
6
7
8
9
lack of resources student centered instruction
1
2
3
4
5
6
7
8
9
authentic experience covering material in depth
1
2
3
4
5
6
7
8
9
the way science is done student centered instruction
1
2
3
4
5
6
7
8
9
teaching facts promoting appreciation for science
1
2
3
4
5
6
7
8
9
authentic experience promoting appreciation for science
1
2
3
4
5
6
7
8
9
lecture authentic experience
1
2
3
4
5
6
7
8
9
large class size promoting appreciation for science
1
2
3
4
5
6
7
8
9
promoting appreciation for science student understanding
1
2
3
4
5
6
7
8
9
small class size instructor centered instruction
1
2
3
4
5
6
7
8
9
small group work lack of resources
1
2
3
4
5
6
7
8
9
356
lecture large class size
1
2
3
4
5
6
7
8
9
doing in-class demonstrations instructor centered instruction
1
2
3
4
5
6
7
8
9
promoting appreciation for science instructor centered instruction
1
2
3
4
5
6
7
8
9
small class size small group work
1
2
3
4
5
6
7
8
9
lack of resources authentic experience
1
2
3
4
5
6
7
8
9
student understanding covering material in depth
1
2
3
4
5
6
7
8
9
covering material in depth the way science is done
1
2
3
4
5
6
7
8
9
promoting scientific literacy student understanding
1
2
3
4
5
6
7
8
9
lack of resources student understanding
1
2
3
4
5
6
7
8
9
student understanding lack of time
1
2
3
4
5
6
7
8
9
the way science is done student interest
1
2
3
4
5
6
7
8
9
covering material in depth small group work
1
2
3
4
5
6
7
8
9
authentic experience lack of time
1
2
3
4
5
6
7
8
9
authentic experience promoting scientific literacy
1
2
3
4
5
6
7
8
9
357 small group work large class size
1
2
3
4
5
6
7
8
9
lecture student interest
1
2
3
4
5
6
7
8
9
promoting scientific literacy small class size
1
2
3
4
5
6
7
8
9
promoting scientific literacy the way science is done
1
2
3
4
5
6
7
8
9
student centered instruction authentic experience
1
2
3
4
5
6
7
8
9
student centered instruction promoting appreciation for science
1
2
3
4
5
6
7
8
9
doing in-class demonstrations small class size
1
2
3
4
5
6
7
8
9
teaching facts student interest
1
2
3
4
5
6
7
8
9
student understanding instructor centered instruction
1
2
3
4
5
6
7
8
9
covering material in depth large class size
1
2
3
4
5
6
7
8
9
student centered instruction small class size
1
2
3
4
5
6
7
8
9
student interest lack of resources
1
2
3
4
5
6
7
8
9
instructor centered instruction lecture
1
2
3
4
5
6
7
8
9
large class size student interest
1
2
3
4
5
6
7
8
9
lack of resources
1
2
3
4
5
6
7
8
9
358 promoting appreciation for science lack of time teaching facts
1
2
3
4
5
6
7
8
9
small class size student understanding
1
2
3
4
5
6
7
8
9
promoting appreciation for science covering material in depth
1
2
3
4
5
6
7
8
9
promoting appreciation for science small group work
1
2
3
4
5
6
7
8
9
large class size promoting scientific literacy
1
2
3
4
5
6
7
8
9
the way science is done doing in-class demonstrations
1
2
3
4
5
6
7
8
9
student interest promoting appreciation for science
1
2
3
4
5
6
7
8
9
teaching facts lack of resources
1
2
3
4
5
6
7
8
9
instructor centered instruction student interest
1
2
3
4
5
6
7
8
9
small group work teaching facts
1
2
3
4
5
6
7
8
9
doing in-class demonstrations student understanding
1
2
3
4
5
6
7
8
9
authentic experience student understanding
1
2
3
4
5
6
7
8
9
student interest student understanding
1
2
3
4
5
6
7
8
9
lack of resources promoting scientific literacy
1
2
3
4
5
6
7
8
9
359
lack of time instructor centered instruction
1
2
3
4
5
6
7
8
9
promoting scientific literacy lack of time
1
2
3
4
5
6
7
8
9
large class size lack of resources
1
2
3
4
5
6
7
8
9
student understanding lecture
1
2
3
4
5
6
7
8
9
covering material in depth student interest
1
2
3
4
5
6
7
8
9
promoting appreciation for science small class size
1
2
3
4
5
6
7
8
9
lack of time large class size
1
2
3
4
5
6
7
8
9
student interest promoting scientific literacy
1
2
3
4
5
6
7
8
9
large class size small class size
1
2
3
4
5
6
7
8
9
the way science is done lack of resources
1
2
3
4
5
6
7
8
9
lack of time covering material in depth
1
2
3
4
5
6
7
8
9
covering material in depth teaching facts
1
2
3
4
5
6
7
8
9
student centered instruction student understanding
1
2
3
4
5
6
7
8
9
student understanding teaching facts
1
2
3
4
5
6
7
8
9
360 small class size lecture
1
2
3
4
5
6
7
8
9
lack of resources doing in-class demonstrations
1
2
3
4
5
6
7
8
9
small class size teaching facts
1
2
3
4
5
6
7
8
9
lecture lack of resources
1
2
3
4
5
6
7
8
9
promoting appreciation for science lecture
1
2
3
4
5
6
7
8
9
doing in-class demonstrations promoting appreciation for science
1
2
3
4
5
6
7
8
9
small class size the way science is done
1
2
3
4
5
6
7
8
9
the way science is done promoting appreciation for science
1
2
3
4
5
6
7
8
9
promoting appreciation for science promoting scientific literacy
1
2
3
4
5
6
7
8
9
doing in-class demonstrations lack of time
1
2
3
4
5
6
7
8
9
doing in-class demonstrations small group work
1
2
3
4
5
6
7
8
9
lack of time student interest
1
2
3
4
5
6
7
8
9
doing in-class demonstrations promoting scientific literacy
1
2
3
4
5
6
7
8
9
large class size doing in-class demonstrations
1
2
3
4
5
6
7
8
9
small group work
1
2
3
4
5
6
7
8
9
361 the way science is done promoting scientific literacy instructor centered instruction
1
2
3
4
5
6
7
8
9
instructor centered instruction small group work
1
2
3
4
5
6
7
8
9
small group work lecture
1
2
3
4
5
6
7
8
9
student understanding small group work
1
2
3
4
5
6
7
8
9
large class sizestudent centered instruction
1
2
3
4
5
6
7
8
9
lack of resources lack of time
1
2
3
4
5
6
7
8
9
student interest student centered instruction
1
2
3
4
5
6
7
8
9
student understanding the way science is done
1
2
3
4
5
6
7
8
9
student interest doing in-class demonstrations
1
2
3
4
5
6
7
8
9
lack of time lecture
1
2
3
4
5
6
7
8
9
authentic experience small class size
1
2
3
4
5
6
7
8
9
teaching facts large class size
1
2
3
4
5
6
7
8
9
362 APPENDIX C: PHYSICS OF THE HERTZSPRUNG-RUSSELL DIAGRAM
In chapter 1, a brief overview was given about the main points of the diagram and its derivatives, but the details were not discussed there as it would detract from the narrative. In this appendix the stellar astrophysics of the HR diagram is discussed in more detail, for those readers who want to become more familiar with the intricacies of the diagram. The HR diagram is a graph of temperature or spectral class on the horizontal axis, and luminosity or absolute magnitude on the vertical axis. In order to measure the temperature of stars, knowledge of the laws of Stefan-Boltzmann and Wien is needed, as well as the basics of atomic physics and spectroscopy. To measure the luminosity of stars, one needs to know the apparent brightness, the distance, and the inverse square law of radiation. In the HR diagram additional physics is hidden, for example the mass and the size of a star.
The horizontal axis: determining temperature Wien’s law A body with a temperature T has a spectral radiance I given by Planck’s law of
I (λ , T ) =
2hc 2
λ
1
5
e
hc λ kT
, where h is Planck’s constant, c the speed of light, λ the
−1
wavelength, T the temperature, and k the Boltzmann constant. For each temperature, this function peaks at a certain wavelength, which can be calculated by taking the derivative
363 of the function with respect to λ. The result is Wien’s law, which states that λmaxT = 0.29 , where λmax is the peak wavelength in centimeters and T the temperature in Kelvin. By measuring the spectrum of a star and determining its peak wavelength, one can calculate the surface temperature of the star. For example, the Sun peaks at a wavelength of about 500 nm, which gives a temperature of around 5800 K. Hotter stars will have a peak at shorter wavelengths, whereas cooler stars will have a peak at longer wavelengths. Shorter wavelengths are associated with bluer colors, and longer wavelengths are associated with redder colors. In the HR diagram this means that the hotter, bluer objects are located at the left-hand side of the diagram whereas the cooler, redder objects are located at the right-hand side of the diagram.
Spectral class Astronomers oftentimes use spectral class, rather than temperature, on the horizontal axis. The sequence of the spectral class (O B A F G K M) is historical. The original spectral classification of stars was developed in the 1890s at Harvard, where Edward Pickering and Williamina Fleming ordered stellar spectra (the chemical “finger prints” of stars) by the prominence of the spectral lines of the element hydrogen. “A” stars had the most prominent hydrogen lines, followed by “B” etc. In 1901, Annie JumpCannon (1863-1941), who single-handedly classified over a quarter of a million stars during her time at Harvard, reordered the sequence by arranging the stars by temperature, rather than by the prominence of the hydrogen lines. This reordering resulted in a large number of original classes being redundant. The sequence of the remaining classes, O B
364 A F G K M, is still in use today. Differences in the spectra of stars were originally ascribed to differences in composition. Thanks to the ground-breaking theoretical work of Cecilia Payne-Gaposchkin (1900-1979) it was shown that this is in fact not the case, but that the differences in spectra are due to differences in temperature (not only the peak wavelength, but the entire structure of the spectrum), and that all stars have a similar composition and consist primarily of hydrogen. The physics of the HR diagram has been advanced tremendously by JumpCannon and Payne-Gaposchkin, in a time where it was very uncommon for women to be involved in academia.
Stefan-Boltzmann Law Knowing the temperature of a star is a step in knowing the luminosity of the star, as the luminosity of a star is proportional to the temperature, but also to the size (radius) of the star. The bigger a star, the more energy will be emitted; the hotter the star, the more energy will be emitted. The relationship between size, temperature, and luminosity is given through the Stefan-Boltzmann law. The equation for this law is L = 4π R 2σ T 4 , where L is the total luminosity, R the radius of the star, T the temperature of the star and σ the Stefan-Boltzmann constant. However, the size of a star is very difficult to measure (it can only been done for the biggest and closest stars) but can be calculated if one can determine the luminosity through different means. The size of a star is one of the hidden features in the HR diagram. Though the radius of a star is not noted in the HR diagram, it can be calculated given the temperature (x-axis) and luminosity (y-axis).
365
The vertical axis: determining luminosity When observations of stars are made, we can only say how bright the star appears to be. Apparent brightness of a star can be determined by two factors. The first is the intrinsic brightness, how much light the star actually gives off. The second is the distance to the star. The farther the star is from Earth, the dimmer it will appear to be. Determining distances to stars is thus crucial to be able to measure how much light a star is actually giving off, which is its luminosity.
Parallax and distances One of the bigger challenges in astronomy is to determine the distance to objects in the universe. The only direct measurement with which that can be done is through the parallax method. In the figure below the schematics of measuring distance to a star using parallax is presented. Assume a star is at the top of the triangle at a distance d from the Earth. We can measure the position of that star with respect to distant stars twice a year, with the Earth at opposite positions in its orbit around the Sun, which gives the baseline b. Seemingly, the star will have moved with respect to the distant stars, much like when you hold your finger out in front of you and close one eye; the position of your finger seems to shift depending on which eye you open. This change in position can be expressed as the angle
α 2
, half the parallax angle α.
366
Figure 13: Schematic of using parallax to determine distance to a star
Using the rules of geometry, the distance d is found as 1 b d= 2 . Even though the value of b is quite large by human standards (300 million α tan( ) 2 kilometers), it is very small compared to the distances of stars. As a result, the parallax method is limited to measuring distances to a few hundred light years from Earth. Beyond that, the measured angles become too small to reliably measure and different techniques of determining distances have to be employed. Knowing the distance to stars is a prerequisite to being able to determine the total amount of energy a star gives off, as the star will appear dimmer the farther it is due to the inverse square law of radiation.
367 Inverse square law of radiation A star radiates energy (per second) spherically in all directions, its luminosity L. The surface of the sphere on which this energy gets distributed is equal to 4π R 2 , where R is the distance from the source, in this case the star. The flux, the amount of energy per unit area thus equal to the total amount of energy emitted divided by all the area over which the energy has to be distributed. Hence, the flux at a distance R, LR =
L , is 4π R 2
proportional to the inverse square of the distance. A star that is three times farther away, will thus appear nine times dimmer.
Apparent and absolute magnitude Instead of luminosity, astronomers sometimes use the magnitude of a star to denote stellar brightness. The magnitude system was devised by Hipparchus in the second century BCE. Originally, Hipparchus defined the stars visible with the naked eye closest to sundown as being of the first magnitude. Stars that became visible a little later were of the second magnitude, and so on until the faintest stars that were visible with the naked eye, which were of sixth magnitude. Today, this system is referred to as the apparent magnitude of a star. Originally, a star of a certain magnitude was said to be two times fainter than a star of the previous magnitude. In the 19th century, this system was revised. By current definition, a star of magnitude 1 is 100 times brighter than a star of magnitude 6, meaning that there is a factor of about 2.5 in brightness between magnitudes. Hipparchus used the
368 apparent brightness of stars in the sky to make his classification. However, in order to determine physical properties, one needs to know how bright a star really is. For this, astronomers use the absolute magnitude of a star, which by definition is the apparent magnitude of the star if the star were to be at a distance of 32 light years. For example, the Sun has an apparent magnitude of -26.7, but an absolute magnitude of only 4.8. Mathematically, the apparent and absolute magnitude are related through the distance modulus, which is given by m − M = 5 log d − 5 , where m is the apparent magnitude, M the absolute magnitude, and d the distance in units of parsec, which is about 3.2 light years.
Stars on the HR diagram Russell-Vogt theorem The Russell-Vogt theorem is not so much a theorem in the mathematical sense of the word, but rather a label signifying its importance in stellar astronomy. The RussellVogt theorem states that during the main sequence phase of a star, all relevant parameters are determined by the mass of the star. Temperature, luminosity, size, and stellar lifetime are among those. High mass stars are bright, hot, big, and short-lived. Low mass stars are faint, cool, small, and long-lived. These relationships are explored in more detail in the sections below.
Measuring mass
369 Directly measuring masses of stars is very difficult and can only be done in binary systems, where two stars orbit a common center of mass. In Figure 14 below, the schematic of such a system is presented, where the black dot represents the center of mass. In this case, star A will be more massive than star B (as evident by the smaller orbit).
Figure 14: Determining masses of stars using a binary system
We can define r = ra + rb and M = ma + mb . Furthermore, ma ra = mb rb . The gravitational force has to equal the centripetal force for the system to be in balance, meaning that for Gma mb ma v 2 star A the following equation holds: = , where the circular orbital velocity ra 2 ra v=
2π ra in which T is the orbital period. Substituting and rearranging yields T
370 4π 2 (ra + rb )3 T = . In this equation, the orbital distances ra, rb, and the orbital period T G (ma + mb ) 2
(or the orbital velocity v) can be measured directly, yielding the masses of the stars.
Mass – Luminosity relation A star’s position on the main sequence of the HR diagram is determined by its mass, as stated by the Russell-Vogt theorem. In a star, two major forces are at play. The first one is the force of gravity, which tries to compress the star. The nuclear fusion of hydrogen in the core of the star (see next section) creates an outward pressure to balance gravity. The more massive the star, the more outward pressure is needed to keep the balance, which means that more nuclear fusion will have to occur in the star’s core. More nuclear fusion also means that the star will become brighter (more luminous). The relationship between mass and luminosity is not a linear one, and has empirically been determined to be L ∼ M 3.5 , where L is again the luminosity and M is the mass of the star. This non-linear relation means that with increasing mass, the luminosity of the star rises rapidly.
Nuclear fusion and hydrostatic equilibrium Stars shine by converting hydrogen into helium through thermonuclear fusion in their cores, where temperature and pressure are high enough for the fusion to occur. In this process, which can take various forms, the net result is that four hydrogen atoms are converted into a single helium atom, releasing some energy: 4 1H → 4He + energy.
371 Energy is released because the mass of the four hydrogen atoms is slightly less than the single helium atom. The difference in mass is converted to energy via Einstein’s famous E = mc 2 formula. Stars spend the majority of their lives on the main sequence, where
they fuse hydrogen into helium in their cores. The star is in a stable configuration called hydrostatic equilibrium, where the outward pressure of the released energy in the core of the star is balanced by the force of gravity trying to collapse the star. When the hydrogen in the core is depleted, this balance is disrupted and the star evolves off the main sequence and becomes a giant. Giants and white dwarfs are evolved stars where different physical processes occur.
Stellar lifetime Astronomers consider a star to be “alive” as long as it has fusion processes going on in its core. The “stellar lifetime” is thus the time between the first nuclear fusion in the star’s core to the moment all fusion activity ceases. Stellar lifetime is often used synonymously (though not quite correctly) with the time a star spends on the main sequence in the HR diagram. For the vast majority of a star’s life (in the order of 90 percent) the star fuses hydrogen into helium in its core. The amount of hydrogen available for fusion, and the rate with which the fusion occurs (to balance the force of gravity) determine how long a star can remain on the main sequence. Typically, about 10 percent of the mass of the star is available for hydrogen fusion in the core. The rate with which hydrogen is consumed depends on the luminosity needed to balance gravity. So
372 the total amount of time a star can remain on the main sequence is given by t ~
M , L
where t is the main sequence lifetime, M the mass and L the luminosity. Using the massluminosity relationship discussed above this means that the main sequence lifetime t ~ M −2.5 . In other words, the more massive the star, the shorter it remains on the main
sequence. The top-right and bottom-left parts of the HR diagram are populated by stars that are not main sequence stars, but are in a much later stage in their lives. The top-right part consists of the Red Giants, stars that have exhausted their supply of hydrogen and are fusing different elements in their cores as nuclear fuel to keep shining. The bottom-left part consists of the White Dwarfs, essentially the remains of very evolved low mass (initial or main sequence mass smaller than 8 solar masses) stars, which blow off their outer layers into interstellar space, leaving only the hot core behind.
373 APPENDIX D: IN-CLASS EXERCISE IN THE COURSES OF LINDA AND HUGH
374
375 REFERENCES Abell, S. K. (2008). Twenty years later: Does pedagogical content knowledge remain a useful idea? International Journal of Science Education, 30(10), 1405-1416. Allen, M. (2003). Eight questions on teacher preparation: What does the research say? A summary of the findings. Denver, CO: Education Commission of the States. Alonzo, A. (2002, January 10-13). Evaluation of a model for supporting the development of elementary school teachers' science content knowledge. Paper presented at the Annual Conference of the Association for the Education of Teachers in Science, Charlotte, NC. Appleton, K., & Asoko, H. (1996). A case study of a teacher's progress toward using a constructivist view of learning to inform teaching in elementary science. Science Education, 80(2), 165-180. Austin, A. E. (2002). Preparing the next generation of faculty: Graduate school as socialization to the academic career. The Journal of Higher Education, 73(1), 94122. Bailey, J. M. (2006). Development of a concept inventory to assess students' understanding and reasoning difficulties about the properties and formation of stars. Unpublished Doctoral Dissertation, The University of Arizona, Tucson. Baleisis, A. (2008). Joining a discourse community: How graduate students learn to speak like astronomers. Unpublished Doctoral dissertation, The University of Arizona, Tucson. Ball, D. L., & Bass, H. (2000). Interweaving content and pedagogy in teaching and learning to teach: Knowing and using mathematics. In J. Boaler (Ed.), Multiple Perspectives on Mathematics Teaching and Learning (pp. 83-104). Westport, CT: ABLEX Publishing. Ball, D. L., & Cohen, D. K. (1996). Reform by the book: What is: Or what might be: The role of curriculum materials in teacher learning and instructional reform. Educational Researcher, 25(9), 6-14.
376 Bardar, E. M. (2006). Development and analysis of spectroscopic learning tools and the Light and Spectroscopy Concept Inventory for introductory college astronomy. Unpublished Doctoral Dissertation, Boston University, Boston. Baxter, J. A., & Lederman, N. G. (1999). Assessment and measurement of pedagogical content knowledge. In J. A. Baxter & N. G. Lederman (Eds.), Examining pedagogical content knowledge: The construct and its implications for science education (pp. 147-161). Dordrecht, The Netherlands: Kluwer. Briggs, D. C., Harlow, D., Geil, K., & Talbot, R. M. (2007). Measuring the pedagogical sophistication of math and science teachers using scenario-based items. Paper presented at the Annual Meeting of the American Educational Research Association. Brogt, E. (2007a). Astronomy education: Becoming a hybrid researcher. Journal of Research Practice, 3(1), Article M2. Brogt, E. (2007b). Instruction as a scientific experiment: A professional development case study of a professor changing the introductory astronomy course for nonscience majors. Astronomy Education Review, 6(2), 20-31. Brogt, E. (2007c). A theoretical background on a successful implementation of LectureTutorials. Astronomy Education Review, 6(1), 50-58. Brogt, E., Dokter, E., & Antonellis, J. (2007). Regulations and ethical considerations for astronomy education research. Astronomy Education Review, 6(1), 43-49. Brogt, E., Sabers, D., Prather, E. E., Deming, G. L., Hufnagel, B., & Slater, T. F. (2007). Analysis of the Astronomy Diagnostic Test. Astronomy Education Review, 6(1), 25-42. Burroughs-Lange, S. G. (1996). University lecturers' concept of their role. Higher Education Research & Development, 15(1), 29-49. Buxner, S. R. (2007). Pathfinder in education research.
377 Buxner, S. R. (2009). Developing a Pathfinder based instrument measuring the conceptual orginazation of science inquiry in novices and experts. Paper presented at the Annual Meeting of the American Educational Research Association. Calderhead, J. (1996). Teachers: Beliefs and knowledge. In D. C. Berliner & R. C. Calfee (Eds.), Handbook of educational psychology (pp. 709-725). New York: Macmillan. Carter, K. (1990). Teachers' knowledge and learning to teach. In W. R. Houston (Ed.), Handbook on research on teacher education (pp. 291-310). New York: Macmillan. Carter, K. (1993). The place of story in the study of teaching and teacher education. Educational Researcher, 22(1), 5-12,18. Cochran, K. F., deRuiter, J. A., & King, R. A. (1993). Pedagogical content knowing: An integrative model for teacher preparation. Journal of Teacher Education, 44, 263272. Cochran, K. F., King, R. A., & deRuiter, J. A. (1991). Pedagogical content knowledge: A tentative model for teacher preparation. Paper presented at the Annual Meeting of the American Educational Research Association. Comins, N. F., & Kaufmann, W. J. (2003). Discovering the universe (6th ed.). New York: W.H. Freeman and company. Connelly, F. M., & Clandinin, D. J. (2000). Knowledge, context, and identity. In F. M. Connelly & D. J. Clandinin (Eds.), Shaping a professional identity: Stories of educational practice (pp. 1-5). New York: Teachers College Press. Dall'Alba, G. (1991). Foreshadowing conceptions of teaching. Research and development in higher education, 13, 293-297. Deci, E. L., & Ryan, R. M. (1985). Intrinsic motivation and self-determination in human behavior. New York: Plenum Press.
378 Devlin, M. (2006). Challenging accepted wisdom about the place of conceptions of teaching in university teaching improvement. International Journal of Teaching and Learning in Higher Education, 18(2), 112-119. Dewey, J. (1902). The child and the curriculum: University of Chicago Press. Dokter, E. F. C. (2008). It's the journey: Exploring the consequences of a professional development workshop for college astronomy faculty. Unpublished Doctoral dissertation, The University of Arizona, Tucson. Doyle, W. (1992). Curriculum and pedagogy. In P. Jackson (Ed.), Handbook of Research on Curriculum (pp. 486-516). New York: Macmillan. Eccles (Parsons), J. S., Adler, T. F., Futterman, R., Goff, S. B., Kaczala, C. M., Meece, J. L., et al. (1983). Expectations, values and academic behaviors. In J. T. Spence (Ed.), Perspective on achievement and achievement motivation. San Francisco: Freeman. Eccles, J. S., Wigfield, A., & Schiefele, U. (1998). Motivation. In N. Eisenberg (Ed.), Handbook of Child Psychology (5th ed., Vol. 3, pp. 1017-1095). New York: Wiley. Fang, Z. (1996). A review of research on teacher beliefs and practice. Educational Research, 38, 47-65. Fenstermacher, G. (1994). The knower and the known: The nature of knowledge in research on teaching. In L. Darling-Hammond (Ed.), Review of Research in Education (Vol. 20, pp. 3-56). Fernández-Baboa, J.-M., & Stiehl, J. (1995). The generic nature of pedagogical content knowledge among college professors. Teaching and Teacher Education, 11(3), 293-306. Gess-Newsome, J., Southerland, S. A., Johnston, A., & Woodbury, S. (2003). Educational reform, personal practical theories, and dissatisfaction: The anatomy of change in college science teaching. American Educational Research Journal, 40(3), 731-767.
379 Gilham, B. (2000a). Case study research methods. London: Continuum. Gilham, B. (2000b). The research interview. London: Continuum. Glesne, C. (2006). Becoming qualitative researchers: An introduction (3rd ed.): Pearson Education, Inc. Goldsmith, T. E., Johnson, P. J., & Acton, W. H. (1991). Assessing structural knowledge. Journal of Educational Psychology, 83(1), 88-96. Gomez, R. L. (1996). Conceptual maps and simulated teaching episodes as indicators of competence in teaching elementary mathematics. Journal of Educational Psychology, 88(3), 572-585. Grimmett, P. P., & MacKinnon, A. M. (1992). Craft knowledge and the education of teachers. Review of Research in Education, 18, 385-456. Grossman, P. L. (1990). The making of a teacher: Teacher knowledge and teacher education. New York: Teachers College Press. Gudmundsdottir, S. (1990). Values in pedagogical content knowledge. Journal of Teacher Education, 41(3), 44-52. Hake, R. R. (1998). Interactive-engagement versus traditional methods: A six-thousandstudent survey of mechanics test data for introductory physics courses. American Journal of Physics, 66(1), 64-74. Hashweh, M. Z. (2005). Teacher pedagogical constructions: A reconfiguration of pedagogical content knowledge. Teachers and Teaching, 11(3), 273-292. Hattie, J., & Marsh, H. W. (1996). The relationship between research and teaching – a meta-analysis. Review of Educational Research, 66(4), 507-542. Henderson, C., & Dancy, M. (2008). Physics faculty and educational researchers: Divergent expectations as barriers to the diffusion of innovations. American Journal of Physics, 76(1), 79-91.
380 Holt-Reynolds, D. (1999). Good readers, tood teachers? Subject matter expertise as a challenge in learning to teach. Harvard Educational Review, 69(1), 29-50. Hudgins, D. W. (2005). Investigation of the effects of ranking tasks on student understanding of key astronomy concepts. Unpublished Doctoral Dissertation, University of South Africa. Hudgins, D. W., Prather, E. E., Greyson, D. J., & Smits, D. P. (2006). Effectiveness of collaborative ranking tasks on student understanding of key astronomy concepts. Astronomy Education Review, 5(1), 1-22. Interlink. (2009). Tools for Pathfinder network analysis. Retrieved February 9, 2009, from http://interlinkinc.net/FAQ.html Ivie, R., Guo, S., & Carr, A. (2005). 2004 Physics & astronomy academic workforce: American Institute of Physics. Jacobs, G., & Gravett, S. (1998). University teachers' conception of their teaching role. South African Journal of Higher Education, 12(1), 54-60. John, P. D. (2006). Lesson planning and the student teacher: Re-thinking the dominant model. Journal of Curriculum Studies, 38(4), 483-498. Johns, M., Schmader, T., & Martens, A. (2005). Knowing is half the battle: Teaching stereotype threat as a means of improving women's math performance. Psychological Science, 16(3), 175-179. Jones, M. G., & Carter, G. (2007). Science teacher attitudes and beliefs. In S. K. Abell & N. G. Lederman (Eds.), Handbook of research on science education (pp. 10671104). Mahwah, NJ: Lwerence Erlbaum Associates. Kagan, D. M. (1992). Implications of research on teacher belief. Educational Psychologist, 27(1), 65-90.
381 Kane, R., Sandretto, S., & Heath, C. (2002). Telling half the story: A critical review of research on the teaching beliefs and practices of university professors. Review of Educational Research, 72(2), 177-228. Keller, J. M. (2006). Part I: Development of a concept inventory addressing students' beliefs and reasoning difficulties regarding the greenhouse effect; Part II: Distribution of chlorine measured by the Mars Odyssey Gamma Ray Spectrometer. Unpublished Doctoral Dissertation, The University of Arizona, Tucson. Kember, D. (1997). A reconceptualisation of the research into university academics' conceptions of teaching. Learning and Instruction, 7(3), 255-275. Kember, D., & Kwan, K.-P. (2000). Lecturers' approaches to teaching and their relationship to conceptions of good teaching. Instructional Science, 28, 469-490. Kennedy, M. (1998). Education reform and subject matter knowledge. Journal of Research in Science Teaching, 35(3), 249-263. Knowles, J. G. (1992). Models for teachers' biographies. In I. Goodson (Ed.), Studying teachers' lives (pp. 99-152). New York: Teacher College Press. Kokkelenberg, E. C., Dillon, M., & Christy, S. M. (2008). The effects of class size on student grades at a public university. Economics of Education Review, 27, 221233. Korthagen, F. A. J., & Kessels, J. P. A. M. (1999). Linking theory and practice: Changing the pedagogy of teacher education. Educational Researcher, 28(4), 4-17. Kugel, P. (1993). How professors develop as teachers. Studies in Higher Education, 18(3), 315-328. Lawrenz, F., Huffman, D., & Appeldoorn, K. (2005). Enhancing the instructional environment. Journal of College Science Teaching, 34(7), 40-44.
382 Lee, E., & Luft, J. A. (2008). Experienced secondary science teachers' representation of pedagogical content knowledge. International Journal of Science Education, 30(10), 1343-1363. Lehrer, K. (1990). Theory of knowledge. Boulder, CO: Westview Press. Leinhardt, G. (1990). Capturing craft knowledge in teaching. Educational Researcher, 19(2), 18-25. Leinhardt, G., & Greeno, J. G. (1986). The cognitive skill of teaching. Journal of Educational Psychology, 78(2), 75-95. Lenze, L. F., & Dirham, S. M. (1999). Learning what students understand. In R. J. M. a. Associates (Ed.), Faculty in new jobs: Mastering academic work (pp. 147-165). San Francisco: Jossey-Bass. Lincoln, Y. S., & Guba, E. G. (1985). Naturalistic inquiry. Beverly Hills, CA: Sage Publications. Lindell, R. S. (2001). Enhancing college students' understanding of lunar phases. Unpublished Doctoral Dissertation, University of Nebraska, Lincoln. Lortie, D. C. (1975). Schoolteacher: A sociological study. Chicago, IL: University of Chicago Press. Loughran, J. (2008). Exploring pedagogical content knowledge in science teacher education. International Journal of Science Education, 30(10), 1301-1320. Loughran, J., Mulhall, P., & Berry, A. (2004). In search of pedagogical content knowledge in science: Developing ways of articulating and documenting professional practice. Journal of Research in Science Teaching, 41(4), 370-391. Lowery, N. V. (2002). Construction of teacher knowledge in context: Preparing elementary teachers to teach mathematics and science. School Science and Mathematics, 102(2), 68-83.
383 Luft, J. A., & Roehrig, G. H. (2007). Capturing science teachers' epistemological beliefs: The development of the Teacher Beliefs Interview. Electronic Journal of Science Education, 11(2), 38-63. Lundgren, U. P. (1976). Model analysis of pedagogical processes: CWK Gleerup. Lunn, S. (2002). ‘What we think we can safely say …’: primary teachers’ views of the nature of science. British Educational Research Journal, 28(5), 649-672. Magnusson, S., Krajcik, J., & Borko, H. (1999). Nature, sources and development of pedagogical content knowledge for science teaching. In J. Gess-Newsome & N. G. Lederman (Eds.), Examining Pedagogical Content Knowledge (pp. 95-132). Dordrecht, The Netherlands: Kluwer. Marks, R. (1990). Pedagogical content knowledge: From a mathematical case to a modified conception. Journal of Teacher Education, 41(3), 3-11. Marsh, H. W. (1987). Students’ evaluation of university teaching: Research findings, methodoological issues, and directions for further research. International Journal of Educational Research, 11(3), 253-388. Marsh, H. W., & Hattie, J. (2002). The relation between research productivity and teaching effectiveness: Complementary, antagonistic, or independent constructs? Journal of Higher Education, 73, 603-641. Martin, E., Prosser, M., Trigwell, K., Ramsden, P., & Benjamin, J. (2000). What university teachers teach and how they teach it. Instructional Science, 28, 387412. Mazur, E. (1997). Peer instruction, a user's manual. Upper Saddle River, NJ: Prentice Hall. McAlpine, L., & Weston, C. (2000). Reflection: Issues related to improving professors' teaching and students' learning. Instructional Science, 28, 363-385.
384 McKeachie, W. J., & Svinicki, M. (Eds.). (2006). McKeachie's teaching tips. strategies, research, and theory for college and university teachers (12th ed.). Boston, MA: Houghton Mifflin Company. Menges, R. J., & Austin, A. E. (2001). Teaching in higher education. In V. Richardson (Ed.), Handbook of research on teaching (4th ed., pp. 1122-1156). Washington, D.C.: American Educational Research Association. Metcalfe, T. S. (2008). The production rate and employment of Ph.D. astronomers. Publications of the Astronomical Society of the Pacific, 120(864), 229-234. Nespor, J. (1987). The role of beliefs in the practice of teaching. Journal of Curriculum Studies, 19, 317-328. Ng, Y. K., Brogt, E., Chiosi, C., & Bertelli, G. (2002). Automatic Observation Rendering (AMORE) I: On a synthetic stellar population's colour magnitude diagram. Astronomy & Astrophysics, 392, 1129-1147. Novak, J. D. (1990). Concept maps and Vee diagrams: Two metacognitive tools for science and mathematics education. Instructional Science, 19, 29-52. Novak, J. D. (1998). Learning, creating, and using knowledge: Concept maps as facilitative tools in schools and corporations. Mahwah, NJ: Erlbaum. Novak, J. D., & Musonda, D. (1991). A twelve-year longitudinal study of science concept learning. American Educational Research Journal, 28(1), 117-153. Novak, J. D., & Wandersee, J. H. (1990). Special issue: Concept mapping. Journal of Research in Science Teaching, 27(10), 921-1075. Offerdahl, E. G. (2008). The nature of biochemistry instructors' thinking: Factors associated with change and growth. Unpublished Doctoral Dissertation, The University of Arizona, Tucson. Pajares, F. (1992). Teachers' beliefs and educational research: Cleaning up a messy construct. Review of Educational Research, 62(3), 307-332.
385 Panasuk, R. M., & Todd, J. (2005). Effectiveness of lesson planning: Factor analysis. Journal of Instructional Psychology, 32(3), 215-232. Patton, M. Q. (1990). Qualitative evaluation and research methods. Thousand Oaks, CA: Sage. Pickering, A. M. (2006). Learning about university teaching: Reflections on a research study investigating influences for change. Teaching in Higher Education, 11(3), 319-335. Prather, E. E., Slater, T. F., Adams, J. P., & Brissenden, G. L. (2008). Lecture-Tutorials for introductory astronomy (2nd ed.). Upper Sadle River, NJ: Prentice Hall. Pratt, D. D. (1992). Conceptions of teaching. Adult Education Quaterly, 42(4), 203-220. Prosser, M., Martin, E., Trigwell, K., Ramsden, P., & Lueckenhausen, G. (2005). Academics' experiences of understanding of their subject matter and the relationship of this to their experiences of teaching and learning. Instructional Science, 33, 137-157. Prosser, M., Trigwell, K., & Taylor, P. (1994). A phenomenographic study of academics' conceptions of science learning and teaching. Learning and Instruction, 4, 217232. Quinlan, K. M. (1999). Commonalities and controversy in context: A study of academic historians' educational beliefs. Teaching and Teacher Education, 15, 447-463. Rahilly, T. J., & Saroyan, A. (1997a). Characterizing poor and exemplary teaching in higher education. Implications for faculty development. Paper presented at the Annual Meeting of the American Educational Research Association. Rahilly, T. J., & Saroyan, A. (1997b). Memorable events in the classroom: Types of knowledge influencing professors' classroom teaching. Paper presented at the Annual Meeting of the American Educational Research Association.
386 Ramsden, P., & Moses, I. (1992). Association between research and teaching in Australian higher education. Higher Education, 23(3), 273-295. Richardson, V. (1996). The role of attitudes and beliefs in learning to teach. In J. Sikula (Ed.), Handbook of Research on Teacher Education (2nd ed., pp. 102-119). New York: MacMillan. Ronkowski, S. A. (1993). Scholarly teaching: Developmental stages of pedagogical scholarship. In L. Richlin (Ed.), Preparing Faculty for the New Conceptions of Scholarship. New Directions for Teaching and Learning, no 54. San Francisco: Jossey-Bass. Safayeni, F., Derbentseva, N., & Cañas, A. J. (2005). A theoretical note on concepts and the need for cyclic concept maps. Journal of Research in Science Teaching, 42(7), 741-761. Samuelowicz, K., & Bain, J. D. (2001). Revisiting academics' beliefs about teaching and learning. Higher Education, 41(3), 299-325. Schvaneveldt, R. W., Durso, F. T., & Dearholt, D. W. (1989). Network structures in proximity data. The psychology of learning and motivation, 24, 249-284. Schwartz, R. S., & Lederman, N. G. (2002). “It’s the nature of the beast”: The influence of knowledge and intention on learning and teaching nature of science. Journal of Research in Science Teaching, 39(3), 205-236. Shulman, L. S. (1986a). Paradigms and research programs in the study of teaching: A contemporary perspective. In M. C. Wittrock (Ed.), Handbook of research on teaching (3rd ed., pp. 3-36). New York: Macmillan. Shulman, L. S. (1986b). Those who understand: Knowledge growth in teaching. Educational Researcher, 15(2), 4-14. Shulman, L. S. (1987). Knowledge and teaching: Foundations of the new reform. Harvard Educational Review, 57, 1-22.
387 Shulman, L. S. (2004). The wisdom of practice: Essays on teaching, learning, and learning to teach. San Francisco: Jossey Bass. Slater, T. F., Adams, J. P., Brissenden, G. L., & Duncan, D. (2001). What topics are taught in introductory astronomy courses. The Physics Teacher, 39, 52-55. Smeby, J. (1998). Knowledge production and knowledge transmission. The interaction between research and teaching at universities [Electronic Version]. Teaching in Higher Education, 3, 5. Retrieved March 19, 2007. Smith, M. U., & Siegel, H. (2004). Knowing, believing, and understanding: What goals of science education? Science & Education, 13(6), 553-582. Southerland, S. A., Gess-Newsome, J., & Johnston, A. (2003). Portraying science in the classroom: The manifestation of scientists' beliefs in classroom practice. Journal of Research in Science Teaching, 40(7), 669-691. Southerland, S. A., Sinatra, G. M., & Matthews, M. R. (2001). Belief, knowledge, and science education. Educational Psychology Review, 13(4), 325-351. Stake, R. E. (2006). Multiple case study analysis. New York: Guilford Press. Stark, J. S. (2000). Planning introductory college courses: content, context and form. Instructional Science, 28, 413-438. Sternberg, R. J. (2005). Intelligence, competence, and expertise. In A. J. Elliot & C. S. Dweck (Eds.), Handbook of Competence and Motivation (pp. 15-30). New York: The Guilford Press. Stone, D. P. (1994). Universe: The infinite frontier: Coast Learning Systems. Talbot, R. M., & Briggs, D. C. (2008). Measuring the pedagogical sophistication of science teachers using the Flexible Application of Student-Centered Instruction (FASCI) instrument. Paper presented at the Annual Meeting of the American Educational Research Association.
388 Trigwell, K., & Prosser, M. (1996). Congruence between intention and strategy in university science teachers' approaches to teaching. Higher Education, 32(1), 7787. Trigwell, K., Prosser, M., Martin, E., & Ramsden, P. (2005). University teachers' experiences of change in their understanding of the subject matter they have taught. Teaching in Higher Education, 10(2), 251-264. Trigwell, K., Prosser, M., & Taylor, P. (1994). Qualitative differences in approaches to teaching first year university science. Higher Education, 27(1), 75-84. Udo, M. K., Ramsey, G. P., & Mallow, J. V. (2004). Science anxiety and gender in students taking general education science courses. Journal of Science Education and Technology, 13(4), 435-446. Van Driel, J. H., Bulte, A. M. W., & Verloop, N. (2007). The relationships between teachers' general beliefs about teaching and learing and their domain specific curricular beliefs. Learning and Instruction, 17, 156-171. Van Driel, J. H., Verloop, N., & De Vos, W. (1998). Developing science teachers’ pedagogical content knowledge. International Journal of Science Education, 35(6), 673-695. Veal, W. R., & Kubasko, D. S. (2003). Biology and geology teachers' domain-specific pedagogical content knowledge of evolution. Journal of Curriculum and Supervision, 18(4), 334-352. Veal, W. R., & MaKinster, J. G. (1999). Pedagogical content knowledge taxonomies. Electronic Journal of Science Education, 3(4). Walczyk, J. J., & Ramsey, L. L. (2003). Use of learner-centered instruction in college science and mathematics classrooms. Journal of Research in Science Teaching, 40(6), 566-584. Walczyk, J. J., Ramsey, L. L., & Zha, P. (2007). Obstacles to instructional innovation according to college science and mathematics faculty. Journal of Research in Science Teaching, 44(1), 85-106.
389 Weiss, M. S. (1992). The university professor as teacher: A study in secondary socialization. Journal of General Education, 41, 1-7. Wigfield, A., & Eccles, J. S. (1992). The development of achievement task values: A theoretical analysis. Developmental Review, 12, 265-310. Yin, R. K. (2003). Case study research: Design and methods (3rd ed.). Thousand Oaks: Sage Publications. Yung, B. H. W. (2001). Three views of fairness in a school-based assessment scheme of practical work in biology. International Journal of Science Education, 23(10), 985-1005. Zeilik, M. (2003). Birth of the Astonomy Diagnostic Test: Prototest evolution. Astronomy Education Review, 1(2), 46-52.