integrated into USGS mineral assessment data packages for each AOI with all data converted to Adobe. Illustrator format for cartographic purposes and ...
Chapter 1. Introduction to Summaries of Important Areas for Mineral Investment and Production Opportunities of Nonfuel Minerals in Afghanistan Contribution by Stephen G. Peters, Siddiq S. Kalaly, Peter G. Chirico, and Bernard E. Hubbard Although Afghanistan has abundant mineral resources (Peters, 2007; U.S. Department of Defense, 2010), most have not been successfully developed, nor have the resources been systematically explored since the 1970s using modern methods. Compilation and interpretation of Soviet data and information resulted in a preliminary quantitative resource assessment of nonfuel mineral resources in Afghanistan (Peters and others, 2007), according to the methods described by Singer and Menzie (2010). This preliminary assessment resulted in the recommendation of 24 areas of interest (AOIs) that required further study (fig. 1–1; table 1–1). Many of the areas were deemed likely to have potential for artisan mining (fig. 1–2). These AOIs and subareas (fig. 1–3) also were thought to be likely to develop near-term mineral production. Even though a wide variety of nonfuel mineral resources are known, some commodities are experiencing current favorable market prices, and therefore some AOIs may rank higher than others. In addition, some deposits in Afghanistan are near-surface bodies that have promising metallurgical and mining characteristics and therefore offer a shorter lead time, which might also affect their priority. This report summarizes the results of joint geologic activities from 2009 to 2011 between the U.S. Geological Survey (USGS), the U.S. Department of Defense Task Force for Business and Stability Operations (TFBSO), and the Ministry of Mines’s (MOM) Afghanistan Geological Survey (AGS). The work was funded by the TFBSO. The main activities included (1) compiling, interpreting, and reporting on data within areas of interest; (2) conducting scoping field missions to selected AOIs and gathering new data; (3) conducting additional fieldwork by the AGS; (4) performing activities related to industrial minerals; and (5) carrying out geohydrologic and hyperspectral studies in support of mineral development. Each chapter in this report summarizes mineral resource studies in each of 24 areas of interest (AOI) and in 33 subareas resulting from joint geologic and compilation activities that were conducted by the USGS, TFBSO, and AGS (figs. 1–1, 2, and 3). The “A” chapters in this report discuss the geologic setting and mineral resources of each AOI. Accompanying complementary chapters “B” and “C” address hyperspectral data and geohydrologic assessments, respectively, in each of the AOIs. In addition, supporting data packages and archival reports for each chapter and AOI are available on the public USGS Afghanistan Web site (http://afghanistan.cr.usgs.gov/) and (or) from the AGS Data Center in Kabul (http://mom.gov.af/en/; http://www.bgs.ac.uk/afghanminerals/). and in a separate viewer at http://mapdss2.er.usgs.gov/. Oil and gas assessments have been carried out separately (Klett and others, 2006). Because the focus of this report is on each of the 24 AOIs within Afghanistan (fig. 1–1), the potential for early economic extraction is emphasized in each chapter for a number of different mineral, commodity, and deposit types. The AOIs were selected by the USGS (Peters and others, 2007) where known deposits and resources had been identified earlier by Soviet and Afghanistan geologists. These AOIs were studied, sampled, and documented by the Soviets, and therefore the geology and mineral deposits in the AOIs are documented by a number of archival reports and maps. These AOIs commonly contain known measured mineral reserves or resources that were calculated from sampling in trenches, drill holes, and (or) underground workings. Road access also is common in most of the AOIs, permitting
a number of the AOIs to be field checked by USGS and TFBSO geologists between 2009 and 2011. These listed AOIs are the most likely areas to be mined first in Afghanistan; considering the vast number of mineralized areas in the country, they are the areas that bear the least amount of financial risk. The USGS compiled digital GIS data for each of the 24 AOIs and for each of the additional 33 subareas. These digital data include previously published data by the USGS and new data that were generated during the 2009-2011 joint USGS-TFBSO project. All data generated by the USGS are published and are available publicly. The sum of USGS digital data within each AOI comprises a Data Package (fig. 1–4). Data in each AOI are interpreted and summarized in individual chapters in this report, and these summaries, combined with scanned archival reports, maps, and other information, form Information Packages for each AOI. The information packages are designed to be used for the construction of Bidding Packages for each AOI and subarea (fig. 1–4). The bidding packages are intended to provide legal access to the mineral resources according to the mining law(s) of Afghanistan in order for investors and mining firms to develop the mineral wealth of the country. The inventory of individual datasets that were compiled for each AOI and its subareas is designated to be part of the AGS Data Center, Kabul (fig. 1–4). Most existing mineral-resource information was gathered from reports written between the early 1950s and about 1985 by geologists from the Union of Soviet Socialist Republics (USSR) and its Eastern European allies, who provided Afghanistan with technical assistance (Abdullah and others, 1977; Eppinger and others, 2006; British Geological Survey, 2008). This information, combined with the preliminary assessment by the USGS (Peters and others, 2007) and new hyperspectral and geohydrologic data compilations, provided the basis for the summary chapters in this report. The USGS also participated in the planning and execution of several USGS-TFBSO scoping missions to several of the AOIs where additional data were collected and areas were field checked. The potential and risk associated with many of the mineral occurrences is not directly measurable for a number of reasons: 1. Not all mineralized occurrences in Afghanistan are contained within the 24 priority areas identified (figs. 1–1, 1–2, and 1–3); 2. There are many other promising areas of mineral potential in addition to the AOIs; 3. Within and between the priority areas are anomalies of geophysical, geochemical, or remote sensing data; these anomalies have data signatures that differ from the surrounding areas but commonly have characteristics similar to mineralized areas within Afghanistan or elsewhere in the world. Commonly, these anomalies are remote and have not been visited or documented; however, they attest to the greater potential and future of mineral extraction in the country. 4. A number of industrial mineral areas are clustered in small basins that contain a variety of commodities, commonly clays, coal, gypsum, and limestone; examples of these are located in Herat, Baghlan, and Takhar Provinces (fig. 1–1). Industrial minerals in Afghanistan are summarized in chapter 16A and are addressed in several of the AOIs, specifically the Baghlan Clay-Gypsum, Bakhud Fluorite, Dudkash Industrial Minerals, Ghunday-Achin-Magnesite-Talc, Khanneshin Carbonatite, North Heart Barium-Limestone, Nuristan Pegmatites, South Helmand Travertine, and Takhar Evaporite AOIs (table 1–1; figs. 1–1 and 1–2). Materials and commodities—such as clay, gypsum, limestone, crushed stone, building stone, celestite, phosphate, and so on—in these AOIs are commonly used for local industries and for construction of infrastructure. Areas where a variety of industrial mineral occurrences cluster have the potential to be areas of future industrial centers. Sand and gravel deposits were grouped into two deposit types for assessment in Peters and others (2007). The two groupings were (1) fluvial deposits associated with rivers and streams in watersheds with or without glaciation and (2) sand and gravel deposits in alluvial fans developed by streams as they flow from mountainous areas into flatter areas. The quantitative assessment provided an estimate of how much sand and gravel might be present in a set of river basins as well as near roads and towns within 2
Summaries of Important Areas for Mineral Investment and Production Opportunities of Nonfuel Minerals in Afghanistan
each basin that may be more accessible for development. These areas considered permissive for sand and gravel deposits were included as shapefiles in each data package for each AOI. Lithium resources are addressed in chapters on pegmatites—the Daykundi Tin-Tungsten AOI (chapter 5A) and the Nuristan Pegmatite AOI (chapter 24A) (table 1–1). An assessment of lithium in these pegmatites was not undertaken by the USGS, nor were undiscovered resources estimated for boron or lithium in the evaporite lakes due to a paucity of understanding and data (Peters and others, 2007). A lithium project was initiated in the evaporite lakes by the TFBSO between 2009 and 2010 in Herat, Ghazni, Nimruz, and Farah Provinces, and after field missions to five locations, TFBSO geologists estimated that Afghanistan may have significant lithium in its many evaporite lakes (U.S. Department of Defense Task Force for Business and Stability Operations, 2011). All reports on the lithium missions are available through the TFBSO. The following sections of this introductory chapter outline the makeup of the data and information packages that accompany the AOIs, the new Advanced Spaceborne Thermal Emission and Reflection (ASTER) radiometer Global Digital Elevation Map (GDEM) data, and other new datasets, including hydrographic databases, ASTER mapping, hyperspectral data, geophysical data, and geohydrology data and interpretations. The final parts of this introductory chapter summarize the mineral scoping field missions conducted as part of the USGS-TBSFO-AGS project and summarize the archival reports and data available in Kabul. A summary of the important AOIs is also included.
Chapter 1. Introduction
3
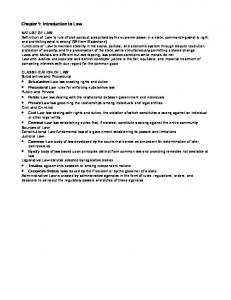
Figure 1–1. Map of Afghanistan showing the areas of interest, which are summarized by chapter in this report and which were the focus of the U.S. Geological Survey-U.S. Department of Defense Task Force for Business and Stability Operations scoping project that took place during fiscal years 2009–2011. 4
Summaries of Important Areas for Mineral Investment and Production Opportunities of Nonfuel Minerals in Afghanistan
Figure 1–2.
Map of Afghanistan showing the mineral areas of interest and potential areas for small (placer or artisanal) mining operations.
Chapter 1. Introduction
5
Figure 1–3. Map of Afghanistan showing areas of interest (AOIs) discussed in this report (green rectangles), and subareas within each AOI (purple rectangles). Base map from data published in Peters and others (2007).
6
Summaries of Important Areas for Mineral Investment and Production Opportunities of Nonfuel Minerals in Afghanistan
Figure 1–4. Flow chart and classification of data and information packages for each mineral area of interest leading to a bidding package. The area in blue is the information package, a combination of U.S. Geological Survey and other data. Each data package and information package complements the chapters in this report and is available athttp://afghanistan.cr.usgs.gov/.
Chapter 1. Introduction
7
Table 1–1.
List of chapters in this report showing areas of interest (AOIs) and the presence or absence of subareas and commodities in each AOI.
[Ag, silver; As, arsenic; ASTER, Advanced Spaceborne Thermal Emission and Reflection radiometer; Au, gold; Ba, barium; Co, cobalt, Cu, copper, Fe, iron; Hg, mercury; Li, lithium; Mo, molybdenum; NA, not available; Nb, niobium; P, phosphorus; Pb, lead; REE, rare earth elements; Sb, antimony; Sn, tin; Sr, strontium; Ta, tantalum; Th, thorium; U, uranium; W, tungsten; Zn, zinc] Minor or possible Chapter Area of interest Subareas Deposit models Main commodities Comments commodities 2A Aynak copper (Logar chromite) Yes Sediment-hosted copper, Cu, Co, Ag Marble chromite, Reserves at Aynak, Jawhar, and Darband 2B podiform chromite asbestos, talc deposits 2C 3A Badakhshan gold Yes Gold-quartz veins, gold and Au, Fe Ag, Cu, U Weka Dur deposit contains 958 kilograms of 3B iron skarn gold 3C 4A Balkhab copper Yes Volcanogenic massive sulfide Cu Pb, Zn, coal Balkhab copper prospect 4B 4C 5A Daykundi tin, tungsten, and lithium No Greisen tin-tungsten, tinSn, W, Li Cu, Pb-Zn, Taghawlor lithium pegmatite field 5B tungsten-skarn, 5C lithium pegmatite 6A Dusar-Shaida copper and tin Yes Porphyry copper, Cu, Sn Pb, Zn, W Shaida Porphyry copper prospect 6B. volcanogenic massive 6C sulfide, tin-copper skarn 7A Haji-Gak iron Yes Volcanogenic iron(?) Fe Ba, marble, 1.7 billion metric tons plus iron ore 7B sandstone, U, Cu 7C 7D 8A Katawas gold Yes Epithermal gold-silver Ag, Ag (?) Hg, W(?) ASTER anomaly 8B 8c 9A Karnak-Khanjar mercury Yes Epithermal mercury, base- Hg Sb, As, Au, Ag(?) Mercury belt 9B metal skarn 9C 10A Kundalan copper and gold Yes Porphyry copper-gold and Cu, Au, Mo Ag, Pb Copper and gold resource; multiple 10B skarn occurrences 10C 11A Nalbandon lead and zinc Yes Sediment-hosted lead-zinc Pb, Zn Ag(?) Extensive mineral field 11B 11C 12A North Takhar gold placer No Gold placer Au NA Past production, gold resources 12C 13A Panjsher Valley emerald, iron, and No Emerald, sedimentary iron Emerald, Fe, Ag NA Major emerald mining area 13B silver and silver 13C
8
Summaries of Important Areas for Mineral Investment and Production Opportunities of Nonfuel Minerals in Afghanistan
Chapter 14A 14B 14C 15A 15B 15C 17A 17B 17C 18A 18B 18C 19A 19B 19C 20A 20B 20C 21A 21B 21C 22A 22B 22C 23A 23B 23C 24A 24B 24C 25A 25B 25C 26A 26B 26C
Area of interest
Subareas
Deposit models
Main commodities
Minor or possible commodities Cu(?)
Comments
Tourmaline tin
No
Tin-tungsten vein, placer tin Sn (W)
Zarkashan copper and gold
Yes
Porphyry copper-gold and skarn
Cu, Au
Baghlan clay and gypsum
No
Bauxite, clay, gypsum
Bauxite, clay (kaolin), – gypsum
Bakhud fluorite
No
Dudkash industrial minerals
No
Ghunday-Achin magnesite and talc
Yes
Sediment-hosted fluorite, Fluorite Zn, Pb, Ag, Sb, Ba Main fluorite district in Afghanistan fluorite vein, polymetallic skarn Limestone cement, dolomite, Limestone cement, Coal Puli Khumri area and Tangi-Murch celestite bedded celestite, gypsum dolomite, celestite, deposit clay gypsum clay, Metasomatic magnesite-talc, Magnesite, talc, Graphic, coal, marble Achin and Ghunday magnesite-talc deposits ultramafic-hosted asbestos asbestos near Tora Bora
Khanneshin carbonatite
Yes
Carbonatite
Kunduz celestite
No
Bedded celestite, oil and gas, celestite (SrSO4) bedded phosphate deposits
North Herat barium and limestone
No
Nuristan pegmatite
No
Bedded barite, vein barite, chemical limestone, marble, clay, iron skarn Pegmatites
South Helmand travertine
No
Travertine, porphyry copper- Travertine (onyx) gold
Cu, Au, Mo
Travertine production, porphyry copper-gold deposits in adjacent Pakistan
Takhar evaporite
No
Salt dome, clay, sandstone
Coal, oil and gas
Rock salt deposit at Namakab; porcelain and pottery clay
REE, U, P
Ag, Pb
Copper and gold resource; multiple occurrences, gold placers Tala Barfak bauxite deposit contains resources. Clay deposits are extensive.
Th, Ba, Sr, limestone Significant REE prospect and uranium resources Oil and gas
Ba, limestone, marble, NA clay, Fe REE, Li, Sn, and mica Ta, Nb
Salt, clay silica
Previous mining for placer tin
About 1 million metric tons of celestite in speculative resource and Katar oil occurrence Major barite field, marble factory, industrial center Paron (Jamanak-Pasgushta) and Pachigram pegmatite fields; lithium resources
Chapter 1. Introduction
9
1.1 Data and Information Packages Digital geographic information system (GIS) data were compiled for each AOI and its subareas, as illustrated in figures 1–5 and 1–6a,b. The purpose of the data compilation was to provide Data packages and information packages for each AOI and subarea to be publically available in the AGS Data Center, Kabul and on the USGS Website. These packages are intended to be used by the Afghanistan Government to complement, backup, and construct bidding packages for potential investors in each of the AOIs (fig. 1–4). These data also are the basis for the summary chapters in this report. Data consist of previously acquired and published digital data (Peters and others, 2007) and new data generated between 2009 and 2011, such as: New 20-m and 40-m Digital Elevation Models (DEMs) Advanced Land Observation Satellite (ALOS) multispectral images Hyperspectral data and maps ASTER mapping data and maps 2008 geophysical data Data from USGS-TFBSO scoping missions Data from AGS fieldwork Data gathered, scanned, compiled, and interpreted from archives of the AGS and MOM The data compilation process consisted of many parts (fig. 1–5). Completion of the 57 spatial Data packages was dependent on communication and collaboration among the AGS, the MOM, the TFBSO, and various USGS disciplinary expertise teams. Spatial data within each AOI data package are from published USGS data. Inclusion of data into AOIs or subareas is based on the extent of the spatial data for each AOI. The datasets available for Afghanistan depend on the geographical location and extent of each dataset. Therefore, each data package does not contain the same data. For example, the German geologic data only cover southern Afghanistan, and thus, are only available in the southern AOIs. The Soviet geologic data, however, span the whole of Afghanistan and are compiled in all of the AOIs and subareas (fig. 1–6). Data Standards (fig. 1–5) were applied to all data packages so that they comply with the following data standards: 1. Vector data—are in shapefile format. 2. Raster data—are in Tagged Image File Format (TIFF). 3. Projection parameters—WGS 1984 Datum is used for projecting data within the AOIs. USGS AOIs in Afghanistan span two Universal Transverse Mercator (UTM) zones. Data in AOIs or subareas are projected to their local UTM zones (for example, UTM Zone 41 N. or UTM Zone 42 N.) (fig. 1–7). 4. Metadata—are compliant with the Federal Geographic Data Committee (FGDC) standards. All Metadata files are in Extensible Markup Language (XML) format and imbedded into each spatial dataset. Compiled data were inventoried (fig. 1–5) for each AOI and subarea by use of inventory spreadsheets for each of the 57 data packages. These inventory spreadsheets are compiled in appendix I. The inventory spreadsheets list available spatial data and categorize the data into groups as they appear in each of the ArcMap map projects (MXDs) (for example, geologic data, hydrologic data). ArcMap Maps (MXDs) and Legends (Layer Files) were created for each of the 57 data packages. MXDs are projected to the local UTM zone of each of the AOIs and subareas (fig. 1–5). Data within the MXDs are organized into data groups and have been attributed with a rectified legend. For example, when the countrywide Soviet geologic data were subset to each AOI and subarea, in most cases, the subsets did not contain the same geologic units as the original dataset. Thus, each subset of the Soviet geologic data was analyzed to determine which geologic units actually covered the subset area. Then, the legend of each subset was rectified to reflect the proper geologic units present in the AOI. The data 10
Summaries of Important Areas for Mineral Investment and Production Opportunities of Nonfuel Minerals in Afghanistan
legends can be viewed and edited within the MXD and are saved with each dataset in the file directories of the data packages. Data grouping (figs. 1–5 and 1–8) of the individual 57 datasets was performed throughout the compilation activity. Because viewing of datasets simultaneously in the table of contents of the MXD is confusing, all the datasets within each MXD and within the file directory of the data packages are organized into groups of similar data. Specifically, datasets that convey hydrographic insight are grouped under hydrologic data, and so on. A data naming convention (fig. 1–5) was addressed as each dataset was added to the database. In many cases, the name of the new file was the same as the original file from the published dataset. Map templates (fig. 1–5) were created for each of the 57 ArcMap MXDs. Each map template was designed to allow the end user to quickly plot out hard copies of desired themes. The map templates contain and exceed all the basic map elements required by cartographic standards, such as title, location illustration, scale (text and bar), north arrow (true north and magnetic declination), and grid. Furthermore, through trial and error, each map template has been sized to produce hard copy maps that can be hand carried and used in the field. These data and information packages are available for download from http://afghanistan.cr.usgs.gov/.
Figure 1–5.
Spatial data package compilation procedure and protocol.
Chapter 1. Introduction
11
Quality assurance and quality control (QA/QC) (fig. 1–5) were implemented across all data packages to ensure a consistent product; standards for data formats were established prior to the start of the project. Data were integrated in a data package only if (1) data were subset to each AOI and subarea; (2) data were projected to the local UTM zones; and (or) (3) metadata were established and comply with FGDC standards. Integration of data into the data package means that the data were in an ArcGIS map project. In this phase, the data were tweaked to ensure that (1) the legend was properly attributed and saved in the file directory; (2) the data were labeled in the map project (for example, Geologic unit); (3) the data were transparent, if the dataset was of a type that could be draped over on the terrain so that topographic features are visible; and (4) the data were grouped and labeled in the table of contents of the ArcGIS map projects.
1.2 ASTER GDEM Digital Elevation and Hydrographic Databases Compilation and delivery of new multi-use Advanced Spaceborne Thermal Emission and Reflection (ASTER) radiometer Global Digital Elevation Map (GDEM) digital elevation and hydrographic databases were designed for the 24 USGS AOIs and subareas and include (1) processed Digital Elevation Models (DEMs), (2) 100-m, 50-m, and 25-m interval contour datasets, (3) shaded relief (depicting cartographic relief in 3-D), and (4) detailed topographic databases with hydrographic flow paths (fig. 1–9). A DEM is a digital cartographic representation of elevation. Launched in 1999 aboard the Canadian and Japanese) Terra spacecraft, managed by NASA (http://terra.nasa.gov)/, the imaging instrument ASTER utilizes its Visible and Near Infrared (VNIR) (backwards looking) sensor to generate stereo pairs, matched with its Short Wave Infrared (SWIR) sensor to generate DEMs. The accuracy of ASTER GDEM has been validated by Federal agencies such as USGS and the National Geospatial-Intelligence Agency (NGA), as well as third-party assessors. The multiuse ASTER GDEM digital elevation and hydrographic data were developed for the AOIs to improve location and analytical capabilities. Prior to 2010 all USGS products used Shuttle Radar Topography Mission (SRTM) DEM 90-m data. The ASTER is a more accurate sensor than SRTM in measuring elevation in areas with higher and steeper elevations. The main DEM products include reference maps that are provided for each AOI and subarea. Each reference map contains place names and major streams, as well as province and district boundaries (fig. 1–9). Datasets are provided in GIS user-ready format for use with most GIS software. Data packages contain FGDC-compliant metadata for each dataset component. ASTER GDEM applications include methods for mineral assessments and geologic mapping by showing geologic structure and site topography (Chirico, 2011). All data layers are included and integrated into USGS mineral assessment data packages for each AOI with all data converted to Adobe Illustrator format for cartographic purposes and publication. These data are available on the Web at http://afghanistan.cr.usgs.gov/. Examples of ASTER GDEM products are portrayed in figures 1–10, 1–11, 1–12, and 1–13.
12
Summaries of Important Areas for Mineral Investment and Production Opportunities of Nonfuel Minerals in Afghanistan
Figure1–6. Maps showing an example of different datasets overlaying different areas of interest. All areas of interest do not contain the same data. (a) German geologic data cover only the southern part of Afghanistan. (b) Russian geologic data are available for all of Afghanistan (Doebrich and others, 2006). Chapter 1. Introduction
13
Figure 1–7. The USGS project areas in Afghanistan span across two UTM Zones. UTM Zone 41 N. (62°E. to 66°E.) lies to the west and UTM Zone 42 N. (66°E. to 72°E.) lies to the east.
Figure 1–8. Map showing example of data clipping to area of interest outline to internal subarea. (a) Russian geologic data clipped to Balkhab copper area of interest. (b) Russian geologic data clipped to the Balkhab Copper Prospect subarea (Doebrich and others, 2006).
14
Summaries of Important Areas for Mineral Investment and Production Opportunities of Nonfuel Minerals in Afghanistan
Figure 1–9. Geoprocessing history of the Advanced Spaceborne Thermal Emission and Reflection (ASTER) radiometer Global Digital Elevation Map (GDEM) datasets compiled and generated for the areas of interest in the U.S. Geological Survey-U.S. Department of Defense Task Force for Business and Stability Operations Project.
Chapter 1. Introduction
15
Figure 1–10. Example of topographic and geologic maps generated with the new Advanced Spaceborne Thermal Emission and Reflection (ASTER) radiometer Global Digital Elevation Map (GDEM) 30-meter contour mapping and shaded relief. Example from the subarea within the Dusar-Shaida area of interest, described in chapters 6A, 6B, and 6C in this report. 16
Summaries of Important Areas for Mineral Investment and Production Opportunities of Nonfuel Minerals in Afghanistan
Figure 1–11. Visual applications: DEM data enable users to visualize landforms to enhance mapping and resource assessments. Example from the Karnak-Khanjar mercury area of interest, described in chapters 9A, 9B, and 9C in this report.
Chapter 1. Introduction
17
Figure 1–12. Example of product from the Advanced Spaceborne Thermal Emission and Reflection (ASTER) radiometer Global Digital Elevation Map (GDEM) 30-meter dataset, showing place map for the Dudkash industrial minerals area of interest, described in chapters 19A, 19B, and 19C in this report. These maps are available for all areas of interest.
18
Summaries of Important Areas for Mineral Investment and Production Opportunities of Nonfuel Minerals in Afghanistan
Figure 1–13. Three-dimensional map of the Khanneshin carbonatite area of interest, discussed in chapters 21A, 21B, and 21C, produced by Advanced Spaceborne Thermal Emission and Reflection (ASTER) radiometer Global Digital Elevation Map (GDEM) 30-meter data. Scale is in meters.
Chapter 1. Introduction
19
1.4 ASTER Mapping The ASTER radiometer consists of multispectral bands (14 bands) and 1 backward-looking band for stereo pair DEM. The 60 by 60 km acquisition area (along a continuous swath) is within a 16-day repeat cycle (4 days with off-nadir pointing) and has been in operation since 2001 and now has global coverage. Mapping of ASTER images produced anomaly maps for (1) carbonate minerals for cement, and clays for bricks; (2) other industrial minerals (for example, magnesite, gypsum, silica); and (3) mineral anomalies possibly related to metallic ores.
Figure 1–14. Map showing “lights at night,” major centers of population of distribution by Advanced Spaceborne Thermal Emission and Reflection (ASTER) radiometer mapping (solid black planar outline) conducted for industrial minerals. The map shows 2005-2008 Landscan Change Analysis of the populations. Warmer colors indicate higher concentrations of population. The primary goals of the ASTER mapping task between 2009 and 2011 were to use ASTER to distinguish carbonate rock exposures from clastic sedimentary rock exposures and to delineate favorable areas that can target quarries to support cement and building industries within the AOIs. Secondary by-products of the task were to delineate favorable areas for mafic and ultramafic rocks that may contain talc, asbestos, chromite, and clay-rich bedded sedimentary deposits (for example, brick and pottery). In addition, alteration zones indicative of volcanogenic massive sulfide and porphyry copper deposits were mapped in host metamorphic and volcanic rocks. 20
Summaries of Important Areas for Mineral Investment and Production Opportunities of Nonfuel Minerals in Afghanistan
Specific localities mapped in detail were the Balkhab copper, Zarkashan copper and gold, and Tourmaline Tin AOIs. Spatial representation of the distribution of ASTER mapping of major population centers, and AOIs are contained on figures 1–14, 1–15, and 1–16. The results of the ASTER mapping for each AOI are contained within the data packages and are available on the Web at http://afghanistan.cr.usgs.gov/ and from the AGS Data Center in Kabul (http://mom.gov.af/en; http://www.bgs.ac.uk/afghanminerals/).
Figure 1–15. Map showing location of areas of interest (AOIs) and subareas and distribution of Advanced Spaceborne Thermal Emission and Reflection (ASTER) radiometer mapping coverage. Note that detailed mapping was also carried out on Tourmaline, Zarkashan, and Balkhab AOIs (stars). These data are available in the data packages, which are available on the Web at http://afghanistan.cr.usgs.gov/ and from the AGS Data Center, Kabul (http://mom.gov.af/en; http://www.bgs.ac.uk/afghanminerals/). What are industrial minerals and what can ASTER tell us about them and (or) their value? These minerals tend to be high-bulk, low-unit-value materials where transportation is a significant cost factor when the minerals are utilized at distances from their source areas. Mapping results are best used in context with other ancillary data such as roads, population, and infrastructure to determine an “index of development” for identifying high-priority source material areas. The quality of industrial minerals varies depending on local practice. For example, ASTER can provide some information about clay types, clay abundances, mixtures, and impurities but cannot provide information about local practice, manufacturing, and suitability. Also, carbonate rocks contain varying amounts of impurities such as organic compounds and detrital, insoluble minerals as well as clays, quartz, and feldspars. ASTER can provide some information about carbonate purity such as insoluble residue contents (based on weathering) and can also suggest the degree of mixing between calcite and dolomite. Chapter 1. Introduction
21
Figure 1–16. Map showing location of areas of interest and total coverages for Advanced Spaceborne Thermal Emission and Reflection (ASTER) radiometer mapping resulting from the recent compilations and mapping. IM, industrial mineral.
1.5 Hyperspectral Data Hyperspectral data delivery to the data packages consisted of compiling the hyperspectral data into a geodatabase within 24 areas and 28 subareas with metadata. The datasets included (1) a surface materials map of Afghanistan: iron-bearing minerals (1µm—28 classes) and (2) a surface materials map of Afghanistan: carbonates, phyllosilicates, sulfates, altered minerals, and other minerals (2µm—32 classes). The geodatabase also included national datasets of mineral maps and ancillary datasets for each AOI and subarea. The template geodatabases (GDB), generated using batch clipping from the Arctoolbox to create metadata for each national mineral map and resulted in the generation of a total of 104 *.xml files, which are FGDC-compliant (http://geo-nsdi.er.usgs.gov/validation/). Computer analysis of the HyMap spectroscopic data of each AOI in Afghanistan used spectrum matching techniques to identify the occurrence of selected materials at the surface based on characteristic absorption features (absorption bands) in the HyMap data compared to a library of spectral standards (Cocks and others, 1998; Kokaly and others, 2008). Previous USGS analyses of existing geologic data of Afghanistan revealed numerous areas with indications of potential mineral resources of various types (Peters and others, 2007). From these areas of interest, several were selected for follow-on studies using modern hyperspectral remote sensing data to further characterize surface materials. Examples of hyperspectral mapping and analysis in selected AOIs are shown in figures 1–17a,b, 1–18a,b, and 1–19.
22
Summaries of Important Areas for Mineral Investment and Production Opportunities of Nonfuel Minerals in Afghanistan
Figure 1–17. Example of hyperspectral mapping at the Balkhab area of interest showing both (a) iron-bearing and (b) carbonate-phyllosyilicate distributions. Images of these data are included in the data packages for each area of interest and are available for download at http://afghanistan.cr.usgs.gov/ and from the AGS Data Center in Kabul (http://mom.gov.af/en; http://www.bgs.ac.uk/afghanminerals/). Chapter 1. Introduction
23
Figure 1–18. Examples of hyperspectral mapping at the Khanneshin carbonatite area of interest showing both (a) iron-bearing and (b) carbonatephyllosyilicate presentations. Images of these data are included in the data packages for each area of interest and are available for download at http://afghanistan.cr.usgs.gov/ and from the AGS Data Center in Kabul (http://mom.gov.af/en; http://www.bgs.ac.uk/afghanminerals/). 24
Summaries of Important Areas for Mineral Investment and Production Opportunities of Nonfuel Minerals in Afghanistan
Figure 1–19. Three-dimensional diagram showing anomalous contact zones (blue, purple, orange, yellow, and green) around the Zarkashan intrusive (gray areas in right central parts of diagram) in the Zarkashan copper and gold area of interest. These anomalous zones represent combinations of favorable alteration minerals that are associated with copper and gold mineralization. The hyperspectral data were analyzed as part of the summary chapters in this report and are included in the data packages for each area of interest.
1.6 Geophysical Data Geophysical data delivery involved clipping aeromagnetic and gravity data for each AOI and subareas with embedded metadata for each AOI data package. The main new data assimilated within the existing dataset were from the aeromagnetic survey in Afghanistan, which is a composite of aeromagnetic and ground magnetic surveys conducted through 2008 (Shenwary and others, 2011) (fig. 1–20). These data were newly published in 2010. The previous datasets (Sweeney and others, 2006a, b; 2007) are integrated within the new compilation and include: Afghanistan gravity dataset—http://pubs.usgs.gov/of/2008/1089/ Russian magnetic dataset—http://pubs.usgs.gov/of/2006/1325/ Russian radiometric dataset—http://pubs.usgs.gov/of/2007/1042/ German magnetic dataset—http://pubs.usgs.gov/of/2006/1204/ The geophysical datasets were batch clipped using Arctoolbox for each AOI and subarea where data were available. An example of the images supplied to the database is contained on figure 1–20. Additionally, a unique color legend was developed for inclusion with the data for each clipped set of data. Images of these data are included in the data packages for each AOI and are available for download at http://afghanistan.cr.usgs.gov/ and from the AGS Data Center, Kabul (http://mom.gov.af/en; http://www.bgs.ac.uk/afghanminerals/). Chapter 1. Introduction
25
Figure 1–20. Map of the Khanneshin carbonatite area of interest (see fig. 1–1) with shaded relief and aeromagnetic data from Shenwary and others (2011). Smaller map inset shows subarea of the Carbonatite Volcano subarea. This is an example of the new (2008) composite geophysical data for the Khanneshin carbonatite area of interest and subarea.
1.7 Geohydrologic Data and Interpretations Water is needed for processing mineral resources in Afghanistan. However, water also is needed for existing communities and for associated community growth that may accompany a developing mining economy. The climate and vegetation within each AOI are described to provide information on 26
Summaries of Important Areas for Mineral Investment and Production Opportunities of Nonfuel Minerals in Afghanistan
the seasonal availability of water and on the seasonal demands for water. The topography and demographics also are described in each summary chapter (“C” chapters) to provide information on the villages, towns, and cities and their locations in the AOIs. The availability of surface-water and groundwater resources, the current use of water resources, and potential concerns, or data needs, regarding water use for mining activities also are discussed in each chapter C. In each chapter, a section on geohydrological data presentation and analysis discusses the influence of geology, population density, lineaments, and lineament density for rock aquifer groundwater (figs. 1–21a-d).
Figure 1–21. Examples of geohydrological data presentation and analysis from the Badakhshan gold area of interest, discussed in chapter 3C. (a) Generalized geologic map. (b) Population density (warmer colors equal higher density). (c) Lineaments and lineament density based on 30-meter imagery. (d) Lineaments and lineament density based on 15-meter imagery. Geohydrologic activities in support of mineral development included the completion of the analysis of historical streamflows for Afghanistan. Results of this analysis are available in WilliamsChapter 1. Introduction
27
Sether (2008), Olson and Williams-Sether (2010), and Vining (2010). Because all historical streamflow data for Afghanistan are now available in the USGS digital database, it was possible to estimate streamflows for each of the AOIs. More detailed hydrogeologic assessments also are provided in each chapter C in this report for areas visited during the 2009–2011 USGS-TFBSO scoping missions for the Khanneshin carbonatite, Balkhab copper, Haji-Gak iron, Aynak copper and cobalt, and Dusar-Shaida copper and tin AOIs.
1.8 Mineral Scoping Missions Mineral scoping missions were undertaken during 2009, 2010, and 2011 by USGS and TFBSO personnel to the Khanneshin carbonatite, Chaigai Hills travertine, Balkhab copper, Haji-Gak iron, Aynak copper and cobalt, Kundalan copper and gold, Zarkashan copper and gold, and Dusar-Shaida copper and tin AOIs (fig. 1–1). Transport, security, logistics, and access in each case were arranged through the TFBSO, its contractors, and the International Security Assistance Force (ISAF) and U.S. Military. In many cases, the scoping missions received full military support from the United States or ISAF-NATO command, and in other cases certified security and aviation contractors were used (figs. 1–22a-d and 1–23). Technical fieldwork on the scoping missions consisted of short 1-day visits (30 minutes to several hours) that involved rapid geologic mapping, geochemical, and hydrologic sampling (figs. 1–22a-d). When the field parties landed where known Soviet observations had been taken, the old data and observations were confirmed and deemed accurate.
Figure 1–22. Photographs of U.S. Geological Survey-U.S. Department of Defense Task Force for Business and Stability Operations scoping missions. (a) Preparation and planning of missions at forward operating base for Kundalan copper and gold area of interest. Photograph by Stephen Peters, U.S. Geological Survey. (b) Stream sediment sampling in Zarkashan copper and gold AOI. Photograph by Stephen Peters. (c) Field team for second Khanneshin scoping mission. Photograph by unidentified soldier. (d) Reconnaissance mapping and sampling in the Haji-Gak AOI. Photograph by Thomas J. Mack, U.S. Geological Survey.
28
Summaries of Important Areas for Mineral Investment and Production Opportunities of Nonfuel Minerals in Afghanistan
Figure 1–23. Map showing areas where mineral scoping missions were conducted by the U.S. Geological Survey and the U.S. Department of Defense Task Force for Business and Stability Operations. The field visits took place between September 2009 and March 2011.
Chapter 1. Introduction
29
1.9 Archival Data and Reports Archival data and reports were compiled and assembled for each AOI and are included in the information packages. The archives of the AGS and Ministry of Mines (MOM) have extensive holdings (figs. 1–24a-d) and have been summarized in Abdullah and others (1977), United Nations Economic and Social Commission for Asia and the Pacific (1995), and Eppinger and others (2006) and were cataloged and indexed by the British Geological Survey (2008). Afghanistan’s recent 30 years of conflict left many traditional archival institutions in ruins, and all data collection activities stopped at some point during the conflict years. Recently, nongovernment agencies (NGOs), foreign government agencies, and the Afghan government have begun technical investigations of natural science issues; however, these activities are limited. Therefore, USGS efforts have focused on searches of the literature, use of companion geologic data and remotely sensed data, acquisition or restoration of as much historic data as possible, use of basic principles, and drawing of analogies from limited first-hand knowledge of some areas of Afghanistan. The quantity of data available for each AOI is not consistent; therefore the content of each summary chapter varies. In addition, the individual chapters use place names and spellings as consistently as possible; however, there are no universally agreed upon translations from the various Afghan languages and dialects to English. Place name spellings in different digital databases vary, and therefore different spellings vary within the report and sometimes within individual chapters. The data packages and scanned reports and maps for each AOI are available in the Data Center at the AGS (fig. 1–25).
Figure 1–24. Photographs of the Afghanistan Geological Survey Archival Report and Map Library, Kabul. (a) Report Library showing books on table and shelves. (b) Typical bindings illustrating the condition of many of the reports. (c) Map room and map table. (d) Close-up of reports showing indexing numbers. Photographs by Fahim Zaheer, USGS Liaison Officer. 30
Summaries of Important Areas for Mineral Investment and Production Opportunities of Nonfuel Minerals in Afghanistan
Figure 1–25. Photograph of Afghanistan Geological Survey (AGS) Data Center installed in the AGS building in May 2011. The U.S. Geological Survey (USGS) regional data and the data for each of the 24 areas of interest and the 33 subareas that accompany this report are available from this data center. Photograph by Fahim Zaheer, USGS Liaison Officer.
1.10 Summary of Important Areas of Interest A number of areas of interest (AOIs) and subareas were identified as important because of interpretations of new data gathered and compiled by the USGS and TFBSO between 2009 and 2011. This work confirmed the geologic concepts or mineral potential that had been interpreted from previous compilations in these areas. These areas are Badakshan gold, Balkhab copper, Haji-Gak iron, Northern Aynak copper and cobalt (and chromite), Zarkashan copper and gold, Kundalan copper and gold, Khanneshin carbonatite, and Dusar-Shaida copper and tin (fig. 1–26). Many of these areas have known outcropping or measured resources with favorable geometries for mining and (or) routine metallurgical parameters. These characteristics may translate into lower capital costs, short lead times, and short payback periods. Many of these AOIs may possibly contain ore deposits that are medium to world class in size. Development of a mineral deposit commonly is not direct and efficient. This may be especially true in Afghanistan. Changing metal prices, markets, and technologies contribute to stopping and starting of exploration programs. The high risk and high cost of exploration without immediate payback may cause many companies to stop exploration or to sell their data and property to other companies. These risks affect the economics of extraction in the mining areas. It is common for mining districts to open and then close after a few years and then to open again. Most mining districts may be operated throughout their lifecycles by numerous mining companies. Mining districts commonly start out as small operations and then develop, with time, into larger operations as the knowledge of the district grows, as metal prices increase, or as labor and infrastructure improve. The mineral industry and mining districts generally benefit by having two or more mining companies operating within one mining district because competition provides innovation and allows interaction of labor, supplies, capital, and infrastructure. Chapter 1. Introduction
31
Each mineral commodity may require different exploration approaches, differing mining, and different metallurgical techniques. Metal deposits, such as copper or iron, have relatively uniform and predictable exploration, mining, and metallurgical approaches, and their sales and marketing usually are conducted according to uniform world price markets. Many industrial minerals, by contrast, are used in local industries and may be produced according to standards and specifications required by the local markets. Several scales of mining activities and mineral commodity types are represented in the AOIs of mineral investment and production opportunities. These different development scales of mining have differing timeframes and different social and economic impacts. Differing size operations may be regulated differently under the Afghanistan mineral law. The smallest scale mining activity is artisanal mining, which is commonly conducted for commodities of high unit value, such as gem and precious stones and gold. These activities usually involve operations valued at less than $500,000 and may involve single family size groups or hundreds and thousands of individuals in a specific mining district. Small- to medium-scale mining might involve deposits with gross in-place values ranging from $500,000 to $9,000,000 and commonly would be financed by local or regional companies or individuals. Examples might be a 60,000 ounce gold mine, or a cement plant, or a limestone or marble quarry. These operations would have short lead times of less than 5 years. These operations generally employ hundreds of individuals and generally have an impact on goods and services in the surrounding communities. The large-scale, world class deposits would likely involve international investors, have longer lead times of greater than 5 years, have gross in-place values of over 1 billion dollars, and may contribute to decades of export and economic growth. Examples of these larger deposits are the Aynak copper-cobalt and Haji-Gak iron deposits. Other examples are the Khanneshin carbonatite, and the porphyry copper-gold prospects such as in the Kundalan and Zarkashan copper, gold AOIs. Operations resulting from the mining of these large deposits may employ several hundreds of highly trained individuals, but may directly employ thousands of individuals in the supply and service industries. A number of factors increase the risk of developing mineral opportunities in countries similar to Afghanistan. The operating environment in Afghanistan may be challenging and expensive. Many of the areas of mineral opportunity are in remote, rugged mountains that lack infrastructure, power, and a proximal trained workforce. Some of the exploration environment in Afghanistan is seasonal due to the harsh winters in the higher altitudes. Security, tribal conflicts, and local politics are also challenges that need to be overcome in order to develop mineral properties.
32
Summaries of Important Areas for Mineral Investment and Production Opportunities of Nonfuel Minerals in Afghanistan
Figure 1–26. Map showing areas of interest and specific important areas of mineral interest identified from analysis and interpretation of new data between 2009 and 2011.
Chapter 1. Introduction
33
1.11 References Cited Abdullah, S., Chmiriov, V.M., Stazhilo-Alekseev, K.F., Dronov, V.I., Kofarsky, A.K., and Malyarov, E.P., 1977, Mineral resources of Afghanistan: Republic of Afghanistan, Ministry of Mines and Industries, Afghan Geological and Mines Survey, 419 p., available at http://www.bgs.ac.uk/downloads/browse.cfm?sec=7&cat=83/. British Geological Survey, 2008, Geological archive of Afghanistan: Afghanistan Geological Survey Miscellaneous Report, 360 p. Chirico, P.G., and Moran, T.W., 2011, Topographic and hydrographic GIS dataset for 2010 Afghanistan Geological Survey and U.S. Geological Survey Minerals Project: U.S. Geological Survey Data Series 624, available only at http://pubs.usgs.gov/ds/624/. Cocks, T., Jenssen, R., Stewart, A., Wilson, I., and Shields, T., 1998, The HyMap airborne hyperspectral sensor—The system, calibration and performance, in Schaepman, M., Schlapfer, D., and Itten, K.I., eds., Proceedings of the 1st EARSeL Workshop on Imaging Spectroscopy, 6–8 October 1998, Zurich: Paris, European Association of Remote Sensing Laboratories, p. 37–43. Doebrich, J.L., and Wahl, R.R., comps., with contributions by Doebrich, J.L., Wahl, R.R., Ludington, S.D., Chirico, P.G., Wandrey, C.J., Bohannon, R.G., Orris, G.J., Bliss, J.D., Wasy, Abdul, and Younusi, M.O., 2006, Geologic and mineral resource map of Afghanistan: U.S. Geological Survey Open File Report 2006–1038, scale 1:850,000, available at http://pubs.usgs.gov/of/2006/1038/. Eppinger, R.G., and Sipeki, Julianna, 2006, Database of geoscientific references through 2006 for Afghanistan, Version 1: U.S. Geological Survey Open-File Report 2006–1370, 9 p., and database, available at http://pubs.usgs.gov/of/2006/1370/. Klett, T.R., Amirzada, Abdulla, Selab, Amir, Muty, S.A., Nakshband, H.G., Hosine, Abdul, Aminulah, Wahab, Abdul, Ulmishek, G.F., Wandrey, C J., Agena, W.F., Taylor, D.J., Hill, Ronald., Pribil, Michael, and King, J.D., 2006, Assessment of undiscovered petroleum resources of northern Afghanistan, U.S. Geological Survey Fact Sheet 2006–3031, 2 p., accessed September 1, 2006, at http://pubs.usgs.gov/fs/2006/3031/. Kokaly, R.F., King, T.V.V., and Livo, K.E., 2008, Airborne hyperspectral survey of Afghanistan 2007: Flight line planning and HyMap data collection: U.S. Geological Survey Open-File Report 2008– 1235, 14 p., accessed at http://pubs.usgs.gov/of/2008/1235/. Ludington, Steve, Orris, G.J., Bolm, K.S., Peters, S.G., and the U.S. Geological Survey-Afghanistan Ministry of Mines and Industry Joint Mineral Resource Assessment Team, 2007, Preliminary mineral resource assessment of selected mineral deposit types in Afghanistan: U.S. Geological Survey Open-File Report 2007–1005, 44 p, available at http://pubs.usgs.gov/of/2007/1005/. Mars, J.C., and Rowan, L.C., 2007, Mapping phyllic and argillic-altered rocks in southeastern Afghanistan using advanced spaceborne thermal emission and reflection radiometer (ASTER) data: U.S. Geological survey Open-File Report 2007–1006, poster format, available at http://pubs.usgs.gov/of/2007/1006/. Olson, S.A., and Williams-Sether, Tara, 2010, Streamflow characteristics at streamgages in northern Afghanistan and selected locations: U.S. Geological Survey Data Series 529, 512 p., available at http://pubs.usgs.gov/ds/529/. Peters, S.G., 2007, Preliminary assessment of non-fuel mineral resources of Afghanistan, 2007: U.S. Geological Survey Fact Sheet 2007–3063, 4 p., available at http://pubs.usgs.gov/fs/2007/3063/. Peters, S.G., Ludington, S.D., Orris, G.J., Sutphin, D.M., Bliss, J.D., and Rytuba, J.J., eds., and the U.S. Geological Survey-Afghanistan Ministry of Mines Joint Mineral Resource Assessment Team, 2007, Preliminary non-fuel mineral resource assessment of Afghanistan: U.S. Geological Survey Open-File Report 2007–1214, 810 p., 1 CD–ROM. (Also available at http://pubs.usgs.gov/of/2007/1214/.)
34
Summaries of Important Areas for Mineral Investment and Production Opportunities of Nonfuel Minerals in Afghanistan
Shenwary, G.S., Kohistany, A.H., Hussain, Sardar, Ashan, Said, Mutty, A.S., Daud, M.A., Wussow, M.W., Sweeney, R.E., Phillips, J.D., Lindsay, C.R., Kucks, R.P., Finn, C.A., Drenth, B.J., Anderson, E.D., Abraham, J.D., Liang, R.T., Jarvis, J.L., Gardner, J.M., Childers, V.A., Ball, D.C., and Brozena, J.M., 2011, Aeromagnetic surveys in Afghanistan—An updated website for distribution of data: U.S. Geological Survey Open-File Report 2011–1055, 8 p., available at http://pubs.usgs.gov/of/2011/1055/. Singer, D., and Menzie, W.D., 2010, Quantitative mineral resource assessments, an integrated approach: New York, Oxford University Press, 219 p. Sweeney, R.E., Kucks, R.P., Hill, P.L., and Finn, C.A., 2006a, Aeromagnetic and gravity surveys in Afghanistan: A web site for distribution of data: U.S. Geological Survey Open-File Report 2006– 1204, available at http://pubs.usgs.gov/of/2006/1204/. Sweeney, R.E., Kucks, R.P., Hill, P.L., and Finn, C.A., 2006b, Aeromagnetic survey in western Afghanistan: A web site for distribution of data: U.S. Geological Survey Open-File Report 2006– 1325, available at http://pubs.usgs.gov/of/2006/1325/. Sweeney, R.E., Kucks, R.P., Hill, P.L., and Finn, C.A., 2007, Radiometric survey in western Afghanistan—A website for distribution of data: U.S. Geological Survey Open-File Report 2007– 1042, available at http://pubs.usgs.gov/of/2007/1042/. United Nations Economic and Social Commission for Asia and the Pacific, 1995, Geology and mineral resources of Afghanistan: New York, United Nations, Atlas of Mineral Resources of the ESCAP Region, v. 12, 85 p. U.S. Department of Defense, 2010, Special Defense Department Briefing from the Pentagon Arlington, Virginia: U.S. Department of Defense Pentagon brief, June 14, available at http://www.defense.gov/transcripts/transcript.aspx?transcriptid=4643. U.S. Department of Defense Task Force for Business and Stability Operations, 2010, Mineral Resource Team 2010 activities summary: TFBSO, 49 p., available at http://tfbso.defense.gov/www/resources.aspx. Vining, K.C., 2010, Streamflow characteristics of streams in southeastern Afghanistan: U.S. Geological Survey Data Series 508, 104 p., available at http://pubs.usgs.gov/ds/508/. Williams-Sether, Tara, 2008, Streamflow characteristics of streams in the Helmand Basin, Afghanistan: U.S. Geological Survey Data Series 333, 341 p., available at http://pubs.usgs.gov/ds/333/.
Chapter 1. Introduction
35