rigorous and robust first-principles numerical models of such systems. ...... [8] Simon, B., and C. A. DiMarzio, âSimulation of a theta line-scanning confocal microscope,â ... [20] Haykin, S., Communication Systems, 4th ed., New York: Wiley, 2001. ..... 5th International Workshop on Automatic Processing of Fringe Patterns,.
Copyright 2013 Artech House Inc.
Chapter 14 Computational Optical Imaging Using the Finite-Difference Time-Domain Method1 Ilker R. Capoglu, Jeremy D. Rogers, Allen Taflove, and Vadim Backman
14.1 INTRODUCTION Optical imaging systems have traditionally been analyzed using well-established approximations such as ray-based geometrical optics [1] and scalar Fourier theory [2]. However, there has recently been increased interest in applying the full-vector Maxwell’s equations to implement rigorous and robust first-principles numerical models of such systems. The availability of increasingly powerful computers and computational algorithms has contributed to this interest, as well as the need for improved accuracy for key scientific and engineering applications. Although the basic principles of light scattering derived from Maxwell’s equations have been known for many decades, the application of these principles to model complete optical imaging systems had to wait until the advent of computers having sufficient speed and memory. This allows modeling objects that are comparable in size to the wavelength of the illuminating light, 400 to 800 nm in the visible range. With the arrival of these capabilities, it is possible to bypass most of the traditional simplifying approximations and proceed to calculate the optical image of an arbitrary object directly from Maxwell’s equations in three dimensions. The need for computational modeling of optical imaging is presented by a number of important scientific and engineering applications that require controlling all aspects of the imaging system down to sub-wavelength precision. Early examples involved modeling photo microlithography techniques for integrated-circuit production [3 – 6]. More recently, there has been increasing interest in modeling optical microscopy modalities [7 – 11], especially regarding optical detection of early-stage nanoscale alterations in precancerous cells [12, 13]. This chapter is primarily intended as a reference for the numerical algorithms and techniques necessary for implementing a purely virtual imaging system, which we will refer to as a “microscope in a computer.” Since the basic principles are also applicable to any other optical imaging system, the results here can also be consulted for modeling photolithography and metrology systems. For a more focused discussion of the finite-difference time-domain (FDTD) simulation of photolithography processes, see Chapter 15.
1
This chapter is adapted from Ref. [137], I. R. Capoglu, J. D. Rogers, A. Taflove, and V. Backman, “The microscope in a computer: Image synthesis from three-dimensional full-vector solutions of Maxwell’s equations at the nanometer scale,” Progress in Optics, Vol. 57, 2012, pp. 1–91, 2012 Elsevier. 307
308
Advances in FDTD Computational Electrodynamics: Photonics and Nanotechnology
In this chapter, we present a self-contained account of the numerical electromagnetic simulation of a general optical imaging system. We place special emphasis on numerical modeling issues such as discretization, sampling, and signal processing. Although most of the presentation is tailored for optics, many of the concepts and equations given in Sections 14.2 to 14.6 are applicable to a broader range of electromagnetics problems involving antennas, antenna arrays, metamaterials, and radio-frequency (RF) and microwave circuits and radars. The refocusing concept in Section 14.7, however, is a defining characteristic of an optical imaging system, with few exceptions such as focused antenna arrays in RF electromagnetics [14].
14.2 BASIC PRINCIPLES OF OPTICAL COHERENCE In most practical situations, the excitation in an optical system (whether it is a filament or a laser source) has a certain random character. This creates randomness in the resulting optical electromagnetic field in both space and time. If this is the case, the electromagnetic field can only be represented as a random field that possesses certain statistical properties. Fortunately, we are almost always concerned with time averages of optical parameters such as intensity or polarization, because these are the only parameters that most optical instruments can measure. If an adequate statistical model is constructed for the random electromagnetic field, the average quantities measured at the output of the system can be inferred mathematically. The categorization and rigorous mathematical description of these matters is the subject of optical coherence [1, 15]. Although optical illumination systems almost always have a random character, the FDTD method operates on deterministic field values that are known precisely in space and time. The question arises, therefore, as to whether it is possible to compute statistical averages belonging to infinite random processes using a completely deterministic numerical electromagnetic simulation method such as FDTD. It turns out that this is possible, provided that the physical system satisfies certain conditions. One of the simplest of such situations is when the excitation is statistically stationary in time. In its strictest form, this means that the statistical properties of the waveforms anywhere in the system do not change in time. This is a reasonable assumption for many forms of optical sources, and will be made throughout this chapter. The study of non-stationary, spectrally partially coherent sources is outside our scope. Interested readers may consult Refs. [16 – 18]. The importance of a stationary process is manifested when the response of a linear system to a stationary time waveform is sought. This is the case in our analysis, because Maxwell’s equations and the scattering materials are assumed to be linear. Let us consider an input waveform xi(t) exciting the system in some way and an output waveform xo(t) measured somewhere else in the system. If xi(t) is the only excitation, the relation between these is a convolution with the impulse response h(t) of the system: "
xo (t)!!=!! # h(! ) xi (t – ! ) d!
(14.1)
–"
The transfer function H(ω) is defined as the Fourier transform of h(t): #
H (! )!!=!! $ h(t) e" j! t dt –#
(14.2)
Chapter 14: Computational Optical Imaging Using the FDTD Method
309
It can be shown that the power spectral densities Si(ω ) and So(ω ) of the input and output waveforms, respectively, are related linearly by the absolute square of the transfer function [1, 15, 19, 20]:
So (! )!!=!! H (! ) Si (! ) 2
(14.3)
The power spectral density is an optically relevant and directly measurable quantity, defined as the power at the output of a narrowband filter centered at ω. The Wiener-Khintchine theorem [1] states that it is also the Fourier transform of the correlation function associated with the stationary waveform. Equation (14.3) is the central result that connects random waveforms in optics with the deterministic numerical methods of electromagnetics. In a given problem, the power spectral density of the source Si(ω ) is usually known; and the power spectral density of the output So(ω ) is desired. The necessary link is provided by the absolute square of the transfer function H(ω ). A numerical electromagnetics method such as FDTD can be used to find H(ω ) by sending deterministic signals through the optical system, and calculating the response. Although the majority of the results in this chapter will be given for a fixed frequency ω , the response to a broadband stationary waveform can easily be obtained by taking the temporal Fourier transform of the response to a broadband deterministic waveform.
14.3 OVERALL STRUCTURE OF THE OPTICAL IMAGING SYSTEM An optical imaging system can be decomposed into several subsystems, wherein each performs a self-contained task that is simple enough to model theoretically. Once the theoretical underpinnings of each subsystem are laid out, the numerical computation of the actual physical parameters concerning the subsystem (transmission coefficients, far-field intensities, aberrations, etc.) becomes a matter of approximating the analytical equations in a suitable manner. We represent the optical imaging system as a combination of four subsystems: illumination, scattering, collection, and refocusing. These subsystems are drawn schematically in Fig. 14.1.
Fig. 14.1 The four subcomponents of an optical imaging system: illumination, scattering, collection, and refocusing.
310
Advances in FDTD Computational Electrodynamics: Photonics and Nanotechnology
14.4 ILLUMINATION SUBSYSTEM The light source and the lens system (usually called the condenser) that focuses the light created by the source onto the object are included in this subsystem. The last lens in the condenser system is shown on the left side of Fig. 14.1, along with the wavefront incident on the object. We will base our treatment of illumination systems on whether they are spatially coherent or incoherent. Temporal coherence is a secondary concern since the sources considered here are always stationary (see Section 14.2). Once the responses to all the frequencies in the temporal spectrum of the source are found, then the synthesis of the output intensity is simply a matter of adding the intensities of the responses at each frequency. 14.4.1 Coherent Illumination Spatially coherent illumination means that the fields at all points within the illumination are fully monochromatic with fixed amplitude and phase relations. This illumination can be created by infinitesimally small sources or by the atomic process of stimulated emission, as with lasers. The simplest coherent illumination used in numerical modeling is the plane wave. Being invariant in all but one dimension, the plane wave is one of the most basic solutions to Maxwell’s equations. Here, the planes of constant phase are all perpendicular to the direction of propagation kˆinc , and the electric and magnetic field vectors are perpendicular to each other and kˆinc . Individually, the plane wave can approximate a more complicated coherent illumination scheme over a very small illumination angle [21, 22]. Full treatments of some of these illumination schemes in large- θ ill cases have also been considered in literature, albeit with less popularity. This is primarily because non-planar coherent beams are often difficult to compute and/or implement numerically. One of the most popular non-planar coherent illumination beams is the Gaussian beam [23]. Although the Gaussian beam has an approximate closed-form analytical expression that can be used in limited cases [24–26], it is often decomposed into its plane-wave components, resulting in a more accurate description than the more limited closed-form expression [27, 28]. This method has the additional advantage of permitting the use of efficient and readily-available plane-wave algorithms, such as the total-field/scattered field (TF/SF) algorithm for FDTD [29]. Although the Gaussian beam is defined at a single frequency, it can be used in conjunction with an FDTD model set up for time-harmonic operation [8, 30 – 32]. The plane-wave spectrum (or the angular-spectrum) method can also be used to synthesize arbitrary coherent-illumination beams of non-Gaussian shape. A practical example of a coherent beam derived using the angular-spectrum method is the electromagnetic field distribution around the focal region of an aplanatic lens excited by a plane wave [33, 34]. This beam has been used to simulate the coherent illumination in scanning-type confocal or differential-interference contrast (DIC) microscopes [35, 36]. An extension of this technique to time-domain focused pulses was described in [37]. This can be used either to simulate ultrafast optical pulses [38 – 42] or stationary broadband systems via temporal Fourier analysis. The latter type of systems have recently become feasible with the development of white-light laser sources [43, 44]. Illumination modeling generally becomes more difficult when the object space is multilayered. To simplify this task, the TF/SF algorithm in FDTD has been generalized to deal with multilayered spaces [45 – 47]. This technique can be used as a means to inject arbitrary coherent beams into a multilayered space, since in principle any beam can be decomposed into a plane-wave spectrum.
Chapter 14: Computational Optical Imaging Using the FDTD Method
311
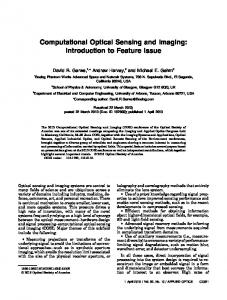
14.4.2 Incoherent Illumination The term “incoherent illumination” is traditionally used to designate a scheme that exhibits partial spatial coherence over the illumination area. Here, the light source has finite spatial extent, with every point on the source radiating in an incoherent fashion. This is an adequate model for many natural and artificial light sources such as the sun, a xenon arc lamp, or a tungsten filament. Incoherence also requires that the excitation source have a finite bandwidth, however small it may be. In fact, the converse of this requirement (strict monochromaticity) is very hard to achieve, for even the most coherent laser sources have a finite bandwidth. Perhaps the most prominent incoherent illumination scheme in use today is called Köhler illumination [1, 48], named after August Köhler who introduced it in the late 1800s. One of the key advantages of this scheme is that it provides spatially uniform illumination throughout the sample, regardless of the inhomogeneities of the light source. This is accomplished by sending a collimated beam on the sample for every infinitesimal point on the light source. Figure 14.2 illustrates the details of Köhler illumination.
Fig. 14.2 Schematic illustration of Köhler illumination.
In Fig. 14.2, the light source on the left is imaged on the aperture stop by an auxiliary lens. The image of the light source on the aperture stop acts as a secondary source for the succeeding portion of the system. Unlike the original light source, the spatial coherence length on this secondary source is not zero. In other words, the secondary source is technically a partially coherent source. Fortunately, if the aperture stop is much larger than the size of the diffraction spot (also called the Airy disc) associated with the auxiliary lens, there is little accuracy lost if every point on this secondary source is also assumed incoherent [1]. The analysis of Köhler illumination is based on this assumption. Two rays emanating from each of two mutually incoherent infinitesimal point sources L1 and L2 on the light source are shown in Fig. 14.2 by solid and dotted lines, respectively. Since the aperture stop is situated at the front focal plane of the condenser lens, every point source on the aperture stop creates a collimated beam illuminating the object from a different direction. In addition, since the secondary point sources on the aperture stop are assumed incoherent, these beams are also incoherent.
312
Advances in FDTD Computational Electrodynamics: Photonics and Nanotechnology
The flat wavefronts created by L1 and L2 are denoted by W1 and W2 in Fig. 14.2. The aperture stop limits the angles from which the incoherent beams hit the object within an illumination cone, defined by θ ill. In general, the image of the source on the aperture stop may be inhomogeneous, and therefore the beams hitting the object may have different amplitudes. If the source is of uniform intensity, these amplitudes are also uniform. The spatial extent of the illumination, on the other hand, is controlled by the field stop in Figure 14.2.
Fig. 14.3 Optimal placement of the sample for spatially uniform illumination.
As shown in Fig. 14.3, the field stop is imaged by the condenser lens at plane S at distance d from the back focal plane F. For illustration purposes, distance d in Fig. 14.3 is drawn much larger than usual. The field stop is usually at several focal lengths in front of the aperture stop, so S is usually quite close to F. It is clearly seen from Fig. 14.3 that the optimum position for the sample is at S, since any forward or backward movement of the sample will cause the elimination of some rays incident from certain directions. As the sample is moved away from focus (say, to S′ ), the illumination area gets larger and starts blurring at the edges. This undesirable effect is avoided by focusing the field stop sharply over the sample at all times. If the sample is close enough to the center of the illumination area on S, the collimated beams can be well approximated by plane waves. In numerical computations, the continuum of mutually incoherent plane waves over the illumination cone has to be approximated by a finite sum. This is, in effect, a two-dimensional numerical quadrature problem, for which unfortunately no universally optimum method exists [49]. A heuristic and straightforward method that is applicable regardless of the actual shape of the source image on the aperture stop is an equally spaced arrangement of point sources, combined with the midpoint rule [49]. The corresponding placement of the plane waves incident on the sample in Fig. 14.3 can be found from geometrical optics (see [1], Section 10.6.2). Within the accuracy of Gaussian optics (small off-axis distances, small angles around the axis), every position (µ, ν) on the aperture stop corresponds to a plane wave with direction cosines (sx, sy) = (µ / f, ν / f) at the back focal plane of the condenser, where f is the focal length of the condenser. The direction cosines are defined as:
sx !!=!!sin ! cos " !!=!!cos # !,!!!!!!!!!!sy !!=!!sin ! sin " !!=!!cos $
(14.4)
Chapter 14: Computational Optical Imaging Using the FDTD Method
313
where angles θ, φ, χ, and η are as shown in Fig. 14.4. Here, angles θ and φ are the usual zenith and azimuthal angles in a spherical coordinate system centered about the z-axis.
Fig. 14.4 Definitions of certain angles associated with plane-wave incidence.
An equal spacing of point sources on the aperture stop results in the equal spacing of the direction cosines (sx, sy) at the back focal plane of the condenser. An example of an equal-spaced arrangement of the direction cosines is shown in Fig. 14.5.
Fig. 14.5 Equal spacing of plane waves in Köhler illumination. Two orthogonal polarizations (+) and (×) are shown for each direction of incidence.
The maximum value that either sx or sy can attain is sin θ ill, where θ ill is the illumination half-angle in Fig. 14.2. We define the illumination numerical aperture as the quantity NAill = n sinθ ill, where n is the refractive index of the medium.
314
Advances in FDTD Computational Electrodynamics: Photonics and Nanotechnology
As every plane wave in Fig. 14.5 propagates to the sample plane S (at distance d from F ), it acquires a phase shift that will also be preserved in the scattered field due to the linearity of the system. If the intensities of the scattered field are of interest (as is the case in Köhler illumination), this extra phase shift will not have any effect on the output because of the mutual incoherence of the incident plane waves. One can quantify the quality of the approximation that results from the discrete arrangement of the plane waves in Fig. 14.5. Let us consider quasi-monochromatic illumination with mean wavenumber k = n k0, where k0 is the mean wavenumber in free space. Let J(x1, y1; x2, y2) denote the mutual coherence function at the sample plane (x, y), which quantifies the statistical correlation between two points with coordinates (x1, y1) and (x2, y2). As far as second-order quantities (intensity, two-point correlation, power-spectral density, etc.) are concerned, J (x1, y1; x2, y2) completely specifies the excitation. Any illumination scheme that results in the same J (x1, y1; x2, y2) will yield the same second-order quantities at the output. For the Köhler illumination scheme considered here, J (x1, y1; x2, y2) is given by [1]:
J(x1 , y1 ;!x2 , y2 )!!=!!J(xd ;!yd )!!=!! ## exp[! jk(sx xd + sy yd )]d"
(14.5)
"ill
where xd = x1 – x2 , yd = y1 – y2 , Ωill is the illumination solid angle bounded by sx2 + sy2 < sin 2! ill , and the differential solid angle dΩ is equal to dsx dsy / cosθ. Assuming moderate θill values and neglecting the cosθ term, this expression can also be written as: " "
J(xd ;!yd )!!=!! #
# P(s , s ) exp[! jk(s x x
y
x d
+ sy yd )] dsx dsy
(14.6)
!" !"
where P (sx, sy ) is equal to unity within the circle sx2 + sy2 < sin 2! ill and zero elsewhere. Let us label the discrete directions in Fig. 14.5 with indices (m, n), with the direction cosines:
sxm !=!!m !sx !,!!!!!!!!!!syn !=!!n !sy
(14.7)
The indices m and n can be assumed to run from – ∞ to ∞. The discrete plane waves should be weighed by (Δsx Δsy )1/2 (the square root of the differential area in the direction-cosine space), so that the mutual coherence function is weighted by the differential area Δsx Δsy in the directioncosine space. With these weights, the arrangement in Fig. 14.5 results in the following mutual coherence function:
J * (xd ;!yd )!!=!!!sx !sy # P(sxm , syn ) exp[" jk(sxm xd + syn yd )]
(14.8)
m,n
Appendix 14A shows that J*(xd, yd) is a sum of shifted copies of the original mutual coherence function J (xd, yd) : *
J * (xd ;!yd )!!=!! +
*
#
+ J %$ x
r=)* s=)*
d
+!r
2! k"sx
;! yd + s
2!
&
k"sy ('
(14.9)
This is called aliasing in signal processing [50]. For J*(xd, yd) to represent J (xd, yd) in a faithful manner, the shifted copies must not overlap; i.e.:
Chapter 14: Computational Optical Imaging Using the FDTD Method
!sx !
2" 2" !!,!!!!!!!!!!!sy !
315
(14.10)
where Wc is defined as the distance (xd2 + yd2 )1/2 at which J (xd, yd ) falls below a negligible value. Using (14.6), a closed-form expression can be found for J (xd, yd ), with a Wc value on the order of 1/(k sinθill) = 1/(k0 N Aill). If the sample dimension D is larger than Wc , then D must be substituted for Wc in (14.10). Otherwise, the mutual coherence function J*(xd, yd ) evaluated between two most distant points on the sample will be aliased and incorrect. A more general form of the non-aliasing condition (14.10) is therefore:
!sx !
2" 2" !!,!!!!!!!!!!!sy !
(14.11)
For a stationary broadband excitation, the largest wavenumber k (the smallest wavelength λ) present in the illumination waveform determines the nonaliasing condition (14.11). Summing the responses of the object to each plane wave in Fig. 14.5 is known as the sourcepoint or Abbe integration [51 – 53]. Since the plane waves in Fig. 14.5 are all mutually incoherent, a separate simulation should be run for each of them. The resulting image intensities (not field values) of each simulation are then added to yield the final image intensity (see Section 14.7). The treatment so far has been for a scalar field. It turns out that two orthogonal, mutually incoherent polarizations for the electric field of the plane wave can always be chosen for every direction (sx, sy), as will be seen shortly. The two polarizations for each plane wave are denoted by + and ×, and shown superposed at each (sx, sy) direction in Fig. 14.5. If polarization information is critical, these two polarizations should also be simulated separately, because they are mutually incoherent. The overall number of simulations is therefore twice the number of direction cosines in Fig. 14.5. This brute-force repetition of the entire simulation for incoherent illumination is a consequence of the deterministic nature of the FDTD method. A more efficient way to reduce this burden is a topic for future research. The determination of the two orthogonal, mutually incoherent polarization states for the plane waves in Fig. 14.5 requires knowledge of the polarization properties of the sources on the aperture stop. Here, we restrict ourselves to sources that exhibit uniform polarization properties throughout the aperture stop. Assuming quasi-monochromaticity at frequency ω and denoting the coordinates on the aperture stop as (µ, ν), we can express the uniform second-order polarization properties of the source using the cross-spectral coherency matrix J(µ, ν ; ω ) [1]:
# Eµ2 J( µ, ! ; " )!!=!! % % Eµ* E! $
Eµ E!* & ( E!2 ('
(14.12)
where Eµ, Eν are the tangential components of the electric field on the aperture stop, 〈 ... 〉 denotes temporal averages (or statistical expectation values), and exp(jω t) dependence is implicit. Since J(µ, ν ; ω ) is Hermitian, it can be represented as a weighted sum of two orthogonal coherency matrices [54, 55]:
#A J( µ, ! ; " )!! =!! % * $B
B& # C !!+!D % * C (' $ )B
)B & A ('
(14.13)
316
Advances in FDTD Computational Electrodynamics: Photonics and Nanotechnology
where A, B, C, D are complex scalars subject to A, C, D ≥ 0 and AC = | B |2. This corresponds to decomposing the partially polarized field on the aperture stop into two orthogonal, mutually incoherent, fully polarized fields. The directions of these polarization states coincide with the orthogonal eigenvectors of the coherency matrix J(µ, ν ; ω ), and their relative weights are determined by its eigenvalues. Explicit formulas for the parameters A, B, C, D can be found in [55]. A, B, C determine the angles and the ellipticity of the two polarization states at each (µ, ν ), while D determines the relative powers of these components. Once the two orthogonal, mutually incoherent polarization states are determined, they should be treated individually in separate numerical simulations. The problem is thus reduced to fully polarized excitation, in which the electric field on the aperture stop is uniformly polarized in a certain direction. Since the general case of elliptical polarization can be handled as a complex superposition of two linearly polarized states, it suffices to treat only linear polarization. A good approximation for the polarization of the resulting plane waves in the back focal plane of the condenser can be obtained using the construction in Fig. 14.6.
Fig. 14.6 Polarization of the plane wave created by the condenser at focus F due to an infinitesimal source at point A on the aperture stop.
In Fig. 14.6, an arbitrary point A on the plane of the aperture stop ( µ, ν ) is shown on the left. Let B denote the point on the lens such that AB is parallel to the optical axis OF. Let α denote the ray emanating from A, hitting the lens at B, and intersecting the optical axis at the back focal point F. The plane including the ray α and the optical axis OF is called the meridional plane; which, in our case, makes an angle φ with the µ axis. The key observation is thus: The vector electric field on the rays in the neighborhood of α, which are parallel to α around the focus F, will be almost the same as that of the ray α. Therefore, if the illuminated sample at the back focal plane at F is confined to a small area with dimensions D = f, the polarization and magnitude of the electric field on the sample at F are determined by the ray α.
Chapter 14: Computational Optical Imaging Using the FDTD Method
317
The magnitude of the electric field at F follows from the intensity law of geometrical optics. Referring to Fig. 14.6, an infinitesimal source at A creates a spherical wavefront centered around A, and launches the ray α toward B. The magnitude of the electric field E at B due to this source is proportional to | Es | / f, where the vector quantity Es is the strength factor of the ray α, which depends only on the magnitude and polarization of the source at A but not on f. If we consider an infinitesimal bundle of rays emanating from A and spread over an infinitesimal area around B, these rays are then collimated by the condenser into a parallel tube of rays intersecting the optical axis around the back focal point F. The infinitesimal area subtended by this parallel tube of rays is cosθ times the infinitesimal area subtended by the ray bundle on the other side of the condenser. From the intensity law of geometrical optics [1], it follows that the magnitude of the electric field E′ at the back focal point F is given by:
E ! !!=!!(cos " )#1/2 Es! / f
(14.14)
The polarization of E′ still remains to be found. Let ψ denote the angle that E makes with the meridional plane, as shown in Fig. 14.6. If the angles of incidence at every surface of refraction through the lens are small, the angle ψ between the electric field vector on the ray and the meridional plane stays constant [1, 34]. This fact has been previously used in similar Köhlerillumination constructions [56, 57] as well as the synthesis of a coherent converging light pulse in the FDTD method [37]. Apart from the factor (cosθ )–1/2 / f, the electric field vector E′ is then a rotation of E by an angle θ around an axis perpendicular to the meridional plane [56]. [For additional discussion of the strength factor of a ray, see (14.15) and its related text.] An important special case of incoherent Köhler-style illumination is when the two orthogonal components Eµ and Eν of the electric field on the aperture stop are of equal power and are completely uncorrelated: | Eµ |2 = | Eν |2 and 〈 Eµ Eν∗ 〉 = 〈 Eµ∗ Eν 〉 = 0. The source on the aperture stop is then said to be natural, or completely unpolarized. The cross-spectral coherency matrix J(µ, ν) in (14.12) is then proportional to the identity matrix, which amounts to D = 1 in the decomposition (14.13). This means that the A, B, C values for the decomposition in (14.13) are not constrained by anything but the coherency condition A C = | B |2. As a result, the choice of the two orthogonal polarization states + and × for each and every plane wave in Fig. 14.5 becomes completely arbitrary. Note that there are other aperture shapes besides the circular shape in Fig. 14.5 employed in practice. Depending on the geometry of the aperture, the discretization scheme for the incidence directions can be slightly modified. For example, the annular aperture, a characteristic element of phase contrast microscopy [10, 58], can be accommodated using an equal spacing of the incidence angles, rather than the direction cosines.
14.5 SCATTERING SUBSYSTEM If the scattering object has key structural details comparable in size to the wavelength of the incident light, ray-based or asymptotic methods completely fail to describe the scattering process. Some examples include biological cells, photonic crystals, and phase-shift masks in lithography. In this situation, one must seek a direct numerical solution for Maxwell’s equations. The finite-difference time-domain (FDTD) method is very popular for such applications [29, 59, 60] because of its simplicity, intuitiveness, robustness, and ease of implementation. In its most basic form, the electric and magnetic fields are updated in time using a simple
318
Advances in FDTD Computational Electrodynamics: Photonics and Nanotechnology
leapfrog updating procedure, without any matrix inversions. The FDTD method also has the advantage of yielding direct time-domain data, allowing immediate broadband analysis. In spite of its simplicity, the Cartesian FDTD grid can be overly restrictive when local mesh refinement or conformal grids are required. Furthermore, staircase approximations have to be made for modeling curved surfaces in FDTD grids. When these geometrical constraints are too stringent, one might prefer to employ triangular meshes that allow a much finer discretization of round surfaces and much easier mesh refinement. In spite of the latitude they offer in representing different geometries, irregular grids require much more effort to ensure the consistency and stability of the numerical solution algorithm. Collectively, these algorithms are referred to as finite-element (FE) methods. For a review of the FE methods, see [61, 62]. FD and FE methods share some inherent drawbacks that are a result of their very construction. Since both methods operate on field values in a finite volume, they require auxiliary techniques for handling sources that radiate in an unbounded region. Many so-called “absorbing boundary conditions” (ABCs) have been developed for truncating FD and FE solution spaces [29]. These conditions simulate the extension of the computation grid to infinity by absorbing most of the energy incident on the outer grid boundary. The most popular ABC in use today is Berenger’s “perfectly matched layer” [29, 63], which constitutes a milestone in the development of differential-equation methods. Grid dispersion and grid anisotropy are two other major problems caused by the finite size of the grid voxels and their lack of rotational symmetry. These problems can never be completely eliminated, but can be partially alleviated by choosing finer spatial steps and/or employing more rotationally symmetric discretization schemes [29]. Among the various rigorous numerical approaches for solving Maxwell’s equations, the FDTD method seems to have gained wider acceptance than others primarily because it is conceptually simpler, physically more intuitive, and easier to implement. One of the earliest applications of FDTD to numerical optical imaging is the TEMPEST software of the University of California–Berkeley, which was developed for photolithography simulation [64]. Originally designed to compute two-dimensional (2-D) mask patterns, it was later generalized to three dimensions (3-D) [65 – 67] and then further enhanced to handle extreme-ultraviolet (EUV) photolithography simulations [68 – 72]. In addition to its initial purpose of simulating the scattering response of photo masks [73, 74], TEMPEST has also been used for simulating metrology [75] and alignment systems [76, 77]. The FDTD method has also found use in modeling microscopy modalities. The earliest work on this subject began with the simulation of near-field imaging modalities such as the nearfield scanning optical microscope (NSOM) [78 – 83]. Far-field microscopy modeling was later tackled by the incorporation of ray principles and diffraction formulas from optics into the solution algorithm [7, 11, 36]. Upon suitable modification of the optical far-field data, different modalities such as differential-contrast microscopy (DIC) [35], phase-contrast microscopy [58], and confocal microscopy [8, 25] can be handled. A novel algorithm based on the extended– Nijboer–Zernike (ENZ) theory of diffraction (see Section 14.7.3) was coupled with FDTD for photo mask imaging [53, 84] and the imaging of general 3-D objects [85]. A variant of the FDTD method, called the pseudospectral time-domain (PSTD) method [86], is particularly suited to the analysis of scattering from optically large structures, such as macroscopic biological tissue [87]. Recent advances and applications of PSTD are discussed in Chapters 1 and 16. This chapter focuses primarily on the FDTD solution of the optical imaging problem. However, it is the trade-off between accuracy requirements and resource constraints that determines the specific numerical method best suited to a problem. For guidance, one can consult studies that compare the attributes of a variety of numerical methods [6, 88 – 91].
Chapter 14: Computational Optical Imaging Using the FDTD Method
319
14.6 COLLECTION SUBSYSTEM After the scattering from the sample is calculated, the scattered field should be propagated to the image plane to complete the imaging process. These two steps are commonly performed by an objective. As shown diagrammatically in Fig. 14.1, the first task of the objective is to collect the portion of the light scattered from the sample that falls within its entrance pupil. The entrance pupil is defined as the image of the limiting aperture stop as seen from the object side. Among all the aperture stops in the system, the one that limits the angular extent of the rays emanating from the object is the limiting aperture [1]. In general, the entrance pupil can be located at any finite distance from the sample. However, it is more advantageous to place the entrance pupil at infinity whenever possible. Such a system is referred to as object-side telecentric [1]. In a telecentric system, the size of the blurred image does not change as the object moves out of focus. This is a very desirable feature in both microscopy and photolithography. In the former, telecentricity makes it easier to manually focus on a sample, because the image size does not change with defocus. In the latter, telecentricity is much more crucial, for it ensures that the image of the photomask is much less sensitive to positioning tolerances (see Chapter 15). In addition to its advantages, telecentricity poses its own difficulties. First of all, it should be remembered that the limiting aperture stop should be located at the back focal plane of the optical system preceding it. If the lateral dimension of a certain lens in the optical setup is not large enough, that lens could act as the limiting aperture and destroy telecentricity. For this reason, telecentricity usually requires that the lenses have much larger lateral dimensions than the sample, resulting in more expensive equipment. This is usually not a big issue for microscopes. However, telecentricity places a more stringent constraint on photolithography projection lenses in terms of both price and performance. Almost all modern microscopes and photolithography projection lenses are telecentric on the object side. We will assume object-side telecentricity in the following analysis.
Fig. 14.7 The collection geometry for a telecentric system.
The collection geometry for an object-side telecentric system is shown in Fig. 14.7. Since the entrance pupil is at infinity, the scattering object can be regarded as a point at O, and the scattered wavefront Ws is spherical. Conventional spherical coordinates (r, θ, φ ) are defined with respect to O and the z-axis chosen to coincide with the optical axis. The far zone (also called the
320
Advances in FDTD Computational Electrodynamics: Photonics and Nanotechnology
Fraunhofer or radiation zone) is defined as the region r >> d2 / λ where d is the maximum dimension of the sample and λ is the wavelength. In the far zone, the radial dependence of the field can be factored out, and the wavefront Ws is completely specified by its angular profile [92, 93]: e# jkr (14.15) Es (r, !, " )!!=!! Es (!, " ) r Here, k = n k0 is the wavenumber in the homogeneous space located between the object and the entrance pupil, and n is the refractive index of the same space. The vector quantity Es (!, " ) in (14.15) is called the strength factor of the ray associated with the far-zone direction (θ, φ ) [34, 94]. The collection step therefore reduces to numerically calculating Es (!, " ) at various observation directions. Depending on the scattering geometry, this may be accomplished in several different ways. One common property of almost all numerical collection methods is that the near-field information is used to obtain the far-zone field using certain theorems of electromagnetics. The term near-field-to-far-field transform (NFFFT) is commonly used for such an algorithm that computes the far-field from the near-field. All NFFFT algorithms rely on either spatial Fourier analysis or a Green’s function formalism. We will examine these two cases separately. 14.6.1 Fourier Analysis Transformation Along an Infinite Planar Surface in the Near Field In certain cases, the strength factor Es (!, " ) can be found using the spatial Fourier transform of the near fields around the scatterer. This near field should be given on an infinite planar surface S between the scatterer and the entrance pupil, as shown in Fig. 14.8.
Fig. 14.8 Collection geometry for a Fourier-analysis-based near-field-to-far-field transform. The near fields should be given on an infinite planar surface S between the scatterer and the entrance pupil.
Chapter 14: Computational Optical Imaging Using the FDTD Method
321
Referring to Fig. 14.8, we define the origin O on S, and denote the vector electric field on this plane as E(x, y). The far-zone field E(r, θ, φ ) on the wavefront Ws at the entrance pupil can be found by expanding E(x, y) into its plane-wave (or angular) spectrum, and propagating it to very large r using the steepest-descent method [23]. Let us define the plane-wave spectrum of the 2-D electric-field distribution E(x, y) as the following Fourier transform operation: " "
! x , ky )!!=!! E(k #
# E(x, y) exp[ j(k x + k y)] dx dy x
(14.16)
y
!" !"
with the inverse transform (or the plane-wave representation) given by:
E(x, y)!!=!!
1 (2! )2
# #
! , k ) exp[" j(k x + k y)] dk $ $ E(k x
y
x
y
x
dky
(14.17)
"# "#
It is understood in (14.16) and (14.17) that the Fourier transform is applied to the Cartesian components of the vector integrands separately. The representation (14.17) for the vector field E(x, y) is an infinite summation of plane waves (propagating and evanescent) whose lateral propagation coefficients are (kx, ky). This plane-wave representation can be used to extrapolate the electric field to the region above the plane S, i.e., z > 0. The following field satisfies (14.17) at z = 0 and Maxwell’s equations in the region z > 0:
E(x, y, z)!!=!!
1 (2! )2
# #
! , k ) exp[" j(k x + k y + k z)] dk $ $ E(k x
y
x
y
z
x
dky
(14.18)
"# "#
where kz = (k2 – kx2 – ky2)1/2 [23]. Here, k is the wavenumber ω / c in the homogeneous space between S and the entrance pupil. Only the plane-wave components in (14.17) with kx2 + ky2 < k2 contribute to the far field because a complex kz represents an evanescent plane wave decaying exponentially in z. Now, propagating the plane waves with kx2 + ky2 < k2 into the space z > 0 and using the steepest-descent method at the far zone, one arrives at the following expression for the strength factor Es (!, " ) [23]:
Es (! , " )!!=!!E! (! , " )!ˆ! + E" (! , " )"ˆ
(14.19)
where the θ and φ components are given by:
E! (! , " )!!=!! E! (" , ! )!!=!!
jk 2#
jk
&' E! x ($ , % )cos " + E! y ($ , % )sin " ()
(14.20)
cos " '( $ E! x (% , & )sin ! + E! y (% , & )cos ! )*
(14.21)
2#
in which E! x (kx , ky ) and E! y (kx , ky ) are the x and y components of the plane-wave spectrum ! x , ky ) in (14.16), and the definition: E(k
(! , " )!!=!!(k cos # sin $ , k sin # sin $ )
(14.22)
322
Advances in FDTD Computational Electrodynamics: Photonics and Nanotechnology
has been introduced for brevity. This expression can be put into a more compact vectorial form. Applying the zero-divergence condition of the electric field in ! charge-free space to (14.18) ! x , ky ) is transverse to the propagation vector k !=!k xˆ + k yˆ + k zˆ . It follows reveals that E(k x y z ! !, " ) only possesses θ and φ components. Expanding E! x and E! y in (14.20) that the vector E( and (14.21) in terms of E!! and E! ! , it is found that:
Es (! , " )!!=!!
j k cos ! 2#
! $, %) E(
(14.23)
Expressions (14.19) – (14.23) can be used for certain scattering geometries to calculate the strength factor Es (!, " ) numerically. The simplest such geometry results when the sample is a phase object, represented by a complex transmittance T(x, y). This assumption is appropriate for photolithography when dealing with thin masks [95]. If the object is not sufficiently thin, the complex transmittance model can be improved by calculating the response of the object to a normally incident plane wave by some rigorous method, and then obtaining the responses to other wave incidences perturbatively from this result. However, this approach is viable only if the illumination and collection NAs are very small [96]. Such an assumption is often valid in photolithography, but not microscopy [97] (see Fig. 14.12 later in this chapter). When neither the thin-film assumption nor the perturbation assumption is valid, the scattered electric field ! , k ) should be calculated using a rigorous E(x, y) on plane S and its plane-wave spectrum E(k x y numerical method such as FDTD. Application of Periodic Boundary Conditions A key difficulty in using the Fourier-analysis-based near-field-to-far-field transform in the context of FDTD is that the computational grid is always bounded in space. Since Fourier analysis requires that the near field be given on an infinite planar surface, the range of FDTD applications suitable for Fourier-based collection algorithms is limited. However, a significant category of FDTD-modeled problems amenable to the Fourieranalysis-based near-field-to-far-field transform includes those scatterers that can be treated using periodic boundary conditions. In such problems, both the simulation geometry and the incident wave are constrained to be periodic along a certain direction or two orthogonal directions. The electromagnetic field on an infinite lateral plane (parallel to the direction of periodicity) is therefore determined completely by the electromagnetic field in the finite grid. This allows the use of Fourier analysis for the collection of the far-zone field. For a good review on periodic boundary conditions in FDTD, the reader could consult [29]. A more recent method for enforcing periodic boundary conditions in FDTD can be found in [98]. It is sufficient to consider the simpler 2-D case in order to illustrate the concept of periodicity. Let us consider a structure that is invariant in the y-direction and periodic with spatial period d in the x-direction. Let a monochromatic unit-amplitude transverse-electric (TE) plane wave be incident from angle θi with respect to the z-axis, with y component:
Eyi (x, z)!!=!!exp[! jk(" x x ! " z z)]
(14.24)
in which γ x = sinθi and γ z = cosθi. The periodicity of the structure requires that the electromagnetic field obey the following pseudo-periodicity condition everywhere:
Chapter 14: Computational Optical Imaging Using the FDTD Method
Ey (x + d, z)!!=!!Ey (x, z) exp(! jk" x d )
323
(14.25)
The linear phase term exp (–j k γ x d) is enforced by the incident plane wave, and becomes unity for normal incidence. From Floquet’s theorem [99], the scattered electric field on S (see Fig. 14.8) for TE illumination can be written in the following series form: #
Ey (x )!!=!! $ Rp exp(! j " p x)
(14.26)
p = !#
where βp = k sin θ i – p (2 π / d) are the equally spaced Floquet wavenumbers and Rp (p = – ∞ … ∞) are the reflection coefficients for the p th Floquet mode with lateral wavenumber βp. Comparing (14.26) with (14.17), we see that the reflection coefficients Rp play the role of the plane-wave ! x, ky ) , and the Floquet wavenumbers βp play the role of kx. spectral coefficients E(k ! , k ) because of the One difference here is that Rp is a finite set of numbers unlike E(k x y periodicity of the structure. Another difference is that Rp is defined for a 2-D geometry that is invariant in y. If the scattering structure is periodic in both x and y with periods dx and dy, the scattered field can likewise be expressed as a doubly infinite sum of vector-valued Floquet modes Rpq [100]: #
E(x, y)!!=!! $
#
$R
p = !# q= !#
exp[! j (" p x + "q y)]
pq
(14.27)
where now the Floquet wavenumbers:
! p !!=!!k cos "i sin # i !$! p(2% / d x )
(14.28a)
! q !!=!!k sin "i sin # i !$!q (2% / d y )
(14.28b)
play the roles of kx and ky, respectively. Here, φi and θi are the spherical incidence angles of the incident plane wave. Comparing this expression with (14.17), the plane-wave spectrum ! , k ) can be written in terms of Rpq as follows: E(k x y
! x , ky )!!=!!(2! )2 E(k
%
%
& &R
p = #% q= #%
pq
" (kx # $ p ) " (ky # $ q )
(14.29)
where δ (⋅) is the Dirac delta function. Substituting this expression in (14.23), the strength factor Es (!, " ) is obtained as: (
Es (!, " )!!=!!( jk2# cos ! ) )
(
)R
p = &( q= &(
pq
$ (% & ' p ) $ (' & ' q )
(14.30)
Carrying the term cosθ = [1 – (α / k)2 – (β / k)2]1/2 inside the summation and using the properties of the Dirac delta function, this can be written as: (
Es (!, " )!!=!!( jk2# ) )
(
)c
p = &( q= &(
pq
in which cpq is the dimensionless cosine parameter:
Rpq $ (% & ' p ) $ (' & ' q )
(14.31)
324
Advances in FDTD Computational Electrodynamics: Photonics and Nanotechnology
c pq !!=!! 1!!!( " p / k)2 !!( " q / k)2
(14.32)
We see that the far-zone field is nonzero only at a discrete set of directions. This is a direct result of the periodicity of the system and the discreteness of the Floquet wavenumbers βp, βq. Second, the finite range of the variables α = k cosφ sinθ, β = k sin φ sin θ between 0 and k sinθ obj (where sin θ obj is the collection NA in Fig. 14.8) only allows for a finite number of observation directions to be collected by the objective. It is easy to see that any Floquet mode Rpq with p index higher than a maximum value pmax will not be collected by the objective, where
pmax !!=!!
d sin! obj
(14.33)
"
The same concept applies to the q index. For the best reconstruction of the scattered field at the image plane, pmax should be maximized. This can be accomplished by reducing the wavelength, λ , or increasing the collection NA, sin θ obj. On the other extreme, if pmax is less than 1, only the homogeneous zeroth-order mode (p = 0) propagates to the objective, resulting in a uniform image (see Section 14.7.2, specifically Fig. 14.14). Let us assume that, using FDTD in conjunction with some periodic boundary conditions, the vector field E(x, y) scattered from a 3-D object has been computed on plane S of Fig. 14.8 at equally spaced spatial points mΔx and nΔy. This results in the discrete array E[m, n]:
E[m, n]!!=!! E(m!x, n!y) ,!!!!!!m = 0,..., M " 1!;!!!!n = 0,..., N " 1
(14.34)
Here, the entire periods in both x and y are covered by the sampling:
M !x!=!d x ,!!!!!!!!!!N !y!=!d y
(14.35)
We now describe how the vector amplitudes of the Floquet modes in (14.27) for this case can be obtained by using the 2-D discrete Fourier transform (DFT). Expressing the results in terms of a DFT is always advantageous, since there exists a very efficient algorithm for the evaluation of the DFT called the fast Fourier transform (FFT). We first define the phase-shifted sampled array E[m, n] as follows:
) # E[m, n]!!=!! E[m, n] exp + jksin ! i % dx cos " i $ *
m ! M
+ dy sin " i
n &, ( N ' .-
(14.36)
The above phase shift depends on the direction of incidence (θi, φ i) of the impinging plane wave. This shift removes the phase condition (14.25) imposed by the incident plane wave, and simplifies the resulting expression considerably. The 2-D DFT of this modified array is conventionally defined as [50, 101]: M !1 N !1
! p, q]!!=!! E[ "
*
" E[m, n] exp ,+! j 2# $&% M
m=0 n=0
pm
+
qn ' N
)( / .
(14.37)
! p, q] is related to the Floquet modes It can be shown (see Appendix 14B) that the DFT array E[ Rpq as follows:
Chapter 14: Computational Optical Imaging Using the FDTD Method
! p, q]!!=!!MN E[
"
325
"
##R
p+rM, q+sN
(14.38)
r=!" s=!"
Equation (14.38) expresses the results of the 2-D DFT operation on the phase-shifted sampled field array E[m, n] in terms of the Floquet modes Rpq of the original, continuous field E(x, y). From (14.38), we can immediately draw some key conclusions. First, the DFT array ! p, q] is seen to be equal to an infinite summation of shifted copies of R in both the p and q E[ pq ! p, q] is an aliased version of R . In order for E[ ! p, q] to faithfully indices. In other words, E[ pq represent Rpq, the shifted copies of Rpq should not overlap. This requires that the shifting periods M and N be larger than the effective widths Wp and Wq of Rpq in the p and q indices:
M !>!W p ,!!!!!!!!N !>!Wq
(14.39)
which, using (14.35), can also be written in terms of the sampling periods as:
!x!
(14.40)
If M or N is too small, shifted copies of Rpq overlap, and Rpq cannot be recovered fully from ! p, q] . If both M and N are large enough so that neighboring replicas of R do not overlap, E[ pq ! p, q] using the relationship (14.38): then Rpq can be recovered from E[
Rpq !!=!!
1 ! E[ p, q] MN
(14.41)
for a range of p, q values around p = q = 0. Some simple estimates of the effective widths Wp and Wq of Rpq can be made in certain circumstances. For example, if the plane S is far enough above the periodic structure, the evanescent Floquet modes in (14.27) become negligible, and it is only necessary to consider the propagating modes. Using the propagation conditions | βp | < k and | βq | < k, the following expressions are obtained for Wp and Wq:
Wp !=!2dx / ! ,!!!!!!!!Wq !=!2d y / !
(14.42)
Substituting these expressions into (14.40), we obtain:
!x!
(14.43)
This is, in effect, a discrete version of the celebrated Nyquist sampling theorem for bandlimited signals [50]. It states that, if only propagating modes are present on the plane S, the spatial sampling periods need only be smaller than one-half wavelength. Fourier-analysis-based NFFFTs have the advantage of not requiring separate treatments for multilayered media. This is because the sampling plane S lies above the scattering structure and any of its stratifications. However, these NFFFTs have a key limitation in that the field must be known on a laterally infinite plane S. As discussed above, this is a surmountable problem if the scattering structure is periodic in space. In addition, a Fourier-analysis-based NFFFT might still be feasible even for nonperiodic structures if both the scattered field and reflections of the incident field from the interfaces are bounded in space. Then, the collection surface S can, in principle, be made large enough to cover them. Nevertheless, the preferred method for nonperiodic structures remains the Green’s function formalism explained in the next subsection.
326
Advances in FDTD Computational Electrodynamics: Photonics and Nanotechnology
14.6.2 Green’s Function Formalism If the scattering medium is not periodic, the Fourier-analysis-based NFFFT approaches of the previous subsection have limited use. The preferred method for a nonperiodic scatterer is usually based on a Green’s function formalism, which has the geometry illustrated in Fig. 14.9.
(a)
(b) Fig. 14.9 Pictorial description of the Green’s function near-field-to-far-field transformation (NFFFT). (a) Geometry of the NFFFT, wherein a scattering (or radiating) structure A is located within the closed virtual surface S. (b) Equivalent surface electric and magnetic currents on S, with the interior of S removed, which produces the same far field as that originally generated by structure A.
In Fig. 14.9, structure A is located within a closed virtual surface S, which we shall designate as the NFFFT surface. We assume that the electric and magnetic near fields scattered (or radiated) by structure A at the location of S are known by virtue of having applied a rigorous solution of Maxwell’s equations. We first convert these fields to equivalent electric currents Jt and magnetic currents Mt flowing on surface S, as follows:
Jt !=! nˆ ! H!,!!!!!!!!!! Mt !=! " nˆ ! E
(14.44)
where nˆ is the outward normal unit vector on S shown in Fig. 14.9(a). Note that these crossproduct operations select only the tangential components of the electric and magnetic near fields on S for further processing.
Chapter 14: Computational Optical Imaging Using the FDTD Method
327
The most prominent method for obtaining the scattered or radiated far-field in terms of Jt and Mt of (14.44) is a vector-potential formulation using the surface equivalence theorem [92, 102, 103]. Because the derivation of this theorem is quite lengthy, it will not be reproduced here [29]. However, the result of the theorem is very simple, as illustrated in Fig. 14.9(b). Namely, Jt and Mt radiating in free space, with the interior of S removed, produce the same far fields as those originally generated by structure A. (The removal of structure A is justified because Jt and Mt are defined to create a null field inside S.) Now, the fields radiated by Jt and Mt can be found using a variety of methods. In the formulation discussed here, these currents are first inserted into certain integrals that yield intermediate quantities called the vector potentials. Among several slightly different conventions for their definitions, we will follow that of Balanis [103]. Assuming sinusoidal steady-state oscillations of the electric and magnetic fields of angular frequency ω with the corresponding wavenumber k, the vector potentials are obtained from Jt and Mt as:
µ0 4!
!0 4"
A(r)!!=!!
F(r)!!=!!
$$
Jt ( r " )
e# jk r# r " dr " r # r"
(14.45)
%%
Mt ( r # )
e$ jk r$ r # dr # r $ r#
(14.46)
S
S
in which A(r) and F(r) are called, respectively, the electric and magnetic vector potentials. The primed coordinates r ′ represent the source points on S, while the unprimed coordinates r represent observation points outside of S. The electric and magnetic fields at the observation point r are obtained from the following differentiation operations on the vector potentials:
1 1 E(r)!!=!!! j" %' A!+! 2 #(# $ A) (* ! !! # , F +0 & ) k
(14.47)
1 1 H(r)!!=!!! j" %' F!+! 2 #(# $ F) (* ! +! # + A µ0 & ) k
(14.48)
In the near field outside of S, the evaluation of (14.45) – (14.48) can be complicated. However, considerable simplification occurs when the observation point r approaches infinity (| r | = r → ∞). In this far zone, the | r – r ′ | term in the exponentials in (14.45) and (14.46) can be approximated as (r ! rˆ " r # ), where rˆ = r / r = (cos ! sin" , sin ! sin" , cos " ) is the unit vector in the direction of observation. In the denominators, the | r – r ′ | term can be approximated as simply r. This results in the following far-zone expressions for the vector potentials:
A(r)!!=!! µ0
e! jkr Jt ( r # )e jk rˆ$r #dr # 4" r %%S
(14.49)
F(r)!!=!! ! 0
e" jkr Mt ( r $ )e jk rˆ%r $dr $ 4# r &&S
(14.50)
328
Advances in FDTD Computational Electrodynamics: Photonics and Nanotechnology
As a result of the far-zone approximation, the r-dependence in (14.49) and (14.50) is completely factored out, and the surface integrals only depend on the observation angles θ, φ. The differentiation relations (14.47) and (14.48) also assume simpler forms for large r if the terms that decay faster than 1/r are neglected. Expanding the ∇ operator in the spherical coordinates (r, θ, φ ) and neglecting 1/r 2 and higher-order terms, (14.47) and (14.48) simplify to:
Er !=!0
(14.51a)
E! ! = !" j # ( A! + $0 F% )
(14.51b)
E! ! = !" j # ( A! " $0 F% )
(14.51c)
H r !=!0
(14.52a)
j" ( A % #0 F! ) #0 $
(14.52b)
and
H ! != !
H ! != ! "
j# ( A + $0 F! ) $0 %
(14.52c)
where η 0 = ( µ0 / ε 0 )1/2 is the wave impedance of free space. The far-zone electric and magnetic fields are transverse (rˆ ! E!=!0,!!! rˆ ! H!=!0) and orthogonal to each other (!0 H!=! rˆ " E) . Within the context of finite numerical methods, the term “near-field-to-far-field transform” is usually reserved for the implementation of (14.49) – (14.52). The frequency-domain NFFFT described above was first incorporated into the FDTD method by Umashankar and Taflove [104, 105]. A time-domain version of the vector-potential NFFFT in 3-D was developed later [106, 107]. For a good review of these methods, see [29]. Near-field-to-far-field transforms based on the Green’s function formalism pose a difficulty when structure A in Fig. 14.9(a) is located in the vicinity of a planar multilayered medium. In this case, the equivalent surface currents Jt , Mt in Fig. 14.9(b) do not radiate in free space; therefore the free-space Green’s function G(r) = exp(–j k r) / 4 π r cannot be used. Instead, the appropriate Green’s functions associated with the multilayered medium should be used in (14.45) and (14.46). In the near field, obtaining exact expressions for these Green’s functions can be a very complicated task [108, 109]. In the far zone, however, closed-form analytical expressions of these Green’s functions can be found. Frequency-domain NFFFT algorithms for the FDTD analysis of two-layered media were introduced in [110] and [111]. A direct timedomain FDTD NFFFT was developed later for a three-layered medium [112, 113]. Spatial Fourier transform methods have also been used to obtain the far-zone field in FDTD [84, 85]. The transmission-line formulation used in [112, 113] and the spatial Fourier transform method operate on the same basic principles. In imaging applications, the far fields of (14.51) and (14.52) have to be calculated at multiple observation directions (θ, φ ) in order to construct the final image. The choice of these observation directions is more obvious in the Fourier-based NFFFT of the previous subsection.
Chapter 14: Computational Optical Imaging Using the FDTD Method
329
If the scattering is calculated using a modal method, the Floquet modes Rpq in (14.27) contain all the necessary information regarding the far-zone scattered field. For a finite method such as FDTD applied to a periodic structure, the 2-D discrete Fourier transform operation of the phaseshifted sampled field E[m, n] in (14.36) was shown to contain sufficient information regarding the far-zone scattered field, provided the sampling is fine enough to satisfy (14.40) or (14.43). In a Green’s function–based NFFFT, however, the choice of the observation directions is not immediately obvious. It is evident that a discrete arrangement of observation directions (similar to that of the incoherent plane waves constituting Köhler illumination in Fig. 14.5) is needed. Two different arrangements of observation directions are shown in Fig. 14.10.
(a)
(b)
Fig. 14.10 Two types of discrete arrangements for far-zone observation directions in numerical imaging applications: (a) Equal spacing of the direction cosines (sx , sy ) = (cosφ sinθ, sinφ sinθ); (b) polar representation (sx , sy) = (ρ cosφ, ρ sin φ), followed by Gaussian quadrature in –sinθobj < ρ < sin θobj and equal spacing of –π / 2 < φ < π / 2.
In Figure 14.10(a), the direction cosines (sx, sy ) = (cosφ sinθ, sinφ sin θ ) are equally spaced, resulting in a Cartesian distribution of observation directions in the (sx, sy ) space. The loss of rotational symmetry in φ can be mitigated by increasing the number of points. Alternatively, a rotationally symmetric arrangement can be obtained by parameterizing the region inside the circle s = (sx2 + sy2)1/2 < sinθobj by the polar coordinates (ρ, φ ), such that:
sx !=! ! cos " ,!!!!!!!!!sy !=! ! sin "
(14.53)
! sin " obj !
2
(14.60)
in which r and r ′ are arbitrary distances from O and O ′, respectively. (Note that the light intensity is a direct measure of the signal collected by recording media such as photoresists and CCD cameras.) The infinitesimal areas on the spherical wavefronts intersected by the tubes of rays are:
dS1 !=!r 2 sin ! d! d" ,!!!!!!!!!!dS2 !=!(r # )2 sin ! # d! # d" #
(14.61)
Assuming that the absorptive, reflective, and refractive losses in the collection refocusing system are negligible, conservation of energy dictates that the total powers crossing dS1 and dS2 be equal. Since the total power crossing an infinitesimal area dS equals intensity × dS, this is equivalent to the intensity law of geometrical optics:
I1 dS1 ! =! I 2 dS2
(14.62)
We therefore have
Es! !!=!! Es
n sin " d" d# n ! sin " !d" !d# !
(14.63)
From the Abbe sine condition, n sin θ = M (n ′sinθ ′). Using the chain rule, one can write:
d! cos ! " d(sin ! ) n " cos ! " !!=!! !!=!!M d! " cos ! d(sin ! " ) n cos !
(14.64)
Also noting that dφ ′ = d φ, (14.63) becomes:
Es! !!=!!M
n ! cos " ! Es n cos "
(14.65)
If Es (!, " ) and Es! (" !, # ! ) are expressed in spherical coordinates centered around O and O ′, respectively, a quick inspection of Fig. 14.11 reveals that the "ˆ ! and "ˆ ! components of Es! (" !, # ! ) are given by:
Es!(" !, # ! )$ "ˆ !!!=!!%M
n ! cos " ! Es (" , # ) $ "ˆ n cos "
(14.66a)
Es!(" !, # ! ) $ #ˆ !!!=!!%M
n ! cos " ! Es (" , # ) $ #ˆ n cos "
(14.66b)
Now, both the directions and the strength factors of the rays leaving the exit pupil are determined, and we are ready to construct the field at the image plane. The final step of the
Chapter 14: Computational Optical Imaging Using the FDTD Method
335
imaging process requires a connection between the geometrical optics field determined by the rays at the exit pupil and the electromagnetic field at the image plane z ′ = 0. This can be achieved by use of vectorial diffraction theory [33, 36, 94]. The vector field at the image plane is given by the Debye–Wolf integral:
Eimg ( x !, y ! )!!=!!
j k! 2"
$$
#img
Es!( sx!, sy! ) exp[ % j k !( sx! x ! + sy! y ! )] d#
(14.67)
where k ′ = n ′ k0 is the wavenumber in the image space. A change of variables is made from the angle variables ( θ ′, φ ′) to the direction cosine variables ( sx!, sy! ) :
( sx!, sy! )!!=!!(cos " ! sin # !, sin " ! sin # ! )
(14.68)
In (14.67), Ωimg is the solid angle bounded by θ img, and d!!=!dsx" dsy" / sz" !=!dsx" dsy" / cos # ". It is straightforward to show that the Debye–Wolf integral in (14.67) is the “inverse” of the vectorial far-field expression (14.23) [33]. The Debye–Wolf integral in (14.67) can also be regarded as an infinite summation of plane waves incident from a spectrum of directions (θ ′, φ ′). For this reason, it is also called the angular spectrum or the plane-wave representation of the image field. The range of validity of the Debye–Wolf integral (14.67) warrants some discussion. If the exit pupil is at infinity, then the refocusing system is image-side telecentric, and (14.67) strictly applies [118]. However, if a certain geometrical condition is satisfied, (14.67) is also applicable for an exit pupil at a finite position.
Fig. 14.13 Geometrical parameters used in the definition of the Fresnel number N F.
Referring to Fig. 14.13, consider a spherical wavefront Wf passing through the center C of the exit pupil and converging toward the focal point O ′ at a distance d from the pupil. Let the radius of the exit pupil be a and the maximum distance between Wf and the exit pupil be denoted
336
Advances in FDTD Computational Electrodynamics: Photonics and Nanotechnology
by Δ max. To a good approximation, Δ max is equal to a2/2d. The Fresnel number NF is a dimensionless quantity defined as Δ max divided by one-half of the wavelength λ ′ in the image space: ! a2 (14.69) N F !!=!! max !!$!! # " /2 # "d The Fresnel number is approximately equal to the number of Fresnel zones that fill the aperture when viewed from the focal point O ′ [1]. It can be shown [119, 120] that the required condition for the validity of the Debye–Wolf integral (14.67) is that the Fresnel number be very large:
N F !>>!1
(14.70)
For visible-range optical imaging systems employed in microscopy, photolithography, metrology, inspection, and alignment, the exit-pupil radius a is on the order of centimeters, so a /λ ′ is on the order of 104. The ratio a /d of the exit pupil radius to the pupil distance is equal to tanθ img, which may range from 10–2 to infinity, depending on the magnification M. Therefore, it can safely be assumed that the Debye–Wolf integral (14.67) is a very accurate representation of the electromagnetic field in the image space for a wide range of optical systems. If the image space is homogeneous, the Debye–Wolf integral in (14.67) gives the final result for the image field. If there is a nontrivial scattering topography in the image space such as a CCD or a photoresist, the integral (14.67) for the image field should be considered only as an incident field. Since plane-wave incidence is usually the easiest illumination scheme to consider, the angular-spectrum interpretation of the Debye–Wolf integral becomes quite useful in many cases. The incident field (14.67) is a coherent illumination beam (see Section 14.4.1) that can be written as the sum of plane-wave components:
dEimg ( x !, y ! )!!=!!
j k! E! (s! , 2" s x
sy! ) exp[# j k !( sx! x ! + sy! y ! )] d$
(14.71)
If the image space is simply a stack of laterally infinite planar layers, each plane wave (14.71) can be propagated into this medium using standard Fresnel refraction formulas [117, 121 – 125]. For more complex topographies, the FDTD method can be used to obtain the field distribution in the image space [126]. The Debye–Wolf integral (14.67) can be generalized to include the aberrations of the collection refocusing optics by the inclusion of an additional phase factor in the exponential kernel of the integral:
Eimg ( x !, y ! )!!=!!
jk! 2"
$$
#img
Es!( sx!, sy! ) exp {% j k ! [ sx! x ! + sy! y ! + &( sx!, sy! )] } d#
(14.72)
where the aberration function !( sx", sy" ) is a measure of the deviation of the wavefront from a perfect spherical shape [33]. Regarding the aberration function as a small perturbation, the validity condition (14.70) can still be assumed to hold for (14.72). If the image space is homogeneous, the generalized Debye–Wolf integral (14.72) gives the final field distribution. We next discuss the numerical evaluation of (14.72) for a homogeneous image space, regarding the original equation (14.67) as a special case. The cases of periodic and nonperiodic scatterers will be considered separately.
Chapter 14: Computational Optical Imaging Using the FDTD Method
337
14.7.2 Periodic Scatterers We assume that, at the end of the collection step, the strength factor Es(θ, φ ) at the far zone has been found in the form of (14.31). Substituting the definitions of α, β in (14.22) and β p, β q in (14.28), the strength factor in (14.31) becomes:
Es (sx, sy )! =! jk2! $ p $ q c pq Rpq " (ksx # ksx i + p 2! / dx ) " (ksy # ksy i + q2! /d y )
(14.73)
where k is the wavenumber in the object space. A change of variables is made from the angle variables (θ, φ ) to the direction cosines (sx , sy ) at the entrance pupil:
(sx , sy )!!=!!(! / k, " / k) !!=!!(cos # sin $ , sin # sin $ )
(14.74)
and the direction cosines of the incident plane wave in the object space are defined as:
(sx i , sy i )!!=!!(cos !i sin " i , sin !i sin " i )
(14.75)
The Abbe sine condition states that the direction cosines ( sx!, sy! ) of a ray at the exit pupil are 1/M ′ times the direction cosines (sx , sy ) of the same ray at the entrance pupil, where M ′ is given by (14.57). Substituting (14.73) with (sx , sy )!=!( M !sx! , M !sy! ) into (14.66) and using the scaling property δ (a x) = δ (x) / | a | of the Dirac delta function, we obtain the strength factor at the exit pupil:
Es! ( sx!, sy! )!!= !
&((n !cpq cpq ! / n)1/2 Rpq ! # [ sx! $ sx!i + p 2" / ( M ! kd x ) ] % *( ' + p q M ! k! )( # [ sy! $ sy!i + q 2" / ( M ! kd y ) ] ,( j 2"
(14.76)
where
( sx!i , sy!i )!!=!!(cos "i sin # i / M !, sin "i sin # i / M ! )
(14.77)
and the cosine parameters cpq ! are defined the same way as in (14.32), with (β p, β q) replaced by (β p / M ′, β q / M ′). The "ˆ ! and "ˆ ! components of the vector amplitude Rpq ! are:
Rpq ! " != !# Rpq" ,!!!!!!!!!! Rpq ! $ != !# Rpq$ !
!
(14.78)
The image field is obtained by substituting (14.76) into the Debye–Wolf integral (14.72): y! ( . + 2$ % x ! Eimg ( x !, y ! )!!=!!exp[" j k !( sx!i x ! + sy!i y ! )] # p # q Rpq ! exp - j ' p d + q d * 0 M & x y ) , /
(14.79)
with the modified vector Floquet mode Rpq ! defined by:
Rpq ! !!=!!"
n !cpq ! n cpq
1 p2$ q2$ ( . + % Rpq ,! sy!i " ! exp -" j k !# ' sx!i " ! ! k dy *) 0 M k d M M! x & , /
(14.80)
338
Advances in FDTD Computational Electrodynamics: Photonics and Nanotechnology
The phase factor in front of the summations in (14.79) is also present in the object-space field distribution (14.27). It is enforced by the plane wave incident on the periodic scatterer. An interesting consequence of (14.79) and (14.80) is that not only the image is inverted, but the polarization of the electromagnetic field in the image is inverted as well. This is seen more clearly if we assume M ′ = 1 and Φ = 0 in (14.80), which gives Rpq ! = " Rpq ! . This result is intuitively satisfying, since it implies a vector inversion of the electromagnetic field as a generalization of the classical image inversion of geometrical optics. If the image field (14.79) is to be evaluated at a few (x′, y ′) positions, it can be calculated directly by a brute-force method. If a whole region is of interest, then a DFT-based evaluation is more efficient. It will now be shown that, using the DFT (and its efficient computation by the fast Fourier transform, FFT), expression (14.79) for the image field can be evaluated at a discrete rectangular grid of (x′, y ′) points with an arbitrary spacing in x′ and y′. First, it is important to remember that the p and q indices in (14.79) belong to a finite set. They are the indices of the scattered Floquet modes Rpq that fall within the entrance pupil, and subsequently leave the exit pupil. The range of indices in (14.79) is thus defined by the following condition: 2
2# ' 2# ' $ $ &% sx!i " p M ! k d )( + & sy!i " q M ! k d ) y ( % x
2
(14.81)
This condition is shown geometrically in Fig. 14.14.
Fig. 14.14 Admissible Floquet modes for a periodic scatterer. Only those that fall within the exit pupil contribute to the image.
In Fig 14.14, a rectangular grid of points ( sx!p, sy!q ) is represented by the indices p and q. The origin (p , q) = (0, 0) of the indices corresponds to ( sx!i , sy!i ) . Only the direction cosines that fall within a circle of radius sinθ img are counted in (14.79) because of the condition (14.81). Let pmin , p max denote the minimum and maximum permissible indices in p, and qmin , qmax denote the corresponding indices for q. Let us write the summation term in (14.79) as a double
Chapter 14: Computational Optical Imaging Using the FDTD Method
339
summation over a rectangular region of indices limited by pmin , p max , q min , and qmax , with the implicit assumption that Rpq ! vanishes outside the range set by (14.81): pmax
qmax
y! ' * 2# $ x ! Rpq ! exp , j & p + q ) / d d y (. p= pmin q=qmin + M% x
" "
(14.82)
which becomes, after shifting the indices by pmin and qmin :
) 2! # exp + j % pmin * M$
x" dx
+ qmin
y" & ,
pmax / pmin qmax /qmin
dy (' . -
0 p=0
0 q=0
y" & , ) 2! # x " Rp+ " pmin , q+qmin exp + j % p + q ( . dx dy ' M $ * -
(14.83)
The summation term above will take a true DFT form if it is sampled at a discrete set of points. Consider the sampling:
( x !, y ! )!!=!!(m"x, n"y)!!!!!!!!!!m = 0!...!P # 1,!!!!!!!n = 0!...!Q # 1
(14.84)
in which Δ x and Δ y are chosen such that the sampling covers the entire magnified periods in both x ′ and y ′ :
P!x!=!Mdx ,!!!!!!!!!!Q!y!=!Mdy
(14.85)
Substituting (14.84) in (14.83), the summation term becomes: pmax " pmin qmax "qmin
# p=0
# q=0
pm + Rp+ ! pmin , q+qmin exp - j 2$ %' + & P ,
qn ( . Q
*) 0 /
(14.86)
This expression is almost in the same form as a DFT, and can be evaluated using the same efficient FFT algorithms [50]. In fact, when divided by PQ, it is called the (P × Q)-point inverse DFT of R p+ ! pmin , q+qmin . For an efficient FFT operation, P and Q should be chosen to have small multiple prime factors. Once the inverse-DFT expression (14.86) is computed, the image field (14.79) is directly obtained at the sampled image positions ( x !, y ! )!=!(m"x, n"y) . This sampling can be made arbitrarily fine by increasing P and Q. 14.7.3 Nonperiodic Scatterers For a nonperiodic scatterer, the far-zone field is evaluated at a discrete set of observation directions. Two different arrangements for this discrete set were shown in Fig. 14.10. If the rectangular arrangement of Fig. 14.10(a) is chosen, then the direction cosines ( sx!, sy! ) are also distributed in a rectangular grid inside a circle of radius sinθ img. The relationship between the object-side strength factor Es(sx, sy) and the image-side strength factor Es! ( sx!, sy! ) is given by (14.66). Once Es! ( sx!, sy! ) is determined, the Debye–Wolf integral (14.72) for the image field can then be evaluated numerically using a DFT. A quick comparison shows that (14.72) is in the same form as the inverse-Fourier-transform relation (14.17), except for a trivial change of variables ( sx!, sy! ) " ( k !sx!, k !sy! ) . Since the double integral only covers the region [( sx! )2 + ( sy! )2 ]1/2 " sin # img, we can extend the limits of the integral
340
Advances in FDTD Computational Electrodynamics: Photonics and Nanotechnology
from – ∞ to ∞ and assign Es! ( sx!, sy! ) = 0 for [( sx! )2 + ( sy! )2 ]1/2 > sin " img. Using the 2-D Fourier relation (14.16), we can invert the relation (14.72) to obtain:
Es! ( sx!, sy! )!=!
" j k ! cos # ! 2$
exp[ j k !%( sx!, sy! )] && Eimg ( x !, y ! ) exp[ j k !( sx! x ! + sy! y ! )] dx !dy ! x, y
(14.87)
Let the direction cosines inside the imaging cone be discretized by dividing the rectangular region defined by ! sin " img < sx# < sin " img and ! sin " img < sy# < sin " img into P × Q rectangular patches, and choosing ( sx!p , sy!q ) to be at the center of each patch:
sx! p !=! sx!0 + p" sx! !!!!!!!!!! p = 0!...,!P # 1 sy!q !=! sy!0 + q" sy! !!!!!!!!!!!q = 0!...,!Q # 1
(14.88)
sx!0 = " sin # img (1 " 1 / P ),!!!!!!!!!!!! sy!0 = " sin # img (1 " 1 /Q )
(14.89)
where
and the sampling periods ! sx" and ! sy" are:
! sx" ! =! 2 sin # img / P ,!!!!!!!!!! ! sy" ! =! 2 sin # img / Q
(14.90)
Now, we define an auxiliary variable G !( sx!, sy! ) that combines the strength factor Es! ( sx!, sy! ) with the cosθ ′ factor and the aberration phase factor exp[! j k "#( sx", sy" )] in (14.87) as follows:
G !( sx!, sy! )!! !!!
Es! ( sx!, sy! ) cos " !
exp[# j k ! $( sx!, sy! )]
(14.91)
This definition facilitates the direct application of a 2-D DFT to the numerical evaluation of (14.72). The 2-D array resulting from the sampling of the auxiliary variable G !( sx!, sy! ) according to (14.88) is defined as:
G ![ p, q]!!=!! G !( sx!p , sy!q )
(14.92)
Now, it will be shown how the 2-D DFT of the array G ![ p, q] can be related to the continuous image field Eimg ( x !, y ! ) in (14.72). Adopting the same convention as in Section 14.6, we define the 2-D DFT of G ![ p, q] as: N p "1 Nq "1
E[m, n]!!!=!! 0
0 G![ p, q] exp *," j 2# $&% Npm + Nqn ')( -/
p=0 q=0
+
p
q
.
(14.93)
The DFT lengths Np and N q are greater than or equal to P and Q, respectively. If they are greater, then G ![ p, q] is zero-padded up to the required length. It is shown in Appendix 14C that E[m, n] is a sampled and periodically replicated (aliased) version of the continuous image field Eimg ( x !, y ! ) :
Chapter 14: Computational Optical Imaging Using the FDTD Method
'. (n + sNq ) ) / % x p ( 0r=12 s=12 , !!!!!!!!!!!!!!!!!!!!!!!!!!!!!!!!!!!!!!!!!!!!!!!!!!!!!!!!!!!4! Eimg (m# x + rDx" , n# y + sDx" ) E[m, n]!!!= !
2! j k "#sx" #sy"
2
*
2
$ sx"
3 3 exp +- j2! & #s " N 0
(m + rN p ) +
341
sy"
0
#sy" Nq
(14.94)
in which the spatial sampling periods Δx, Δy and the aliasing periods Dx! , Dy! are defined as:
! x !=!
2" 2" ,!!!!!!!!!!! y !=! k # !sx# N p k # !sy# Nq
Dx! !=!Np " x != !
(14.95)
2# 2# ,!!!!!!!!!! Dy! !=!Nq "y != ! k ! " sx! k ! " sy!
(14.96)
If the shifted replicas of Eimg (m!x , n!y ) in (14.94) do not overlap, then Eimg (m!x , n!y ) can be retrieved from (14.94) as follows:
Eimg (m!x , n!y )!"!!
j k #! sx# ! sy# 2$
, & sx# exp .% j2$ ( 0 m + ' !sx# Np .-
sy#0 !sy# Nq
)/ n + 1 E[m, n] * 10
(14.97)
for a range of m and n values centered around m = n = 0 over which Eimg (m!x , n!y ) is nonzero. The condition for this retrieval is that the aliasing periods Dx! , Dy! are greater than the x ′ and y ′ dimensions Wx!, Wy! of the “nonzero-field area” over which the amplitude of the electromagnetic field Eimg ( x !, y ! ) is non-negligible:
Dx! !>!Wx! ,!!!!!!!!!! Dy! !>!Wy!
(14.98)
Barring diffraction effects on the order of ~λ, the dimensions Wx!, Wy! are equal to the corresponding dimensions at the object-side multiplied by the magnification M of the system. At the end of Section 14.6, these object-side dimensions were defined as Wx and Wy. It follows that the dimensions Wx!, Wy! of the “nonzero-field area” at the image space are given by M Wx and M Wy. Using the definitions of the aliasing periods Dx! , Dy! in (14.96), the non-aliasing condition (14.98) becomes:
!sx" !
2# 2# ,!!!!!!!!!!!sy" !
(14.99)
The Abbe sine condition (14.56) also relates the sampling periods (!sx , !sy ), (!sx", !sy" ) at the entrance and exit pupils linearly through M ′ = n ′ M / n. Using this relationship and k ′/ k = n ′/ n in (14.99), we obtain the sampling relations (14.55) given at the end of Section 14.6, reproduced here for convenience:
!sx !< !
2" 2" ,!!!!!!!!!!!sy !< ! kWx kWy
(14.100)
This condition places an upper limit on the distances Δsx and Δsy between the direction cosines of the angles at which the far-zone field is collected [see Fig. 14.10(a)].
342
Advances in FDTD Computational Electrodynamics: Photonics and Nanotechnology
Assuming that the retrieval (14.97) is accurate, the electric field Eimg ( x !, y ! ) is now known at discrete spatial positions (m Δ x, n Δ y). We know that the vector field Eimg ( x !, y ! ) is spatially bandlimited, since Es! ( sx!, sy! ) is only nonzero inside [( sx! )2 + ( sy! )2 ]1/2 "!sin # img . The spatial bandwidth of the field is therefore 2 k ′sinθ img . From the Nyquist sampling theorem, this bandlimited field is completely determined by its sampled version Eimg(mΔ, nΔ) if the sampling period is smaller than or equal to ! = 2" / (2 k # sin $ img ) = % # / (2 sin $ img ) , which corresponds to the traditional definition of the “diffraction limit.” For the minimum allowable DFT lengths Np = P and Nq = Q in (14.93), it follows from (14.90) that both sampling periods in (14.95) are equal to this limit, and the continuous field Eimg ( x !, y ! ) is represented by the least possible number of sampling points. To evaluate the continuous field Eimg ( x !, y ! ) at higher spatial precision, one can simply increase the DFT lengths Np and Nq . A second way to numerically evaluate (14.72) follows from a generalization of the Nijboer– Zernike aberration theory [1], called the extended Nijboer–Zernike (ENZ) theory by its developers [127 – 130]. The important features of the ENZ method are the evaluation of the series expansions in the original Nijboer–Zernike method with more terms, and the redefinition of the aberration function !( sx", sy" ) as a complex quantity, thereby accounting for the variations of the vector amplitude Es! ( sx!, sy! ) on the wavefront. In the ENZ method, one starts by expanding the aberration function !( sx", sy" ) into a series in the form:
!( sx", sy" )!!=!! % n, m # nm Rnm ( s " ) cos(m$ " )
(14.101)
in which s ! = [( sx! )2 + ( sy! )2 ]1/2 and φ ′ is the azimuthal angle in the image space. In (14.101), Rnm ( s ! ) are the Zernike circle polynomials [1], and different terms in (14.101) are orthogonal to each other inside the unit circle. The coefficients α n m can therefore be obtained by integrating !( sx", sy" ) Rnm ( s " ) cos(m# ") over the unit circle and making use of the orthogonality property. Because polar coordinates ( s !, " ! ) are used in (14.101), the polar arrangement of (sx, sy ) in Fig. 14.10(b) at the collection step is more suitable for this integration. Next, the generalized Debye–Wolf integral (14.72) is expanded into an infinite series in !( sx", sy" ) , resulting in definite integrals involving the products of exponential and Bessel functions. These integrals can be evaluated off-line, and lookup tables can be generated for repeated use in the future. Using these lookup tables and the coefficients α n m of the aberration function !( sx", sy" ) , the generalized Debye–Wolf integral (14.72) can be calculated to a desired degree of accuracy. Any additional phase term in the aberration function !( sx", sy" ) requires only the recalculation of the coefficients α n m. At this point, the use of Zernike circle polynomials in (14.101) becomes a real advantage. If the additional phase term for the aberration is expressed in terms of Zernike polynomials, only the α n m terms that have the same indices as those polynomials will be affected. As a result, the effects of primary aberrations (spherical aberration, coma, astigmatism, etc.) on the imaging performance can be investigated extremely efficiently, without any need to carry out a 2-D numerical integration or numerical quadrature for each different aberration. The ENZ method has also been generalized to planar multilayered structures [131]. The ENZ formulation does not suffer from the aliasing artifacts encountered in the DFTbased formulation. It is inherently geared toward synthesizing the images of nonperiodic structures. In [53, 84, 85], the image-space field distributions (also called aerial images in photolithography) of nonperiodic masks were computed using the ENZ method. On the other hand, convergence and range-of-validity issues are of greater importance in the ENZ method
Chapter 14: Computational Optical Imaging Using the FDTD Method
343
because of the heavy use of series expansions. The relative theoretical complexity and the difficulty of constructing the lookup tables is another disadvantage. Remember that the integral expression (14.72) for the image field is based upon a coherent illumination beam. If Köhler illumination is employed (see Section 14.4.2), this coherent illumination beam is one of the plane-wave components in Fig. 14.5. To obtain the total intensity at the image space, the image intensities corresponding to every incidence direction and polarization in Fig. 14.5 should be added. We recall that the image intensity due to a single plane wave is proportional to the absolute square of Eimg ( x !, y ! ) in (14.72). One subtle point that needs to be addressed with regard to non-periodic scatterers is the presence of planar material layers in the object space. This issue was touched upon at the end of Section 14.6. The NFFFT surface S in Fig. 14.9(b) only collects the scattered field and not the incident or reflected beam. Therefore, the contribution to the image by the latter needs to be calculated separately. Let the incident or reflected beam be a plane wave with direction cosines (sxi , syi ) in the object space. Other coherent beams can be expressed as a sum of plane waves (see Section 14.4.1). Notationally, this plane wave can be regarded as the zeroth-order Floquet mode in (14.27):
Ei (x, y)!!=!! R00 exp[ ! jk(sxi x + sy i y)]
(14.102)
With this notation, the results for the image field of periodic scatterers in Section 14.7.2 are immediately applicable. Only considering the (p, q) = (0, 0) mode in (14.79), the image field due to the incident or reflected plane wave is found as:
Eimg ( x !, y ! )! =!"
n ! cos # i
1 R00 ! exp[ " j k !$( sx!i , sy!i )] exp[ " j k !( sx!i x ! + sy!i y ! )] n cos # i! M !
(14.103)
in which R00 ! is given by (14.78). Using (14.103), each incident or reflected plane wave can be propagated to the image space and added coherently to the image field (14.97) scattered from the object. We conclude this section with a brief discussion of broadband imaging. Almost all of the formulation presented for the illumination, collection, and refocusing steps has been for harmonic time dependence exp(jω t), which corresponds to full temporal coherence and an infinitesimally narrow bandwidth. All the results so far can be immediately generalized to a broadband source. It was mentioned in Section 14.2 that a large class of optical sources can be modeled as statistically stationary in time. The total intensity at any position ( x !, y ! ) at the image plane is the integral of the power spectral density Simg ( x !, y !; " ) across all frequencies. From the power spectral density relation (14.3), Simg ( x !, y !; " ) is the product of the power spectral density Si (! ) of the excitation and the frequency response H(ω ) of the system. As mentioned in Section 14.2, the frequency response H(ω ) can be evaluated at multiple frequencies in a single simulation run if a broadband method such as FDTD is used to calculate the time-domain scattering response. Another technical point related to broadband simulation is the effect of different excitation wavelengths on the numerical calculation of the image. If the discrete arrangement of the ! sx" , ! sy" defined by (14.88) is kept fixed at every frequency, the spatial sampling periods Δ x, Δ y as well as the aliasing periods Dx!, Dy! in (14.95), (14.96) for the sampled image field (14.94) scale linearly with the wavelength λ. This complicates the direct summation of the image field in the
344
Advances in FDTD Computational Electrodynamics: Photonics and Nanotechnology
image plane, since the field is evaluated at different spatial points at different wavelengths. To avoid this complication, it is advisable to scale the direction cosines Δ sx , Δ sy (therefore the ! sx", ! sy" ) linearly by the wavelength in the collection step. This implies that a different set of observation directions is recorded for each wavelength in the near-field-to-far-field transform step (see Section 14.6). An additional advantage of scaling the direction cosines with the wavelength is that the no-aliasing condition (14.99) becomes only dependent on the spatial extent of the object-side field distribution, and independent of the wavelength. 14.8 IMPLEMENTATION EXAMPLES: NUMERICAL MICROSCOPE IMAGES In this section, we present examples of numerical microscope images synthesized using a software package (which we’ve named Angora) that implements techniques reviewed in the previous sections. The Maxwell’s equations solver that generates the near-fields for each object to be computationally imaged is our in-house implementation of the 3-D FDTD method. Angora has been used to generate original results for previous publications [11, 37, 46, 112] and has been thoroughly tested and verified. It is freely available under the GNU Public License [132]. In each of the following examples, the object and image spaces are both free space, i.e., n′ = n = 1. The object and image-space wavenumbers are equal (k′ = k = k0), and from (14.57), the angular de-magnification M ′ is equal to the magnification M. 14.8.1 Letters “N” and “U” Embossed on a Thin Dielectric Substrate We consider first the numerical microscope image of a thin structure forming the letters “N” and “U” embossed on an infinite dielectric substrate. Figure 14.15(a) illustrates 2-D cross-sections of the simulation geometry across the x–y and x–z planes. The embossed structure was assumed to be a dielectric of refractive index n = 1.38 and dimensions 12 × 6 × 0.27 µm, situated on a glass half-plane of refractive index n = 1.5. This represented an idealized situation with the embossed structure resting on a glass slide, with the illumination focused on the top surface of the slide and the thickness of the slide much larger than the focal depth of the illumination. Since even the smallest-NA illumination has a finite focal depth in practice, this condition was very easy to fulfill. Consequently, the scattered beam due to the bottom surface of the slide was far out of focus and spread over a large area, and could be neglected. The structure was illuminated normally by a y-polarized plane wave having the modulatedGaussian time waveform sin(2! f0 t) exp(" t 2 / 2# 2 ) with f0 = 5.89 × 10¹⁴ Hz and τ = 2.13 × 10⁻¹⁵ sec. The –20-dB free-space wavelengths of this beam were 400 and 700 nm. This approximated a polarized illumination beam with very low illumination NA (see Section 14.4.1). Incoherent and unpolarized illumination could be achieved by repeating this simulation for multiple incidence directions and polarizations (see Section 14.4.2, especially the discussion involving Fig. 14.5). The scattered near fields were computed in a 12.635- × 6.65- × 0.5985-µm FDTD grid with 13.33-nm cubic unit cells and a time-step set at 0.98 times the Courant limit. Ten-cell-thick convolution perfectly matched layer (CPML) [133] absorbing boundaries simulated the grid extending to infinity. Plane-wave sourcing was via the total-field/scattered-field formulation [29] with multilayer capabilities [46], where the TF/SF interface was located 8 grid cells from the CPML inner surface. The scattered field was collected on a virtual surface located 4 grid cells from the CPML, and transformed to the far field using a frequency-domain vector-potential NFFFT algorithm [29] for a two-layered medium [110].
Chapter 14: Computational Optical Imaging Using the FDTD Method
345
(a)
(b)
(c)
(d)
(e)
(f)
(g)
Fig. 14.15 Example of a 3-D FDTD computational imaging simulation, where the synthesized images are all in grayscale. Here, the letters “N ” and “U ” are assumed to be embossed on a glass substrate and imaged at magnification M = 10: (a) x–y and x–z cross-sections of the FDTD grid; (b) bright-field image for NAobj = 0.9; (c) bright-field image for NAobj = 0.4; (d) bright-field image for NA obj = 0.2; (e) dark-field image; (f) phase-contrast image; (g) image of the offfocus plane z = 6 µm.
346
Advances in FDTD Computational Electrodynamics: Photonics and Nanotechnology
The far field was calculated at a set of observation directions ( θ, φ ) arranged as in Fig. 14.10(a), with equally spaced direction cosines (sx, sy) within a collection numerical aperture NAobj = 0.9. The spacings of the direction cosines were Δsx = 0.0167 and Δsy = 0.0333. A smaller spacing was necessary in sx because the structure was wider in the x-direction [see (14.100) in Section 14.7.3]. At each observation direction, the far field was calculated at 7 wavelengths between 400 and 700 nm with equal spacing in k = 2 π / λ. It was assumed that the microscope had a magnification M = 10, and was free of aberrations (Φ = 0). The sampled field distribution Eimg (m!x , n! y ) at the image plane was calculated using the DFT-based refocusing algorithm of Section 14.7.3, described by (14.92) – (14.97) with Es! ( sx!p , sy!q ) given by (14.66). The continuous field Eimg ( x !, y ! ) was oversampled with Np = Nq = 256 in (14.93) for a smooth intensity image. Since the scattering geometry was two layered, the plane wave reflected from the air–glass interface had to be propagated to the image space using (14.102) and (14.103). We now review sample results of the computational image synthesis. Unless otherwise noted, all intensity spectra in Figs. 14.15(b)–(g) are normalized by the intensity spectrum at a pixel corresponding to the glass. Figure 14.15(b) depicts in grayscale the mean of the normalized image intensity across all wavelengths (called the bright-field image) for a collection NA of 0.9. Here, the grayscale limits are black (0) and white (1.85). Figures 14.15(c) and 14.15(d) show how this image is blurred by reducing the collection NA to 0.4 and 0.2, respectively, with the same grayscale limits. In fact, this blurring is due to the degraded diffraction limit. In Fig. 14.15(e), the plane wave reflected from the glass slide is subtracted from the image, resulting in a modality similar to dark-field microscopy. If the reflected plane wave is phase-shifted by 90˚ instead of being subtracted from the total image, the image in Fig. 14.15(f) is obtained. This is very similar to the procedure followed in phase-contrast microscopy. In both Figs. 14.15(e) and 14.15(f), the collection NA is 0.9 and the spectra are normalized by the same glass spectrum used to normalize the previous figures. However, the grayscale limits are 0 and 3.5 because of the higher intensity contrast. We can see that the phase-contrast image yields better contrast than the dark-field image. Finally, in Fig. 14.15(g), the normalized brightfield image of the off-focus plane z = 6 µm at the object space is shown for a collection NA of 0.9. The distortion of the image due to the lack of sharp focus is clearly visible. 14.8.2 Polystyrene Latex Beads In the second example [11], we compare the numerical “microscope in a computer” images and spectra of polystyrene latex beads to physical laboratory measurements using a microscope coupled to a spectrometer and a CCD camera. In the laboratory measurements, two different sizes of polystyrene latex beads (2.1 and 4.3 µm in diameter, Thermo Scientific) were placed on a glass slide of refractive index n = 1.5. The refractive index of the latex beads was specified to be between 1.59 and 1.61 in the wavelength range of 486 to 589 nm. White-light illumination was provided by a xenon lamp. This illumination was passed through a diffuser to smoothen inhomogeneities, and then projected on the sample using a Köhler setup with illumination numerical aperture NAill = 0.2. The magnification of the microscope was M = 40, and the collection numerical aperture was NAobj = 0.6. The image of the sample was projected on a spectrograph with a 10-µm-wide slit coupled to a CCD camera. This recorded the spectra along a column of pixels, resulting in a 2-D data array. In turn, a 3-D spectroscopic image was acquired by scanning the slit of the spectrograph over the image with 10-µm steps. More details of the optical measurements can be found in [134].
Chapter 14: Computational Optical Imaging Using the FDTD Method
347
As in the previous example, the bottom surface of the glass slide was far out of focus, and the reflection from that interface was spread over a large area with much reduced intensity at the top interface. Therefore, the glass slide was modeled as a two-layered space. Consequently, the multilayer techniques used for the previous example were also used here. The parameters for the FDTD-synthesized images shown in Fig. 14.16 were as follows: grid dimensions 5 × 5 × 5 µm with 31-nm cubic unit cells, and a time-step equal to 0.98 times the Courant limit. The FDTD grid was terminated with a 10-cell-thick CPML absorbing boundary.
Fig. 14.16 Comparison of FDTD-synthesized and measured bright-field grayscale microscope images and pixel spectra for an isolated polystyrene latex bead. Top: 2.1-µm bead; bottom: 4.3-µm bead. Source: Capoglu et al., Optics Lett., vol. 36, no. 9, 2011, pp. 1596–1598, 2011 The Optical Society of America.
Regarding the synthesis procedure used to generate the images shown in Fig. 14.16, a fixed refractive index value of n = 1.61 was chosen for the polystyrene bead as a first approximation. Exploiting the rotational symmetry of the bead and the microscope setup, 204 incident plane waves (102 × 2 polarizations) were distributed in the Cartesian arrangement of Fig. 14.5 only within the first quadrant of the circle of illumination. The final image was synthesized by rotating the resulting image intensity by 0˚, 90˚, 180˚, and 270˚, and adding the intensities.
348
Advances in FDTD Computational Electrodynamics: Photonics and Nanotechnology
Each incident plane wave had a sine-modulated Gaussian waveform with –20-dB wavelengths at 486 and 589 nm. The scattered light was collected at a set of observation directions arranged with equally spaced 50 × 50 direction cosines (sx , sy ) inside a collection numerical aperture NAobj = 0.6. Here, the spacing in sx and sy was uniform and equal to Δ sx = Δ sy = 0.024. The far field at each direction was calculated at 30 wavelengths between 486 and 589 nm spaced linearly in k = 2π / λ. The sampled field distribution Eimg (m! x , n! y ) at the image plane was calculated with no oversampling (at 50 × 50 points) using the refocusing algorithm (14.92) – (14.97) with Es! ( sx!p, sy!q ) given by (14.66). Both the measured/simulated spectra were normalized by the measured/simulated spectrum at a glass pixel. The grayscale plots in the left and center columns of Fig. 14.16 show the FDTD-synthesized and measured bright-field images, respectively. The plots in the right column show the measured and simulated spectra between 486 and 589 nm at the pixels denoted by the arrows. Because the precise focal plane position in the measurement was unknown, the FDTD image at the optimum focusing depth was chosen for each comparison. The optimum focal positions at the object space were z = 1.58 µm for the 2.1- µm bead and z = 1.44 µm for the 4.3- µm bead. At these optimum focal positions, the root-mean-square errors in the spectra were 11.4% and 8.2%, respectively. This error was primarily caused by the dispersive nature of the beads and the variations in their sizes. 14.8.3 Pair of Contacting Polystyrene Microspheres in Air Figure 14.17 illustrates an example of the excellent accuracy of the “microscope in a computer” in computationally synthesizing images of penetrable micron-scale objects, especially when using a high-resolution 3-D FDTD model having a uniform grid cell size of 10 nm. This figure compares the measured and computationally synthesized bright-field grayscale images of two adjacent contacting 4.3-μm-diameter polystyrene microspheres in air. A numerical aperture of 0.6 was used, assuming illumination wavelengths between 400 and 700 nm. Each image is normalized by its maximum intensity, and the same grayscale is used for both.
Fig. 14.17 Comparison of (a) measured and (b) FDTD-synthesized bright-field grayscale microscope images of a pair of adjacent contacting 4.3-μm-diameter polystyrene microspheres in air for NA = 0.6 and wavelengths between 400 and 700 nm.
Chapter 14: Computational Optical Imaging Using the FDTD Method
349
14.8.4 Human Cheek (Buccal) Cell This section demonstrates the feasibility of using the “microscope in a computer” to synthesize the bright-field true-color image of a biological cell. For this study, it was decided to computationally image a readily available human cell, a cheek (buccal) cell, swabbed from the interior cheek surface. The approximate overall dimensions of this cell were 80 × 80 × 1 µm. The surface profile of the cheek cell was measured with nanometer resolution using atomic force microscopy, and read into the FDTD grid. For the initial model, the cell was assumed to be filled with a homogeneous lossless dielectric of refractive index n = 1.38 (a value guided by previous experimental studies), resting on a glass slide (n = 1.5). The 3-D FDTD grid was configured with 3400 × 3400 × 58 cubic cells of size 25 nm, spanning an overall volume of 85 × 85 × 1.45 µm. The grid was terminated with a 5-cell CPML, and the time-step was 0.04715 fs (2% below the Courant stability limit). Two illuminations having orthogonal polarizations were modeled separately, and the resulting intensities were added to obtain the final image. Each illumination was a normally incident plane wave having a sine-modulated Gaussian time-waveform with –20-dB wavelengths of 400 and 700 nm. FDTD computations were parallelized using the OpenMPI implementation of the message-passing interface (MPI) standard, and executed on 256 processors (16 × 16 × 1 Cartesian division) of the Quest supercomputer at Northwestern University. The total simulation time was ~30 hours. The far field was computed at a range of directions arranged in a 2-D Cartesian pattern in the direction-cosine space. Direction cosines were spaced Δsx = Δsy = 0.0048 apart from each other inside a collection numerical aperture of NAobj = 0.6. For each observation direction, 10 wavelengths spaced linearly in wavenumber k were recorded from 400 to 700 nm. The final intensity spectrum was normalized by the spectrum of a glass pixel, resulting in a normalized spectroscopic reflectance image.
Fig. 14.18 FDTD-synthesized bright-field true-color microscope image of a human cheek (buccal) cell modeled in a 3-D grid having uniform 25-nm cubic cells.
350
Advances in FDTD Computational Electrodynamics: Photonics and Nanotechnology
Using the CIE color-matching functions documented for average human vision [135], a true-color image of the cheek cell was generated from the wavelength spectrum of the FDTD-synthesized image. This was done by reducing the wavelength spectrum into three numbers that represent the response of human photoreceptor cones sensitive to short, middle, and long wavelengths. The resulting bright-field true-color image of the human cheekcell model is shown in Fig. 14.18.
14.9 SUMMARY This chapter presented a comprehensive account of the theoretical principles and literature references that comprise the foundation for emerging numerical electromagnetic simulations of optical imaging systems based on three-dimensional full-vector solutions of Maxwell’s equations. These techniques permit the computational synthesis of images formed by every current form of optical microscopy (bright-field, dark-field, phase-contrast, etc.), as well as optical metrology and photolithography. Focusing, variation of the numerical aperture, and so forth can be adjusted simply by varying a few input parameters – literally a “microscope in a computer.” This permits a rigorous simulation of both existing and proposed novel optical imaging techniques over a 107:1 dynamic range of distance scales, i.e., from a few nanometers (the voxel size within the microstructure of interest over which Maxwell’s equations are enforced) to a few centimeters (the location of the image plane where the amplitude and phase spectra of individual pixels are calculated). We showed how a general optical imaging system can be segmented into four self-contained sub-components (illumination, scattering, collection and refocusing), and how each of these sub-components is mathematically analyzed. Approximate numerical methods used in the modeling of each sub-component were explained in appropriate detail. Relevant practical applications were cited whenever applicable. Finally, the theoretical and numerical results were illustrated via several implementation examples involving the computational synthesis of microscope images of microscale structures. This chapter will hopefully constitute a useful starting point for those interested in modeling optical imaging systems from a rigorous electromagnetics point of view. A distinct feature of our approach is the extra attention paid to the issues of discretization and signal processing. This is a key issue in finite methods, where the electromagnetic field is only given at a finite set of spatial and temporal points.
ACKNOWLEDGMENT The numerical simulations in Section 14.8 were made possible by a supercomputing grant on the Quest high-performance computing system at Northwestern University.
APPENDIX 14A: DERIVATION OF EQUATION (14.9) The mutual coherence function J !(xd ; yd ) resulting from the finite collection of plane waves in Fig. 14.5 is:
J !(xd ; yd )!!=!!"sx "sy $ m, n P(sxm , syn ) exp[ # jk(sxm xd + syn yd ) ]
(14A.1)
Chapter 14: Computational Optical Imaging Using the FDTD Method
351
where both m and n range from – ∞ to ∞. Expression (14.6) for the original mutual coherence function J (xd ; yd ) is in the form of a Fourier transform, and can be inverted to yield the following for P(sx , sy ):
P(sx , sy )!!=!!
k2 (2! )2
$ $
% % J( x " ; y" ) exp[ jk(s x " + s y" )] dx " dy" d
d
x d
y
d
d
d
(14A.2)
#$ #$
Primed coordinates are used to avoid confusion in what follows. becomes:
Using (14A.2), (14A.1)
$ $
J !(xd ; yd )!!=!! %
% dx " dy" J( x " ; y" ) d
d
d
d
#$ #$
&!!
k 2 'sx 'sy (2( )
2
(14A.3)
)
m, n
exp { j k [ sxm(xd" # xd ) + syn ( yd" # yd ) ]}
Substituting sxm = m!sx and syn = n!sy , the expression on the second line of (14A.3) becomes [136]: ,
,
&
- - ! (' x " # x d
d
#r
r=#, s=#,
2$ ) ) & ! ( yd" # yd # s + k%sy +* k%sx * ' 2$
(14A.4)
which, when substituted into (14A.3), yields the desired relation (14.9).
APPENDIX 14B: DERIVATION OF EQUATION (14.38) The original, periodic, continuous vector field E(x, y) can be written using the Floquet expansion (14.27) as follows: #
#
E(x, y)!!=!! $
$R
ab
exp[ ! j (" a x + "b y)]
(14B.1)
a=!# b=!#
where the integral indices a, b are used to avoid later confusion with the Fourier indices p, q. Sampling this function at mΔx and nΔy, where Δx and Δy are given by (14.35), and applying the phase shift as defined in (14.36), one obtains: $
E[m, n]!! =!! %
$
%R
ab
exp[ ! j (" a m#x + "b n#y)]
a=!$ b=!$
m n ,2 / ) !!!!!!!!!!!!!!!!!!!!!!!!!!!!&!!exp 1 jksin ' i + dx cos (i + dy sin (i . 4 * -3 M N 0
(14B.2)
Substituting the expressions for the Floquet wavenumbers ! a = k cos "i sin # i $ a(2% /d x ) and !b = k sin "i sin# i $ b(2% /d y ) , and the sampling relations (14.35), the above expression simplifies to: )
E[m, n]!! =!! *
)
*R
a=() b=()
ab
exp "$ j 2! #
(
am bn + M N
)%'&
(14B.3)
352
Advances in FDTD Computational Electrodynamics: Photonics and Nanotechnology
Now, the DFT of this array is given by: M !1 N !1
! p, q]!! =!! E[ )
) E[m, n] exp #%$! j 2"
m=0 n=0
(
pm M
+
* M !1 N !1 =!! ) a ) b Rab + ) ) exp #%! j 2" $ , m=0 n=0
(
qn N
) &('
( p ! a)m M
+
(q ! b)n N
)
& . '( /
(14B.4)
The double-summation expression in brackets in the second line of (14B.4) is equal to: #
MN $
#
$ ! (a, p + rM ) ! (b, q + sN )
(14B.5)
r="# s="#
where δ (. , . ) is the Kronecker delta symbol. Substituting (14B.5) in (14B.4), we obtain the desired relation (14.38).
APPENDIX 14C: DERIVATION OF EQUATION (14.94) The sampled auxiliary variable G ′[p, q] of (14.92) is, from (14.87) – (14.90):
G ![ p, q]!!=!!
" jk! 2#
$ $
% % dx ! dy! E
img
( x !, y ! ) (14C.1)
"$ "$
!!!!!!!!!!!!!!!!!!!!!!& exp[ j k !( sx!0 x ! + sy!0 y ! )] exp[ j k !( p'sx! x ! + q'sy! y ! )] The DFT of G ′[p, q] is, from (14.93): Np "1 Nq "1
E[m, n]!!=!! 0
* +
p=0 q=0
=!!
" jk! 2#
1 1
2 2 dx ! dy! E
img
"1 "1
Np "1 Nq "1
!!!!!!3
$ pm
0 G![ p, q] exp ," j 2# &% N
p
qn ' Nq
)( / .
( x !, y ! ) exp[ j k !( sx!0 x ! + sy!0 y ! )]
75 *$
0 0 exp 67 j ,&% k !4s ! x ! " p=0 q=0
+
8 +
x
(14C.2)
9 2# n ' - 7 $ )( p + &% k ! 4 sy! y ! " Nq )( q / : . 7;
2# m ' Np
The summations in p and q can be extended to infinity, since G ′[p, q] is only nonzero for a finite number of p and q values. The resulting infinite summation is equal to an infinite series of Dirac delta functions [136]:
Chapter 14: Computational Optical Imaging Using the FDTD Method
8
8
31 +%
9 9 exp 23 j -'& k !"s ! x ! #
p=#8 q=#8
x
4 ,
8
2$ n ( . % *) p + '& k ! " sy! y ! # Nq *) q 0 /
2$ m ( Np
35 6!!= 37
353
(14C.3)
8
2$ m 2$ n % ( % ( !!!!!!!!!!!!!!!!(2$ ) 9 9 : ' k !" sx! x ! # # 2$ r * : ' k !" sy! y ! # # 2$ s * N N q p ) & ) r=#8 s=#8 & 2
Using the scaling property of the Dirac delta function, this becomes: (2! )2 ( k " ) # sx" # sy" 2
&
&
' ' $ ( x " % m#
r=%& s=%&
x
% r Dx" ) $ ( y " % n#x % s Dy" )
(14C.4)
in which the spatial sampling periods Δx, Δy and the aliasing periods Dx!, Dy! are given by (14.95) and (14.96). Substituting this expression into (14C.2) and using the sifting property of the delta function to evaluate the integral, the desired relation (14.94) is obtained. APPENDIX 14D: COHERENT FOCUSED BEAM SYNTHESIS USING PLANE WAVES Extending the discussion in Section 14.4.1, this appendix describes an efficient procedure for synthesizing a coherent focused beam in the context of the FDTD method [37]. Our procedure has its origins in the work of Richards and Wolf [34], who described the electromagnetic theory of the coherent focused beam in terms of integrals involving special functions. In fact, we take one of their intermediate steps as our starting point by interpreting the coherent focused beam as a sum of plane waves. However, we work directly in the time domain, which is immediately suited for implementation using FDTD. Figure 14D.1 illustrates the problem geometry.
(a)
(b)
Fig. 14D.1 Geometry of the focused beam: (a) The converging lens, located far from the scatterer, creates a beam focused at F that is calculated only inside the FDTD grid, S, surrounding the scatterer. (b) The electric field on ray APF makes the same angle with the meridional plane before and after refraction through the lens. Source: Capoglu, Taflove, and Backman, Optics Express, Vol. 16, 2008, pp. 19208–19220. 2011 The Optical Society of America.
354
Advances in FDTD Computational Electrodynamics: Photonics and Nanotechnology
In Fig. 14D.1(a), the FDTD simulation space, S, is a compact region surrounding the scatterer that contains the focal point F. Spherical coordinates (r, θ, φ ) are centered at F, with the z-axis parallel to the optical axis. Refractive indices everywhere are assumed to be unity. i An incident x-polarized plane wave with the electric field E impinges on the converging lens, which then creates the spherical wavefront W converging at F. This wavefront is diffracted by the circular screen at A, which is assumed to be in the far field of S. The vector electric and magnetic fields in the vicinity of F are denoted by E(r, t) and H(r, t), respectively. In Fig. 14D.1(b), the passage of a typical ray AP through the aplanatic lens is shown in greater detail. Using geometrical optics principles, we will now derive an expression for the electric field on refracted ray PF in terms of the electric field on ray section AP. The electric ˆ The electric field field on AP is assumed to be oriented toward the x-axis; therefore eˆ i = x. E W(r, t) on the spherical converging wavefront W can be written as:
E W(r, t)!!=!! eˆ W(! , " )#
a(! , " , t + r /c) r
(14D.1)
The unit vector eˆ W(! , " ) determines the polarization of the electric field on PF, and a(! , " , t) is the strength factor of the same ray [34]. Geometrical optics principles dictate that eˆ W(! , " ) and a(! , " , t) are invariant along a ray, except for a time advance by r / c applied to the latter. i The relationship between a(! , " , t) and E (t) follows from the intensity law of geometrical optics [34]:
a(! , " , t)!!=! f # cos ! E i(t)
(14D.2)
where f is the focal length of the lens. If the incidence angles at each surface in the lens system are small, each ray stays on the same side of the meridional plane (the plane containing the ray and the optical axis) during its passage from the lens system. Furthermore, the angle that the electric field vector on a ray makes with the meridional plane is unchanged by refraction [34]. This greatly simplifies the calculation of eˆ W(! , " ). If we define the polarization angle ! (" , # ) of a ray as the angle that the electric vector on this ray makes with the meridional plane, per Fig. 14D.1(b), it follows that ! (" , # ) is given by:
! (" , # )!!=!!#
(14D.3)
This relation greatly simplifies the FDTD implementation. In FDTD, the polarization of a plane wave is commonly expressed with respect to a reference plane, which can be made to coincide with the meridional plane in Fig. 14D.1(b) [37]. Combining the above results and applying the Kirchhoff boundary condition on A, the electric field at and around focal point F can be expressed as [34, 37]: 2! "
E(r, t)!!=!!
max f eˆ W(" , # ) E! i (t $ ) cos " sin " d" d# 2! c # =0 " =0
% %
(14D.4)
where E! i denotes the time derivative of E i, θmax is the half angular range of aperture A, t ! = t + rˆ " r / c is the advanced or retarded time, and rˆ is the unit vector in the direction of r. Expression (14D.4) is a decomposition of the electric field in the image region of the lens in terms of plane waves incident from a range of directions (θ, φ ). The plane wave from (θ, φ ) has
Chapter 14: Computational Optical Imaging Using the FDTD Method
355
the polarization eˆ W(! , " ), the incidence vector kˆ W(! , " )!=!# rˆ [per Fig. 14D.1(b)], and the differential amplitude waveform (referred to the origin r = 0) given by:
dE(0, t)!!=!!
sin ! d! d" f $ cos ! sin ! d! d" ! i ! ! , " , t)!!=!! a( E (t) 2# c 2# c
(14D.5)
In FDTD, the double integral in (14D.4) is approximated by the following finite sum:
E(r, t)!!!!!
f # eˆ W($ n, % m ) E! i (t nm & ) cos $ n sin $ n !!!!n = 1, …N,!!m = 1, …M 2" c n, m n m
'
(14D.6)
in which 0 < θn < θmax and 0 < φm < 2π are the incidence angles of the plane waves, and t nm ! = t + rˆnm " r / c are the retarded times for these incidence angles. The amplitude factors αnm are the numerical integration (or quadrature) factors for the double integral in (14D.4) in θ and φ. In [37], a quadrature method based on the Gauss–Legendre rule was used for the finite sum in (14D.6). Here, we present an alternate method, based on discrete sampling theory and a Cartesian placement of plane waves in direction-cosine space [137]. The direction cosines that correspond to each incidence direction (θ, φ ) are defined as:
sx !=!!sin ! cos " !,!!!!!!!!!!!!sy !=!!sin ! sin "
(14D.7)
shown in a Cartesian distribution in Fig. 14D.2.
Fig. 14D.2 Cartesian distribution of plane-wave direction cosines within the illumination numerical aperture sin θmax for synthesis of the focused beam. Source: I. R. Capoglu, J. D. Rogers, A. Taflove, and V. Backman, Progress in Optics, Vol. 57, 2012, pp. 1–91, 2012 Elsevier.
In Fig. 14D.2, the direction cosines are confined within a circle of radius sin θmax (also called the numerical aperture of the illumination), where θmax is the illumination half-angle shown in Fig. 14D.1(a). The spacing between the direction cosines is Δs = Δsx = Δsy, which should be
356
Advances in FDTD Computational Electrodynamics: Photonics and Nanotechnology
chosen sufficiently fine to faithfully represent the focused beam around the scatterer. This choice is based on considerations of discrete sampling theory [50]. It is easier to grasp the main idea behind this theory if we consider individual monochromatic components of the time-domain expression (14D.4) or (14D.6). For one of these monochromatic components with wavenumber k = 2π / λ, it can be easily shown that the discrete arrangement in Fig. 14D.2 results in a spatially periodic illumination in the focal plane with the period:
Lp !!=!!
2! k"s
(14D.8)
This period should be large enough such that the successive periods do not overlap or contaminate the edges of the simulation grid. We know that the focused beam is confined to within a diffraction spot that is several times the spread parameter:
Wbeam !!=!!
! sin " max
(14D.9)
To avoid overlap of the periodic replicas of the beam, we should therefore have:
Lp !!>>!!Wbeam
(14D.10)
or equivalently:
!s!!
2" kWbeam
(14D.11)
If the maximum lateral extent of the FDTD grid is much larger than Wbeam, then it should replace Wbeam in sampling condition (14D.11). For wideband illumination as in (14D.4), the spread parameter in (14D.9) should be calculated using the largest wavelength in the illumination waveform.
REFERENCES [1]
Born, M., and E. Wolf, Principles of Optics: Electromagnetic Theory of Propagation, Interference and Diffraction of Light, 7th ed., Cambridge: Cambridge University Press, 1999.
[2]
Goodman, J. W., Introduction to Fourier Optics, 2nd ed., New York: McGraw-Hill, 1996.
[3]
Cole, D. C., E. Barouch, E. W. Conrad, and M. Yeung, “Using advanced simulation to aid microlithography development,” Proc. IEEE, Vol. 89, 2001, pp. 1194–1215.
[4]
Neureuther, A., “If it moves, simulate it!,” in Optical Microlithography XXI, Pts 1-3, Proc. SPIE, Vol. 6924, 2008, pp. 692402-1–15.
[5]
Neureuther, A. R., “Simulation of optical lithography and inspection,” Microelectronics Engineering, Vol. 17, 1992, pp. 377–384.
[6]
Nikolaev, N. I., and A. Erdmann, “Rigorous simulation of alignment for microlithography,” J. Microlithographic Microfabrication of Microsystems, Vol. 2, 2003, pp. 220–226.
Chapter 14: Computational Optical Imaging Using the FDTD Method
357
[7]
Hollmann, J. L., A. K. Dunn, and C. A. DiMarzio, “Computational microscopy in embryo imaging,” Optics Letters, Vol. 29, 2004, pp. 2267–2269.
[8]
Simon, B., and C. A. DiMarzio, “Simulation of a theta line-scanning confocal microscope,” J. Biomedical Optics, Vol. 12, No. 6, 2007, pp. 064020-1–9.
[9]
Tanev, S., J. Pond, P. Paddon, and V. V. Tuchin, “Optical phase contrast microscope imaging: An FDTD modeling approach,” in Optical Technologies in Biophysics and Medicine IX, Proc. SPIE, 2008, pp. 7910E-1–11.
[10] Tanev, S., W. B. Sun, J. Pond, V. V. Tuchin, and V. P. Zharov, “Flow cytometry with gold nanoparticles and their clusters as scattering contrast agents: FDTD simulation of light-cell interaction,” J. Biophotonics, Vol. 2, 2009, pp. 505–520. [11] Capoglu, I. R., C. A. White, J. D. Rogers, H. Subramanian, A. Taflove, and V. Backman, “Numerical simulation of partially coherent broadband optical imaging using the FDTD method,” Optics Lett., Vol. 36, no. 9, 2011, pp. 1596–1598. [12] Subramanian, H., P. Pradhan, Y. Liu, I. R. Capoglu, X. Li, J. D. Rogers, A. Heifetz, D. Kunte, H. K. Roy, A. Taflove, and V. Backman, “Optical methodology for detecting histologically unapparent nanoscale consequences of genetic alterations in biological cells,” Proc. National Academy of Sciences USA, Vol. 105, 2008, pp. 20118–20123. [13] Subramanian, H., P. Pradhan, Y. Liu, I. R. Capoglu, J. D. Rogers, H. K. Roy, R. E. Brand, and V. Backman, “Partial-wave microscopic spectroscopy detects sub-wavelength refractive index fluctuations: An application to cancer diagnosis,” Optics Letters, Vol. 34, 2009, pp. 518–520. [14] Hansen, R., “Focal region characteristics of focused array antennas,” IEEE Trans. Antennas and Propagation, Vol. 33, 1985, pp. 1328–1337. [15] Goodman, J. W., Statistical Optics, New York: Wiley, 2000. [16] Christov, I. P., “Propagation of partially coherent light pulses,” Optics Acta, Vol. 33, 1986, pp. 63–72. [17] Wang, L. G., Q. Lin, H. Chen, and S. Y. Zhu, “Propagation of partially coherent pulsed beams in the spatiotemporal domain,” Physical Review E, Vol. 67, No. 5, Part 2, 2003, pp. 056613-1–7. [18] Lajunen, H., P. Vahimaa, and J. Tervo, “Theory of spatially and spectrally partially coherent pulses,” J. Optical Society of America A, Vol. 22, 2005, pp. 1536–1545. [19] Papoulis, A., Probability, Random Variables, and Stochastic Processes, New York: McGraw-Hill, 1991. [20] Haykin, S., Communication Systems, 4th ed., New York: Wiley, 2001. [21] Tanev, S., V. V. Tuchin, and P. Paddon, “Cell membrane and gold nanoparticles effects on optical immersion experiments with noncancerous and cancerous cells: Finite-difference time-domain modeling,” J. Biomedical Optics, Vol. 11, 2006, pp. 064037-1–6. [22] Salski, B., and W. Gwarek, “Hybrid finite-difference time-domain Fresnel modeling of microscopy imaging,” Applied Optics, Vol. 48, 2009, pp. 2133–2138. [23] Smith, G. S., An Introduction to Classical Electromagnetic Radiation, New York: Cambridge University Press, 1997. [24] Salski, B., and W. Gwarek, “Hybrid FDTD-Fresnel modeling of microscope imaging,” in Proc. International Conf. on Recent Advances in Microwave Theory and Applications, 2008, Jaipur, India, pp. 398–399. [25] Salski, B., and W. Gwarek, “Hybrid FDTD-Fresnel modeling of the scanning confocal microscopy,” in Scanning Microscopy, Proc. SPIE, 2009, pp. 737826-1–6.
358
Advances in FDTD Computational Electrodynamics: Photonics and Nanotechnology
[26] Salski, B., M. Celuch, and W. Gwarek, “FDTD for nanoscale and optical problems,” IEEE Microwave Magazine, Vol. 11, No. 2, 2010, pp. 50–59. [27] Yeh, C., S. Colak, and P. Barber, “Scattering of sharply focused beams by arbitrarily shaped dielectric particles: An exact solution,” Applied Optics, Vol. 21, 1982, pp. 4426–4433. [28] Petersson, L., and G. S. Smith, “On the use of a Gaussian beam to isolate the edge scattering from a plate of finite size,” IEEE Trans. Antennas and Propagation, Vol. 52, 2004, pp. 505–512. [29] Taflove, A., and S. C. Hagness, Computational Electrodynamics: The Finite-Difference Time-Domain Method, 3rd ed., Norwood, MA: Artech House, 2005. [30] Judkins, J. B., and R. W. Ziolkowski, “Finite-difference time-domain modeling of nonperfectly conducting metallic thin-film gratings,” J. Optical Society of America A, Vol. 12, 1995, pp. 1974– 1983. [31] Judkins, J. B., C. W. Haggans, and R. W. Ziolkowski, “Two-dimensional finite-difference timedomain simulation for rewritable optical disk surface structure design,” Applied Optics, vol. 35, 1996, pp. 2477–2487. [32] Choi, K., J. Chon, M. Gu, and B. Lee, “Characterization of a sub-wavelength-scale 3D void structure using the FDTD-based confocal laser scanning microscopic image mapping technique,” Optics Express, Vol. 15, 2007, pp. 10767–10781. [33] Wolf, E., “Electromagnetic diffraction in optical systems: I. An integral representation of the image field,” Proc. Royal Society of London A, Vol. 253, 1959, pp. 349–357. [34] Richards, B., and E. Wolf, “Electromagnetic diffraction in optical systems: II. Structure of the image field in an aplanatic system,” Proc. Royal Society of London A, Vol. 253, 1959, pp. 358–379. [35] Munro, P., and P. Török, “Vectorial, high numerical aperture study of Nomarski’s differential interference contrast microscope,” Optics Express, Vol. 13, 2005, pp. 6833–6847. [36] Török, P., P. Munro, and E. E. Kriezis, “High numerical aperture vectorial imaging in coherent optical microscopes,” Optics Express, Vol. 16, 2008, pp. 507–523. [37] Capoglu, I. R., A. Taflove, and V. Backman, “Generation of an incident focused light pulse in FDTD,” Optics Express, Vol. 16, 2008, pp. 19208–19220. [38] Kempe, M., U. Stamm, B. Wilhelmi, and W. Rudolph, “Spatial and temporal transformation of femtosecond laser pulses by lenses and lens systems,” J. Optical Society of America B, Vol. 9, 1992, pp. 1158–1165. [39] Davidson, D. B., and R. W. Ziolkowski, “Body-of-revolution finite-difference time-domain modeling of space-time focusing by a three-dimensional lens,” J. Optical Society of America A, Vol. 11, 1994, pp. 1471–1490. [40] Ibragimov, E., “Focusing of ultrashort laser pulses by the combination of diffractive and refractive elements,” Applied Optics, Vol. 34, 1995, pp. 7280–7285. [41] Gu, M., and C. Sheppard, “Three-dimensional image formation in confocal microscopy under ultrashort-laser-pulse illumination,” J. Modern Optics, Vol. 42, 1995, pp. 747–762. [42] Veetil, S. P., H. Schimmel, F. Wyrowski, and C. Vijayan, “Wave optical modeling of focusing of an ultra short pulse,” J. Modern Optics, Vol. 53, 2006, pp. 2187–2194. [43] Coen, S., A. Chau, R. Leonhardt, J. D. Harvey, J. C. Knight, W. J. Wadsworth, and P. Russell, “Supercontinuum generation by stimulated Raman scattering and parametric four-wave mixing in photonic crystal fibers,” J. Optical Society of America B, Vol. 19, 2002, pp. 753–764. [44] Booth, M. J., R. Juskaitis, and T. Wilson, “Spectral confocal reflection microscopy using a white light source,” J. European Optical Society Rapid Publication, Vol. 3, 2008, pp. 08026-1–6.
Chapter 14: Computational Optical Imaging Using the FDTD Method
359
[45] Winton, S. C., P. Kosmas, and C. M. Rappaport, “FDTD simulation of TE and TM plane waves at nonzero incidence in arbitrary layered media,” IEEE Trans. Antennas and Propagation, Vol. 53, 2005, pp. 1721–1728. [46] Capoglu, I. R., and G. S. Smith, “A Total-field / scattered-field plane-wave source for the FDTD analysis of layered media,” IEEE Trans. Antennas and Propagation, Vol. 56, 2008, pp. 158–169. [47] Zhang, L., and T. Seideman, “Rigorous formulation of oblique incidence scattering from dispersive media,” Physical Review B, Vol. 82, 2010, pp. 155117-1–15. [48] Nolte, A., J. B. Pawley, and L. Höring, “Non-Laser Light Sources for Three-Dimensional Microscopy,” in Handbook of Biological Confocal Microscopy, 3rd ed., J. B. Pawley, ed., Berlin: Springer, 2006. [49] Press, W. H., B. P. Flannery, S. A. Teukolsky, and W. T. Vetterling, Numerical Recipes in C: The Art of Scientific Computing, 2nd ed., Cambridge: Cambridge University Press, 1992. [50] Oppenheim, A. V., R. W. Schafer, and J. R. Buck, Discrete-Time Signal Processing, 2nd ed., Upper Saddle River, NJ: Prentice Hall, 1999. [51] Wojcik, G. L., J. Mould, R. J. Monteverde, J. J. Prochazka, and J. Frank, “Numerical simulation of thick line width measurements by reflected light,” in Integrated Circuit Metrology, Inspection and Process Control V, Proc. SPIE, Vol. 1464, 1991, pp. 187–203. [52] Erdmann, A., and P. Evanschitzky, “Rigorous electromagnetic field mask modeling and related lithographic effects in the low k1 and ultrahigh numerical aperture regime,” in J. Micro/ Nanolithography, MEMS and MOEMS, Proc. SPIE, Vol. 6, 2007, pp. 031002-1–16. [53] Haver, S. v., O. T. Janssen, J. J. Braat, A. J. E. M. Janssen, H. P. Urbach, and S. F. Pereira, “General imaging of advanced 3D mask objects based on the fully-vectorial Extended Nijboer-Zernike (ENZ) theory,” in Optical Microlithography XXI, Pts. 1–3, Proc. SPIE, Vol. 6924, 2008, pp. 69240U–1–8. [54] Mandel, L., “Intensity fluctuations of partially polarized light,” Proc. Physical Society of London, Vol. 81, 1963, pp. 1104–1114. [55] Tervo, J., T. Setälä, and A. T. Friberg, “Theory of partially coherent electromagnetic fields in the space-frequency domain,” J. Optical Society of America A, Vol. 21, 2004, pp. 2205–2215. [56] Totzeck, M., “Numerical simulation of high-NA quantitative polarization microscopy and corresponding near-fields,” Optik, Vol. 112, 2001, pp. 399–406. [57] Yang, S.-H., T. Milster, J. R. Park, and J. Zhang, “High-numerical-aperture image simulation using Babinet’s principle,” J. Optical Society of America A, Vol. 27, 2010, pp. 1012–1023. [58] Tanev, S., V. V. Tuchin, and J. Pond, “Simulation and modeling of optical phase contrast microscope cellular nanobioimaging,” in 15th International School on Quantum Electronics; Laser Physics and Applications, Proc. SPIE, Vol. 7027, 2008, pp. 702716-1–8. [59] Yee, K. S., “Numerical solution of initial boundary value problems involving Maxwell’s equations in isotropic media,” IEEE Trans. Antennas and Propagation, Vol. AP-14, 1966, pp. 302–307. [60] Taflove, A., “Application of the finite-difference time-domain method to sinusoidal steady-state electromagnetic penetration problems,” IEEE Trans. Electromagnetic Compatibility, Vol. 22, 1980, pp. 191–202. [61] Jin, J., The Finite Element Method in Electromagnetics, New York: Wiley, 2002. [62] Teixeira, F. L., and W. C. Chew, “Lattice electromagnetic theory from a topological viewpoint,” J. Mathematical Physics, Vol. 40, 1999, pp. 169–187. [63] Berenger, J.-P., “A perfectly matched layer for the absorption of electromagnetic waves,” J. Computational Physics, Vol. 114, 1994, pp. 185–200.
360
Advances in FDTD Computational Electrodynamics: Photonics and Nanotechnology
[64] Guerrieri, R., K. H. Tadros, J. Gamelin, and A. R. Neureuther, “Massively parallel algorithms for scattering in optical lithography,” IEEE Trans. Computer-Aided Design of Integrated Circuits and Systems, Vol. 10, 1991, pp. 1091–1100. [65] Wong, A. K., Rigorous Three-dimensional Time-domain Finite-difference Electromagnetic Simulation, Ph.D. thesis, University of California, Berkeley, 1994. [66] Wong, A. K., and A. R. Neureuther, “Mask topography effects in projection printing of phase-shifting masks,” IEEE Trans. Electron Devices, Vol. 41, 1994, pp. 895–902. [67] Wong, A. K., R. Guerrieri, and A. R. Neureuther, “Massively-parallel electromagnetic simulation for photolithographic applications,” IEEE Trans. Computer-Aided Design of Integrated Circuits and Systems, Vol. 14, 1995, pp. 1231–1240. [68] Pistor, T. V., K. Adam, and A. Neureuther, “Rigorous simulation of mask corner effects in extreme ultraviolet lithography,” J. Vacuum Science Technology B, Vol. 16, 1998, pp. 3449–3455. [69] Pistor, T. V., and A. Neureuther, “Extreme ultraviolet mask defect simulation,” J. Vacuum Science Technology B, Vol. 17, 1999, pp. 3019–3023. [70] Pistor, T. V., and A. R. Neureuther, “Calculating aerial images from EUV masks,” in Emerging Lithographic Technologies III, Pts 1 and 2, Proc. SPIE, Vol. 3676, 1999, pp. 679–696. [71] Brukman, M., Y. F. Deng, and A. Neureuther, “Simulation of EUV multilayer mirror buried defects,” in Emerging Lithographic Technologies IV, Proc. SPIE, Vol. 3997, 2000, pp. 799–806. [72] Pistor, T. V., Electromagnetic Simulation and Modeling with Applications in Lithography, Ph.D. thesis, University of California, Berkeley, 2001. [73] Azpiroz, J. T., Analysis and Modeling of Photomask Near-fields in Sub-wavelength Deep Ultraviolet Lithography, Ph.D. thesis, University of California, Los Angeles, 2004. [74] Adam, K., and A. R. Neureuther, “Methodology for accurate and rapid simulation of large arbitrary 2D layouts of advanced photomasks,” in 21st Annual Bacus Symposium on Photomask Technology, Pts 1 and 2, Proc. SPIE, Vol. 4562, 2002, pp. 1051–1067. [75] Tadros, K., A. R. Neureuther, and R. Guerrieri, “Understanding metrology of polysilicon gates through reflectance measurements and simulation,” in Integrated Circuit Metrology, Inspection, and Process Control V, Proc. SPIE, Vol. 1464, 1991, pp. 177–186. [76] Yin, X. M., A. Wong, D. Wheeler, G. Williams, E. Lehner, F. Zach, B. Kim, Y. Fukuzaki, Z. G. Lu, S. Credendino, and T. Wiltshire, “Sub-wavelength alignment mark signal analysis of advanced memory products,” in Metrology, Inspection, and Process Control for Microlithography XIV, Proc. SPIE, Vol. 3998, 2000, pp. 449–459. [77] Deng, Y. F., T. Pistor, and A. R. Neureuther, “Rigorous electromagnetic simulation applied to alignment systems,” in Optical Microlithography XIV, Pts 1 and 2, Proc. SPIE, Vol. 4346, 2001, pp. 1533–1540. [78] Furukawa, H., and S. Kawata, “Analysis of image formation in a near-field scanning optical microscope: Effects of multiple scattering,” Optics Commun., Vol. 132, 1996, pp. 170–178. [79] Vasilyeva, E., and A. Taflove, “Three-dimensional modeling of amplitude-object imaging in scanning near-field optical microscopy,” Optics Lett., Vol. 23, 1998, pp. 1155–1157. [80] Vasilyeva, E., and A. Taflove, “3-D FDTD image analysis in transmission illumination mode of scanning near-field optical microscopy,” in Proc. IEEE Antennas and Propagation Society International Symposium, Atlanta, GA, Vol. 4, 1998, pp. 1800–1803. [81] Simpson, S. H., and S. Hanna, “Analysis of the effects arising from the near-field optical microscopy of homogeneous dielectric slabs,” Optics Commun., Vol. 196, 2001, pp. 17–31.
Chapter 14: Computational Optical Imaging Using the FDTD Method
361
[82] Krug, J. T., E. J. Sanchez, and X. S. Xie, “Design of near-field optical probes with optimal field enhancement by finite difference time domain electromagnetic simulation,” J. Chemical Physics, Vol. 116, 2002, pp. 10895–10901. [83] Symons, W. C., K. W. Whites, and R. A. Lodder, “Theoretical and experimental characterization of a near-field scanning microwave (NSMM),” IEEE Trans. Microwave Theory and Techniques, Vol. 51, 2003, pp. 91–99. [84] Janssen, O. T., S. v. Haver, A. J. E. M. Janssen, J. J. Braat, P. Urbach, and S. F. Pereira, “Extended Nijboer-Zernike (ENZ) based mask imaging: Efficient coupling of electromagnetic field solvers and the ENZ imaging algorithm,” in Optical Microlithography XXI, Parts 1–3, Proc. SPIE, Vol. 6924, 2008, pp. 692410-1–9. [85] Haver, S. v., J. J. Braat, A. J. E. M. Janssen, O. T. Janssen, and S. F. Pereira, “Vectorial aerial-image computations of three-dimensional objects based on the extended Nijboer-Zernike theory,” J. Optical Society of America A, Vol. 26, 2009, pp. 1221–1234. [86] Liu, Q. H., “The pseudospectral time-domain (PSTD) method: A new algorithm for solutions of Maxwell’s equations,” in IEEE Antennas and Propagation Society International Symposium Digest, Montreal, Canada, Vol. 1, 1997, pp. 122–125. [87] Tseng, S. H., “Virtual optical experiment: Characterizing the coherent effects of light scattering through macroscopic random media,” Japan J. Applied Physics, Part 1, Vol. 46, 2007, pp. 7966–7969. [88] Wojcik, G. L., J. Mould, E. Marx, and M. P. Davidson, “Numerical reference models for optical metrology simulation,” in Integrated Circuit Metrology, Inspection, and Process Control VI, Proc. SPIE, Vol. 1673, 1992, pp. 70–82. [89] Vallius, T., and J. Turunen, “Electromagnetic models for the analysis and design of complex diffractive microstructures,” in ICO20: Optical Information Processing, Parts 1 and 2, Proc. SPIE, Vol. 6027, 2006, pp. 602704-1–4. [90] Besbes, M., J. P. Hugonin, P. Lalanne, S. v. Haver, O. Janssen, A. M. Nugrowati, M. Xu, S. F. Pereira, H. P. Urbach, A. Nes, P. Bienstman, G. Granet, A. Moreau, S. Helfert, M. Sukharev, T. Seideman, F. I. Baida, B. Guizal, and D. V. Labeke, “Numerical analysis of a slit-groove diffraction problem,” J. European Optics Society Rapid Publication, Vol. 2, 2007, pp. 07022-1–17. [91] Erdmann, A., T. Fuhner, F. Shao, and P. Evanschitzky, “Lithography simulation: Modeling techniques and selected applications,” in Modeling Aspects in Optical Metrology II, Proc. SPIE, Vol. 7390, 2009, pp. 739002-1–17. [92] Harrington, R. F., Time-Harmonic Electromagnetic Fields, New York: Wiley-IEEE Press, 2001. [93] Stratton, J. A., Electromagnetic Theory, New York: McGraw-Hill, 1941. [94] Kline, M., and I. W. Kay, Electromagnetic Theory and Geometrical Optics, Huntington, NY: Krieger Pub. Co., 1979. [95] Yeung, M. S., “Modeling high numerical aperture optical lithography,” in Optical/Laser Microlithography, Proc. SPIE, Vol. 922, 1988, pp. 149–167. [96] Yeung, M. S., D. Lee, R. Lee, and A. R. Neureuther, “Extension of the Hopkins theory of partially coherent imaging to include thin-film interference effects,” in Optical/Laser Microlithography VI, Proc. SPIE, Vol. 1927, pt. 1, 1993, pp. 452–463. [97] Totzeck, M., “Some similarities and dissimilarities of imaging simulation for optical microscopy and lithography,” in Proc. 5th International Workshop on Automatic Processing of Fringe Patterns, Berlin, Germany, 2006, pp. 267–274.
362
Advances in FDTD Computational Electrodynamics: Photonics and Nanotechnology
[98] Lee, R. T., and G. S. Smith, “An alternative approach for implementing periodic boundary conditions in the FDTD method using multiple unit cells,” IEEE Trans. Antennas and Propagation, Vol. 54, 2006, pp. 698–705. [99] Peterson, A. F., S. L. Ray, and R. Mittra, Computational Methods for Electromagnetics, New York: IEEE Press, 1998. [100] Maystre, D., and M. Neviere, “Electromagnetic theory of crossed gratings,” J. Optics, Vol. 9, 1978, pp. 301–306. [101] Bracewell, R. N., The Fourier Transform and Its Applications, 2nd ed., New York: McGraw-Hill, 1986. [102] Chen, K.-M., “A mathematical formulation of the equivalence principle,” IEEE Trans. Microwave Theory and Techniques, Vol. 37, 1989, pp. 1576–1581. [103] Balanis, C. A., Advanced Engineering Electromagnetics, New York: Wiley, 1989. [104] Umashankar, K., and A. Taflove, “A novel method to analyze electromagnetic scattering of complex objects,” IEEE Trans. Electromagnetic Compatibility, Vol. EMC-24, 1982, pp. 397–405. [105] Taflove, A., and K. Umashankar, “Radar cross section of general three-dimensional scatterers,” IEEE Trans. Electromagnetic Compatibility, Vol. EMC-25, 1983, pp. 433–440. [106] Yee, K. S., D. Ingham, and K. Shlager, “Time-domain extrapolation to the far field based on FDTD calculations,” IEEE Trans. Antennas and Propagation, Vol. 39, 1991, pp. 410–413. [107] Luebbers, R. J., K. S. Kunz, M. Schneider, and F. Hunsberger, “A finite-difference time-domain near zone to far zone transformation,” IEEE Trans. Antennas and Propagation, Vol. 39, 1991, pp. 429– 433. [108] Felsen, L. B., and N. Marcuvitz, Radiation and Scattering of Waves, Piscataway, NJ: IEEE Press, 1994. [109] Michalski, K. A., and J. R. Mosig, “Multilayered media Green’s functions in integral equation formulations,” IEEE Trans. Antennas and Propagation, Vol. 45, 1997, pp. 508–519. [110] Demarest, K., Z. Huang, and R. Plumb, “An FDTD near-to-far-zone transformation for scatterers buried in stratified grounds,” IEEE Trans. Antennas and Propagation, Vol. 44, 1996, pp. 1150–1157. [111] Martin, T., and L. Pettersson, “FDTD time domain near-to-far-zone transformation above a lossy dielectric half-space,” Applied Computational Electromagnetics Society J., Vol. 16, 2001, pp. 45–52. [112] Capoglu, I. R., and G. S. Smith, “A direct time-domain FDTD near-field-to-far-field transform in the presence of an infinite grounded dielectric slab,” IEEE Trans. Antennas and Propagation, Vol. 54, 2006, pp. 3805–3814. [113] Capoglu, I. R., Techniques for Handling Multilayered Media in the FDTD Method, Ph.D. thesis, Georgia Institute of Technology, 2007. [114] Bochkanov, S., and V. Bystritsky, “Computation of Gauss-Legendre quadrature rule nodes and weights,” August 2008. Online: http://www.alglib.net/integral/gq/glegendre.php [115] Kingslake, R., Lens Design Fundamentals, San Diego, CA: Academic Press, 1978. [116] Barrett, H. H., and K. J. Myers, Foundations of Image Science, New York: Wiley-Interscience, 2004. [117] Flagello, D. G., T. Milster, and A. E. Rosenbluth, “Theory of high-NA imaging in homogeneous thin films,” J. Optical Society of America A, Vol. 13, 1996, pp. 53–64. [118] Sheppard, C., “The optics of microscopy,” J. Optics A: Pure and Applied Optics, Vol. 9, 2007, pp. S1–S6.
Chapter 14: Computational Optical Imaging Using the FDTD Method
363
[119] Wolf, E., and Y. Li, “Conditions for the validity of the Debye integral-representation of focused fields,” Optics Communications, Vol. 39, 1981, pp. 205–210. [120] Li, Y., and E. Wolf, “Focal shift in focused truncated Gaussian beams,” Optics Commun., Vol. 42, 1982, pp. 151–156. [121] Bernard, D. A., and H. P. Urbach, “Thin-film interference effects in photolithography for finite numerical apertures,” J. Optical Society of America A, Vol. 8, 1991, pp. 123–133. [122] Török, P., P. Varga, Z. Laczik, and G. R. Booker, “Electromagnetic diffraction of light focused through a planar interface between materials of mismatched refractive indices: an integral representation,” J. Optical Society of America A, Vol. 12, 1995, pp. 325–332. [123] Török, P., and P. Varga, “Electromagnetic diffraction of light focused through a stratified medium,” Applied Optics, Vol. 36, 1997, pp. 2305–2312. [124] Van de Nes, A. S., L. Billy, S. F. Pereira, and J. J. Braat, “Calculation of the vectorial field distribution in a stratified focal region of a high numerical aperture imaging system,” Optics Express, Vol. 12, 2004, pp. 1281–1293. [125] Tang, X. G., F. H. Gao, Y. K. Guo, J. L. Du, S. J. Liu, and F. Gao, “Analysis and simulation of diffractive imaging field in thick film photoresist by using angular spectrum theory,” Optical Commun., Vol. 244, 2005, pp. 123–130. [126] Gamelin, J., R. Guerrieri, and A. R. Neureuther, “Exploration of scattering from topography with massively parallel computers,” J. Vacuum Science Technology B, Vol. 7, 1989, pp. 1984–1990. [127] Janssen, A. J. E. M., “Extended Nijboer-Zernike approach for the computation of optical pointspread functions,” J. Optical Society of America A, Vol. 19, 2002, pp. 849–857. [128] Braat, J., P. Dirksen, and A. J. E. M. Janssen, “Assessment of an extended Nijboer-Zernike approach for the computation of optical point-spread functions,” J. Optical Society of America A, Vol. 19, 2002, pp. 858–870. [129] Braat, J. J., P. Dirksen, A. J. E. M. Janssen, and A. S. Nes, “Extended Nijboer-Zernike representation of the vector field in the focal region of an aberrated high-aperture optical system,” J. Optical Society of America A, Vol. 20, 2003, pp. 2281–2292. [130] Braat, J. J., P. Dirksen, A. J. E. M. Janssen, S. v. Haver, and A. S. Nes, “Extended Nijboer-Zernike approach to aberration and birefringence retrieval in a high-numerical-aperture optical system,” J. Optical Society of America A, Vol. 22, 2005, pp. 2635–2650. [131] Braat, J. J., S. v. Haver, A. J. E. M. Janssen, and S. F. Pereira, “Image formation in a multilayer using the extended Nijboer-Zernike theory,” J. European Optical Society Rapid Publ., Vol. 4, 2009, pp. 09048-1–12. [132] Capoglu, I. R., “Angora: A free software package for finite-difference time-domain (FDTD) electromagnetic simulation,” Online: http://www.angorafdtd.org [133] Roden, J. A., and S. D. Gedney, “Convolution PML (CPML): An efficient FDTD implementation of the CFD-PML for arbitrary media,” Microwave & Optical Technology Lett., Vol. 27, 2000, pp. 334– 339. [134] Liu, Y., X. Li, Y. L. Kim and V. Backman, “Elastic backscattering spectroscopic microscopy,” Optics Lett., Vol. 30, 2005, pp. 2445–2447. [135] Fairchild, M. D., Color Appearance Models, New York: Wiley, 2005. [136] Oppenheim, A. V., A. S. Willsky and S. H. Nawab, Signals and Systems, Upper Saddle River, NJ: Prentice Hall, 1997.
364
Advances in FDTD Computational Electrodynamics: Photonics and Nanotechnology
[137] Capoglu, I. R., J. D. Rogers, A. Taflove, and V. Backman, “The microscope in a computer: Image synthesis from three-dimensional full-vector solutions of Maxwell’s equations at the nanometer scale,” Progress in Optics, Vol. 57, 2012, pp. 1–91.