stock solution and fi ll it up to 10 mL with H 2O to get 0.7 mM. 2. ... stock solution and fill it up to 10 mL with methanol to get 1.5 mM. GA. ..... Shake very gently! 10.
Chapter 16 Quantification of the Antioxidant Activity in Salt-Stressed Tissues Jelena J. Dragišic´ Maksimovic´ and Branka D. Živanovic´ Abstract Biochemical methods available for the measurement of antioxidant activity in salt-stressed tissues are reviewed, outlining the most important advantages and shortcomings of the methods. Here we consider commonly used methods for measuring total antioxidant capacity and phenolic content, ABTS and FolinCiocalteu’s procedure, respectively. Moreover, we presented assays for determination of antioxidant enzymes activities: superoxide dismutase, catalase, and ascorbate peroxidase. This choice of methods enables us to elucidate a full profile of antioxidant activities, evaluating their effectiveness against various reactive oxygen species produced during salt stress. Key words: Ascorbate peroxidase, Catalase, Protein concentration, Salinity, Superoxide dismutase, Total antioxidant capacity, Total phenolic content
1. Introduction Exposure of plants to salinity is known to induce formation of reactive oxygen species (ROS) that cause cell damage, but ROS also are involved in cell growth processes (1). ROS are normally derived from essential aerobic metabolisms and it is necessary to keep ROS at a certain physiological level to enable normal plant growth and development. In plant cells, ROS production occurs in almost all cell compartments (cytosol, chloroplast, and mitochondria), including the apoplast (2, 3). Production of ROS appears to be a general characteristic of expanding plant cells and organs (4– 6). The excess production of ROS during salt stress induced by different metabolic pathways with an ability to initiate cascade reactions results in the production of hydroxyl radical (OH•) and other reactive species, such as hydrogen peroxide (H2O2) and superoxide anion radical (O2•−) (7). To diminish the excess of ROS, Sergey Shabala and Tracey Ann Cuin (eds.), Plant Salt Tolerance: Methods and Protocols, Methods in Molecular Biology, vol. 913, DOI 10.1007/978-1-61779-986-0_16, © Springer Science+Business Media, LLC 2012
237
238
J.J.D. Maksimovic´ and B.D. Živanovic´
plants have developed an antioxidant defense system that comprises enzymatic and non-enzymatic components (7–9). Hence, ROS levels in cells need to be tightly balanced between ROS-scavenging and ROS-producing proteins (3). Multiple antioxidant enzymes that directly react with and scavenge ROS include superoxide dismutase (SOD), catalase (CAT), and various peroxidases (POD) such as ascorbate peroxidase (APX). SOD belongs to a family of metalloenzymes catalyzing the dismutation of O2•− into H2O2 and O2. This is the first reaction of ROS detoxification and hence a key component of the ROS-scavenging system (10, 11). The H2O2 produced is then scavenged by CAT and several classes of peroxidases. CATs are heme proteins that catalyze the removal of H2O2 into H2O and O2 (12). PODs are distributed throughout the cell and also catalyze the reaction of H2O2 detoxification (13). APX has high substrate specificity for ascorbic acid as electron donor and higher affinity for H2O2 than CAT (14). APX is found to be the primary scavenger of H2O2 in the chloroplast and cytosol of plant cells (15, 16). It has been demonstrated that the increase in activities of antioxidant enzymes could be the basis for salt stress tolerance in a range of plant species (1, 17–22). Moreover, the antioxidative response is well correlated with growth response and salt tolerance of cultivars, indicating a possible cross-talk between these two responses. It therefore seems that under salinity, plants compromise the need of ROS for growth to overcome the possible oxidative damage induced by salinity (4, 23, 24). The apoplastic ROS have been suggested to play a role in cell expansion via effects on cell-wall loosening (25) and cell-wall stiffening (26–28). In addition, ROS can serve as second messenger molecules and induce signal transduction leading to salt adaptation (7, 29). Temporal and spatial regulation of each antioxidative enzyme determines the competence of the antioxidant capacity under saline stress. Their quantitative and qualitative aspects of changes could be related to the levels of resistance to salinity. In order to develop practical strategies for selecting salt tolerant variety of potential crops, there is a pressing need to gain detailed information on whether changes in physiological/biochemical parameters due to salt stress are attributable to detrimental effects of salt stress or are components of the adaptation mechanism. On the other hand, a plant’s free radical-scavenging ability is attributed also to plant polyphenols. These are essential to plant physiology for their contribution to growth, reproduction, and resistance to biotic and abiotic stresses (30). Besides removing free radicals, these compounds are capable of chelating metal, activating antioxidant enzymes, and inhibiting oxidases (31). The reported data indicate that the content of phenolic compounds in plants can be changed by salt stress. This is critically dependent on the salt sensitivity of plants (32) and the level of salt stress (33). It has been proposed that flavonoids and polyphenolic compounds act as reducing agents either as enzyme co-factors or as electron
16
Quantification of the Antioxidant Activity in Salt-Stressed Tissues
239
donors (34, 35). Accumulation of these compounds could be pronounced in tissues under stress conditions. Thus, we present here combination of biochemical and analytical testing methods for quantification of the antioxidant activity in salt-stressed tissues. These methods could be additional tool for screening plants for salt tolerance.
2. Materials In all protocol steps use ultrapure water (H2O in the text, prepared by purifying deionized water to attain a sensitivity of 18 MΩ cm at 25°C) and analytical grade reagents. For the best results, all solution should be prepared directly before use and stored at 4°C during experiments. 2.1. Total Antioxidant Capacity and Phenolic Content Extraction Solution
Extraction solution consists of 70 mL of 80% methanol, 30 mL H2O, and 0.1 mL of concentrated hydrochloric acid.
2.2. Total Antioxidant Capacity Test Components
The reaction mixture for total antioxidant capacity (TAC) determination contains 2 mM ABTS (2,2-azino-bis-3-ethylbenzothiazoline-6-sulfonic acid diammonium salt), 15 μM hydrogen peroxide (H2O2), and 0.25 μM horse radish peroxidase (HRP) in 50 mM potassium phosphate buffer pH 7.5. 1. 50 mM potassium phosphate buffer. Dissolve 0.23 g KH2PO4 (MW 136.09 g/mol) and 0.58 g K2HPO4 (MW 174.18 g/mol) in 100 mL H2O. Adjust pH to 7.5 using 1 M KOH solution (dissolve 0.56 g KOH [MW 56.1056 g/mol] in 10 mL H2O). Phosphate buffer should be prepared directly before use and stored at 4°C. 2. 2 mM ABTS. Dissolve 0.11 g ABTS (MW 548.68 g/mol) (see Note 1) in 100 mL of phosphate buffer (see Note 2). 3. 15 μM H2O2. Prepare H2O2 solution, putting 1 μL of 30% H2O2 in 999 μL H2O. Store solution at 4°C in the dark. 4. 0.25 μM HRP. Dissolve 1.125 mg HRP (class II) in 1 mL H2O. Store solution at 4°C. 5. Preparing solution for the standard curve. For the standard curve, use set (0.1−0.8 mM) of standard solutions of L-ascorbic acid (AA) prepared from stock solution of 0.8 mM AA. Dissolve 0.014 g of AA (MW 176.1 g/mol) in 100 mL H2O to get 0.8 mM AA. Prepare the standard solutions from stock solution of AA, starting with 0.7 mM AA (use 8.75 mL of stock solution and fill it up to 10 mL with H2O to get 0.7 mM
240
J.J.D. Maksimovic´ and B.D. Živanovic´
AA), and subsequently make dilutions to complete the set of standard solutions of AA (0.6, 0.5, 0.4, 0.3, 0.2, 0.1 mM). 2.3. Total Phenolic Content Procedure Components
1. Preparing solution for the standard curve. Use gallic acid (GA) as a standard for the calibration curve (0.1, 0.5, 1, 1.5, 2 mM). Dissolve 0.034 g GA (MW 170.12 g/mol) in 100 mL of 80% methanol to prepare a stock solution (2 mM). Use 7.5 mL of stock solution and fill it up to 10 mL with methanol to get 1.5 mM GA. Diluting a stock solution with methanol in ratio 1:2, 1:4, and 1:20, prepare 1, 0.5, and 0.1 mM GA, respectively. 2. Folin-Ciocalteu reagent. Dissolve 12.5 mL 2 N Folin-Ciocalteu reagent in 100 mL H2O to get 0.25 N solution. Swirl to mix and incubate 5 min at room temperature (see Note 3). 3. 0.2 M sodium carbonate solution. Dissolve 0.572 Na2CO3·10H2O (MW 286.14 g/mol) in 10 mL of H2O.
2.4. Enzymatic Extracts Solution
g
Solution for tissue extraction consists of 50 mM potassium phosphate buffer (see recipe at Subheading 2.2) pH 7 containing following components (observing addition sequence): 1. 1 mM phenylmethanesulfonylfluoride (PMSF). Dissolve 0.017 g PMSF (MW 174.19 g/mol) in 100 mL of phosphate buffer (see Note 4). 2. 0.2 mM EDTA. Add 5.8 mg of EDTA (MW 292.24 g/mol) to the buffer (100 mL) (see Note 5). 3. 1 % polyvinylpyrrolidone (PVP) (w/v). Add 1 g of PVP 40 (average MW 40,000) to the buffer (100 mL) (see Note 6). 4. 0.1 % Triton X 100 (v/v). Add 100 μL to 100 mL buffer (see Note 7). The major APX in green tissue (leaves) are localized in chloroplast and has a very short life time in an ascorbate-depleted medium. So, for APX activity measurement of photosynthetic tissues, 5 mM ascorbate has to be added in extract solutions (dissolve 88 mg of ascorbate [MW 176.1 g/mol] in 100 ml of buffer).
2.5. Protein Concentration of Enzymatic Extracts
Bradford total protein assay (36) is used to determine the concentration of protein in a sample. 1. 50 mM potassium phosphate buffer pH 7. (see recipe in Subheading 2.2). 2. BSA (bovine serum albumin) standard solution preparation. Considering that the linear concentration range is 0.1– 1.4 mg/ml of protein, prepare a standard solution using BSA as the standard protein in a serial dilution series (100, 250, 500, 750, 1,000 mg/mL) in the same buffer as the samples to be assayed (see Note 8). To prepare BSA stock solution, measure 3 mg BSA and dissolve with 3 mL of buffer (see Note 9).
16
Quantification of the Antioxidant Activity in Salt-Stressed Tissues
241
Table 1 Preparing BSA standards for Bradford protein assay standard curve
Well designation Blank
BSA stock solution (mL)
Buffer (mL)
0
1,000
Standard 1 (100 μg/mL)
100
900
Standard 2 (250 μg/mL)
250
750
Standard 3 (500 μg/mL)
500
500
Standard 4 (750 μg/mL)
750
250
1,000
0
Standard 5 (1,000 μg/mL)
The total volume of each standard sample is 1 mL
To get dilution series for a standard curve, prepared stock solution dilute with buffer as outlined in Table 1. 3. Bradford reagent. Dissolve 100 mg Coomassie Brilliant Blue G-250 in 50 mL 95% ethanol, add 100 mL 85% (w/v) phosphoric acid. Dilute the Bradford reagent fivefold in H2O (1 part Bradford: 4 parts H2O) (see Note 10) when the dye has completely dissolved, and filter through filter paper just before use (see Note 11). Set the completed Bradford reagent aside and allow it to come to room temperature before use. 2.6. Reaction Solutions for Determination of Enzymes Activities
1. Reaction solutions for the total SOD activity. Among the different methods used for the assay of SOD in plant tissue homogenate, the xanthine–xanthine oxidase-ferricytochrome c method is the first and the most widely used method (37). (a) 50 mM potassium phosphate buffer + 0.1 mM EDTA. In 100 mL of potassium phosphate buffer (see recipe at Subheading 2.2) pH 7.8 add 2.9 mg EDTA (MW 292.24 g/mol). (b) Solution of 5 × 10⁻⁵ M xanthine. After preparing 1 mM NaOH (4 mg NaOH [MW 40 g/mol] in 100 mL of H2O), dissolve 0.76 mg of xanthine in 10 mL of prepared NaOH solution. (c) Solution of 6 × 10⁻⁹ M xanthine oxidase. In 1 mL of phosphate buffer, add 11 μL of xanthine oxidase (EC 1.1.3.22) commercial suspension from buttermilk (Grade I, 0.68 units/mg protein). (d) Solution of 10−5 M ferricytochrome c. Dissolve 2.4 mg cytochrome c (from horse heart, MW approx. 12,400 Da) in 1 mL of H2O. (e) Stock solution of 3 mM KCN. In 1 mL of prepared phosphate buffer, dissolve 2 mg of KCN (MW 65.12 g/mol).
242
J.J.D. Maksimovic´ and B.D. Živanovic´
2. Reaction solutions for the CAT activity. Among the numerous assays for catalase, the oldest and the simplest is the method in which the disappearance of peroxide is followed spectrophotometrically (38). (a) 50 mM potassium phosphate buffer. Phosphate buffer (see recipe in Subheading 2.2), adjust to pH 7. (b) 30 % H2O2. Adjust H2O2 volume to total volume to get the desired response. 3. Reaction solutions for the APX activity. We optimized the standard assay (39) by slightly changes of components concentrations: (a) 50 mM potassium phosphate buffer. Phosphate buffer (see recipe in Subheading 2.2) adjust to pH 7. (b) 0.1 M ascorbate. Dissolve 17.6 mg of ascorbate (MW 176.1 g/mol) in 1 mL of buffer (2 μL of this solution will give a final concentration of 0.2 mM ascorbate in a 1 mL cuvette). (c) 10 mM H2O2. Make a stock solution by addition of 1 μL of 30% H2O2 in 999 μL H2O (20 μL of this solution are going to give final concentration of 0.2 mM H2O2 in 1 mL cuvette).
3. Methods 3.1. Plant Tissue Extraction for Total Antioxidant Capacity and Phenolic Content
Homogenize plant tissue in extraction solution (see Note 12) at ratio of 1:5 (fresh weight: extraction solution). Add 5 mL of extraction solution (see Subheading 2.1) to 1 g of homogenized tissue, stir and transfer to plastic tubes. After centrifugation at 13,000 × g for 10 min at 4°C, supernatants are transferred to the new tubes to be used for further analyses (see Note 13). A minimum of three extractions must be prepared for each sample.
3.2. Total Antioxidant Capacity Test
Determination of TAC is done following the ABTS method (40). This compound is chosen because the enzyme (HRP) facilitates the reaction with hydrogen peroxide, turning it into a green endproduct: HRP ABTS + H 2 O 2 ⎯⎯⎯ → ABTS•+ + H 2 O
The pre-formed radical monocation (ABTS•+) is reduced in the presence of hydrogen-donating antioxidants (ascorbate, phenolics). During this reaction, the green ABTS•+ is converted back to its colorless neutral form in the reaction. This can easily be monitored with a spectrophotometer, 730 nm at 25°C for 5 min.
16
Quantification of the Antioxidant Activity in Salt-Stressed Tissues
243
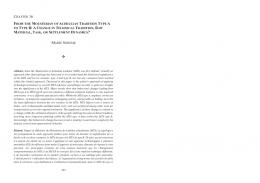
Fig. 1. Standard curve for total antioxidant capacity in millimolar of ascorbic acid equivalent per a gram of fresh weight (mM AA eq/g FW) using ABTS assay.
1. Standard curve for TAC. In the 1 mL cuvette, the reaction mixture (see Subheading 2.2) consists of 980 μL of ABTSbuffer solution, 1.55 μL H2O2, and 10 μL HRP until a stable absorbance is obtained due to ABTS radical formation. Afterwards, per 10 μL of different concentrations (0.1−0.8 mM, see Subheading 2.2) of ascorbic acid (AA) added for a standard curve set-up (Fig. 1). 2. Spectrophotometric analysis. Adding per 10 μL of methanolic extracts of plant tissue to the reaction mixture instead of ascorbic acid standards results in the absorbance decreasing as a consequence of ABTS radical depletion. Read absorbance alterations from the linear regression equation obtained from the standard curve at Fig. 1, where x = (y − 0.0105)/0.2595 (see Note 14). Results are expressed as millimolar of AA equivalent per gram of fresh weight (mM AA eq/g FW) (see Note 15). 3.3. Total Phenolic Content Procedure
The widely used method for the analysis of total phenolic content (TPH) in plant extracts is the Folin-Ciocalteu’s spectrophotometric procedure (41). Colorimetry is based on a chemical reduction of the reagent, a mixture of tungsten and molybdenum oxides. The products of the metal oxide reduction have a blue color that exhibits a broad light absorption with a maximum at 724 nm. The intensity of light absorption at that wavelength is proportional to the concentration of phenols. 1. Standard curve for TPH. Mix per 50 μL of GA calibration standards (see recipe in Subheading 2.3), 50 μL of samples, as well as blank (H2O) with 475 μL of 0.25 N Folin-Ciocalteu reagent (see recipe in Subheading 2.3) and incubate for a 3 min at room temperature. Afterwards, add 475 μL of 0.2 M sodium carbonate solution (see recipe in Subheading 2.3) and incubate for 60 min at constant room temperature. Modern measuring equipment allow for microscaling the reaction to the volume of a UV-Vis cuvette, reducing the cost of the reagent
244
J.J.D. Maksimovic´ and B.D. Živanovic´
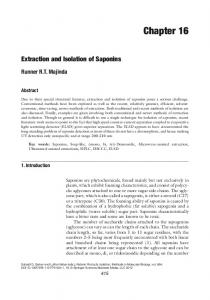
Fig. 2. Standard curve for total phenolic content in millimolar of gallic acid (GA) equivalent per gram of fresh weight (mM GA eq/g FW) obtained by Folin-Ciocalteu’s method.
and waste disposal, so samples can be run in 96-wells microplate reader. 2. Spectrophotometric analysis. Put per 200 μL of each GA calibration standard, sample, or blank into a plate wells and read them choosing a filter at 724 nm. Read absorbance alterations using the linear regression equation obtained from standard curve, Fig. 2, where x = (y − 0.0019)/0.3014 (see Note 14). Results are expressed as millimolar of GA equivalent per gram of fresh weight (mM GA eq/g FW) (see Note 16). 3.4. Plant Tissue Extraction for Enzymes Activities
Preparation of enzymatic extracts includes tissue homogenization (see Note 12) in extraction buffer (see recipe in Subheading 2.4) at a ratio of 1:5 (fresh weight:extraction buffer). Add 5 mL of extraction buffer (see Subheading 2.1) to 1 g of homogenized tissue, stir, and transfer to plastic tubes. After centrifugation at 13,000 × g for 10 min at 4°C, supernatants are transferred to the new tubes in order to be used for further spectrophotometric determination of enzymes activities (see Note 17). A minimum of three extractions must be prepared for each sample.
3.5. Determination of Protein Concentration in Enzymatic Extracts
Perform the Bradford total protein assay in a 96-well Micro plate Reader. In each well (see Note 18), put 200 μL of Bradford reagents (see recipe in Subheading 2.5). Afterwards add per 10 μL of BSA standards (see recipe in Subheading 2.5), samples, and blank. Read absorbance choosing an optical filter at 595 nm. Prepare the standard curve with the dependent variable (protein concentration—mg/mL) on the X axis and the independent variable (absorbance—595 nm) on the Y axis. Calculate the protein concentration of the experimental samples using the standard curve equation (see Note 19).
3.6. Determination of Enzymes Activities
1. Total SOD activity. SOD activities are assayed by their capacity to compete with native or partially succinylated ferricytochrome c for O2•− radicals generated by the xanthine/xanthine
16
Quantification of the Antioxidant Activity in Salt-Stressed Tissues
245
oxidase system. The reaction mixture contains sufficient xanthine oxidase (see recipe, Subheading 2.6) to produce an initial rate of ferricytochrome c reduction of ΔA550 nm = 0.025 ± 0.005 per min. In a total volume of 3 mL, put the following components (see recipe at Subheading 2.6): 300 μL xanthine, 150 μL xanthine oxidase, 150 μL cytochrome c, and 20 μL of control (H2O)/sample and fill it up to 3 mL with buffer + EDTA solution (see Note 20). Under these defined conditions, the amount of SOD required to inhibit the rate of reduction of cytochrome c by 50% in a coupled system at pH 7.8 at 25°C in a 3.0 mL reaction volume (i.e., to a rate of 0.0125 absorbance unit per min) is defined as 1 unit of activity. Calculations: %Inhibition =
ΔK − ΔA × 100 ΔK
Volume activity (Units/mL) = Enzyme activity (Units/mg) =
%Inhibition (50%)·(0.02)
Units/mL mg protein/mL
ΔK = Absorbance change in control 50% = Inhibition of the rate of cytochrome c reduction as per the Unit Definition 0.02 = Volume (in mL) of sample used Activities of different SOD forms are identified and measured using KCN (42) given that three forms of the enzyme are distinguished from each other, based on their sensitivity to cyanide (see Note 21). Add 10 μL of KCN stock solution (see recipe at Subheading 2.6) to 3 mL of reaction mixture (see Note 22). 2. CAT activity. CAT activity is a measure of the absorbance change (decreasing) at 240 nm as a consequence of H2O2 degradation (43). Adjust H2O2 volume to get an absorbance of 0.85 ± 0.02 absorbance units (see Note 23). Regulate the sample volume, depending on absorbance. One unit is defined as the amount of enzyme that decomposes 1 μmol of H2O2 per minute at pH 7.0 at 25°C. Calculations: Volume activity (Units/mL) = Enzyme activity (Units/mg) =
Δ AV · q 0.0436·Vs
Units/mL mg protein/mL
246
J.J.D. Maksimovic´ and B.D. Živanovic´
Vq = reaction volume in cuvette (in mL) 0.0436 = millimolar extinction coefficient of H2O2 at 240 nm (cm2/μmol) Vs = Volume (in mL) of sample used 3. APX activity. The hydrogen peroxide-dependent oxidation of ascorbate is followed by a decrease in the absorbance at 290 nm and 28°C. One milliliter of reaction mixture consists of 890 μL buffer, 2 μL ascorbate, and 30 μL sample (see recipe, Subheading 2.6). Record the reduction in ascorbate concentration by reading the absorbance continuously for 180 s after starting the reaction by adding 20 μL of H2O2 (see Note 24). One unit of APX activity is defined as the amount of enzyme that can oxidize 1 μmol of ascorbic acid per minute. Calculations: Volume activity (Units/mL) = Enzyme activity (Units/mg) =
ΔA·2·Vq 2.8·Vs
Units/mL mg protein/mL
Vq = reaction volume into cuvette (in mL) 2.8 = extinction coefficient (per mM cm)
of
ascorbate
at
290
nm
Vs = volume (in mL) of sample used
4. Notes 1. ABTS causes serious skin, eye, and respiratory irritation! To avoid exposure, wear a dust mask, eye shields, and gloves. 2. Considering that ABTS solution is temperature and light sensitive, it should be prepared fresh each day, protect from the light (use tinted glass or aluminum-foil), and stored on ice until use. Under these conditions, the solution shows essentially no change in absorbance over a few hours. 3. Folin-Ciocalteu reagent is light sensitive, so it should be protected from light (use tinted glass or aluminum-foil) and prepared at least 5 min before the first sample incubation. The time of the colorimetric reading is critical, and the temperature will affect the extent of the reaction and degradation. Thus, the incubation must not be more than 8 min and without any changes in room temperature. During preparation, wear protective clothing, gloves, and eye protection; this reagent could cause skin corrosion/irritation.
16
Quantification of the Antioxidant Activity in Salt-Stressed Tissues
247
4. PMSF is a serine protease inhibitor that is commonly used in protein solublization in order to deactivate proteases from digesting proteins of interest. That the half-life is short in aqueous solutions (110 min at pH 7 and 35 min at pH 8) is extremely important for experimental design. PMSF is considered a highly toxic inhibitor that could cause oral, dermal, and respiratory acute toxicity so requiring protective clothing, gloves, and a face mask. 5. EDTA is known to inhibit a range of metallopeptidases via the chelation of the metal ion required for catalytic activity. Since EDTA is an irritant (causes serious acute eye irritation), handle with gloves, safety glasses, and wash hands before and after use. Keep in suitable, closed containers for disposal. After EDTA addition, recheck pH! 6. PVP complexes with phenolics and alkaloids for their removal from plant samples, thus preventing the modification of proteins and any interference they may cause in spectrophotometric determinations of protein content. This is also reported to improve the stability of enzymes. May be harmful if inhaled, swallowed, or if absorbed through skin, and may cause eye irritation. Accordingly, use eye shields, gloves, and respirator filter, as well as a proper waste treatment method! PVP is readily soluble in cold water, so add PVP in cooled buffer slowly with slightly longer stirring. 7. Triton X100 is widely used non-ionic surfactant for solubilize membrane proteins under mild non-denaturing conditions. Harmful if swallowed; risk of serious damage to eyes. Wear protective gloves and glasses. Like any viscous material, pipette very slowly. Triton X100 is a high-foaming surfactant and therefore can produce many bubbles. Extremely slow stirring needs to be exercised during its use to avoid generating bubbles. Ordinarily, 0.5−1% Triton X is used, but taking into account that the Bradford assay is inhibited by the presence of detergents, we recommended 0.1%. This has no effect on assay results. 8. A standard curve is a plot of absorbance vs. a varying known protein concentration. A common method to prepare a standard curve is to prepare various known protein concentrations as standards. As long as the volume of the standard samples and the unknown samples are the same, the final concentration of the unknown is directly calculated from the least squares line of the standard curve. Always run samples in duplicate or triplicate and use the averages in the graph (to involve pipetting error). Finally, with every assay a “blank” must be included. The blank or the tube without a standard protein is usually made up in the same buffer as in the samples. The “blank” is used to set the instrument to the 100% transmittance or 0 absorbance.
248
J.J.D. Maksimovic´ and B.D. Živanovic´
9. Shake very gently! 10. Final volume depends on number of standards and samples (200 μL for each). 11. The Bradford reagent should be a light brown in color. Filtration may have to be repeated to remove the reagent of blue components. This “homemade” reagent works quite well, but is usually not as sensitive as the commercial one. 12. For effective disruption and homogenization, grind plant tissue in a mortar with pestle, using liquid nitrogen. Liquid nitrogen should be handled with care, following safety procedures. When fresh tissue is crushed into a paste, add an extraction medium. For rapidly and effortlessly tissue disruption, a tissue homogenizer, blender, or ultrasonic bath (Sonicator) could be used. 13. If the samples are not going to be used immediately after preparing, they should be stored at −20°C. 14. Be careful to enter the proper sign for the y intercept value as it may be a negative number! During fresh weight scaling, a dilution factor (5×) must be included in the calculation. 15. Results could be expressed as milligram of ascorbic acid equivalent per a gram of fresh weight (mg asc eq/g FW), when using masses of ascorbic acid (instead of molarities) for preparation of standard solutions. 16. Results could be expressed as milligram of gallic acid equivalent per a gram of fresh weight (mg GA eq/g FW), when using masses of gallic acid (instead of molarities) for preparation of standard solutions. 17. If the samples are not going to be used immediately after preparing, they should be stored at −80°C until analysis. 18. The numbers of wells depend on total number of blank, standards, and samples. 19. Results are expressed as mg of proteins per mL of extraction solution. Multiplying this number by the number of μL in the extraction solution, resulting in mg of proteins per gram of fresh weight. 20. If a higher amount of SOD (from samples) is required, increase the sample volume at the expense of buffer volume reducing. 21. While the Cu-Zn enzyme is sensitive to cyanide, the Fe and Mn enzymes are not. On the other hand, the Cu-Zn and Fe enzymes are inhibited by H2O2, whereas the Mn enzyme is H2O2-resistant. Therefore, only activity detected in KCNtreated samples is primarily Mn-SOD activity. Cu-Zn SOD activity can be determined by subtracting KCN-inhibited activity from the total SOD activity.
16
Quantification of the Antioxidant Activity in Salt-Stressed Tissues
249
22. Addition of KCN stock solution requires buffer volume adjustment. 23. Use more H2O2 to increase or less to decrease the absorbance. Since the diluted H2O2 solution is stable for a maximum of 2 h, we recommend not to prepare a solution, but to mix with buffer directly into the cuvette immediately before measurement. 24. For calculation, use 30 s in linear range.
Acknowledgment This work was supported by the Serbian Ministry of Education and Science (grants 173028 and 173040). References 1. Bernstein N, Shoresh M, Xu Y et al (2010) Involvement of the plant antioxidative response in the differential growth sensitivity to salinity of leaves vs roots during cell development. Free Radic Biol Med 49:1161–1171 2. Mittler R (2002) Oxidative stress, antioxidants and stress tolerance. Trends Plant Sci 9:405–410 3. Mittler R, Vanderauwera S, Gollery M et al (2004) Reactive oxygen gene network of plants. Trends Plant Sci 9:490–498 4. Foreman J, Demidchik V, Bothwell JHF et al (2003) Reactive oxygen species produced by NADPH oxidase regulate plant cell growth. Nature 422:442–446 5. Peleg-Grossman S, Volpin H, Levine A (2007) Root hair curling and Rhizobium infection in Medicago truncatula are mediated by phosphatidylinositide-regulated endocytosis and reactive oxygen species. J Exp Bot 58:1637–1649 6. Potocký M, Jones MA, Bezvoda R et al (2007) Reactive oxygen species produced by NADPH oxidase are involved in pollen tube growth. New Phytol 174:742–751 7. Dat J, Vandenabeele S, Vranová E et al (2000) Dual action of the active oxygen species during plant stress responses. Cell Mol Life Sci 57:779–795 8. Munns R (2005) Genes and salt tolerance: bringing them together. New Phytol 167:645–663 9. Munns R, Tester M (2008) Mechanisms of salinity tolerance. Annu Rev Plant Biol 59:651–681
10. Fridovich I (1986) Superoxide dismutases. Adv Enzymol Relat Areas Mol Biol 58:62–97 11. Fridovich I (1995) Superoxide radical and superoxide dismutases. Annu Rev Biochem 64:97–112 12. Willekens H, Inzé D, Van Montagu M et al (1995) Catalases in plants. Mol Breed 1:207–228 13. Welinder KG (1992) Superfamily of plant, fungal and bacterial peroxidases. Curr Opin Struct Biol 2:388–393 14. Mittler R, Poulos TL (2005) Ascorbate peroxidase. In: Smirnoff N (ed) Antioxidants and reactive oxygen species in plants. Blackwell, Oxford 15. Jespersen HM, Kjaersgard IV, Ostergaard L et al (1997) From sequence analysis of three novel ascorbate peroxidases from Arabidopsis thaliana to structure, function and evolution of seven types of ascorbate peroxidase. Biochem J 326:305–310 16. Zamocky M, Janecek S, Koller F (2000) Common phylogeny of catalase-peroxidases and ascorbate peroxidases. Gene 256: 169–282 17. Hernandez JA, Ferrer MA, Jimenez A et al (2001) Antioxidant systems and O2.−/H2 O2 production in the apoplast of pea leaves. Its relation with salt-induced necrotic lesions in minor veins. Plant Physiol 127:817–831 18. Gómez JM, Hernández JA, Jiménez A et al (1999) Differential response of antioxidative enzymes of chloroplasts and mitochondria to long-term NaCl stress of pea plants. Free Radic Res 31:s11–s18
250
J.J.D. Maksimovic´ and B.D. Živanovic´
19. de Azevedo Neto AD, Prisco JT, Eneas-Filho J et al (2006) Effect of salt stress on antioxidative enzymes and lipid peroxidation in leaves and roots of salt-tolerant and salt-sensitive maize genotypes. Environ Exp Bot 56:87–94 20. Singh MP, Singh DK, Rai M (2007) Assessment of growth, physiological and biochemical parameters and activities of antioxidative enzymes in salinity tolerant and sensitive basmati rice varieties. J Agron Crop Sci 193: 398–412 21. Kim SY, Lim JH, Park MR et al (2005) Enhanced antioxidant enzymes are associated with reduced hydrogen peroxide in barley roots under saline stress. J Biochem Mol Biol 38:218–224 22. Bustos D, Lascano R, Villasuso AL et al (2008) Reductions in maize root-tip elongation by salt and osmotic stress do not correlate with apoplastic O2•− levels. Ann Bot 102:551–559 23. Rodr guez AA, Grunberg KA, Taleisnik EL (2002) Reactive oxygen species in the elongation zone of maize leaves are necessary for leaf extension. Plant Physiol 129:1627–1632 24. Walz C, Juenger M, Schad M et al (2002) Evidence for the presence and activity of a complete antioxidant defence system in mature sieve tubes. Plant J 31:189–197 25. Liszkay A, van der Zalm E, Schopfer P (2004) Production of reactive oxygen intermediates (O2•-, H2O2, and,OH) by maize roots and their role in wall loosening and elongation growth. Plant Physiol 136:3114–3123 26. Ogawa K, Kanematsu S, Asada K (1997) Generation of superoxide anion and localization of Cu Zn-superoxide dismutase in the vascular tissue of spinach hypocotyls: their association with lignification. Plant Cell Physiol 38:1118–1126 27. Córdoba-Pedregosa MC, Córdoba F, Villalba JM et al (2003) Differential distribution of ascorbic acid, peroxidase activity, and hydrogen peroxide along the root axis in Allium cepa L. and its possible relationship with cell growth and differentiation. Protoplasma 221:57–65 28. Córdoba-Pedregosa MC, Villalba JM, Córdoba F et al (2005) Changes in intracellular and apoplastic peroxidase activity, ascorbate redox status, and root elongation induced by enhanced ascorbate content in Allium cepa L. J Exp Bot 56:685–694 29. Miller G, Shulaev V, Mittler R (2008) Reactive oxygen signaling and abiotic stress. Physiol Plant 133:481–489
30. Bravo L (1998) Polyphenols: chemistry, dietary sources, metabolism, and nutritional significance. Nutr Rev 56:317–333 31. Heim KE, Tagliaferro AR, Bobilya DJ (2002) Flavonoid antioxidants: chemistry, metabolism and structure-activity relationships. J Nutr Biochem 13:572–584 32. Kim HJ, Fonseca JM, Choi JH et al (2008) Salt in irrigation water affects the nutritional and visual properties of romaine lettuce (Lactuca sativa L.). J Agric Food Chem 56:3772–3776 33. Yuan G, Wang X, Guo R et al (2010) Effect of salt stress on phenolic compounds, glucosinolates, myrosinase and antioxidant activity in radish sprouts. Food Chem 121:1014–1019 34. Yamasaki H, Sakihama Y, Ikehara N (1997) Flavonoid-peroxidase reaction as a detoxification mechanism of plant cells against H2O2. Plant Physiol 115:1405–1412 35. Pérez FJ, Villegas D, Mejia N (2002) Ascorbic acid and flavonoid-peroxidase reaction as a detoxifying system of H2O2 in grapevine leaves. Phytochemistry 60:573–580 36. Bradford MM (1976) A rapid and sensitive method for the quantitation of microgram quantities of protein utilizing the principle of protein-dye binding. Anal Biochem 72: 248–254 37. McCord JM, Fridovich I (1969) Superoxide dismutase: an enzymic function for erythrocuprein (hemocuprein). J Biol Chem 244: 6049–6055 38. Beers RF, Sizer IW (1952) A spectrophotometric method for measuring the breakdown of hydrogen peroxide by catalase. J Biol Chem 195:133–140 39. Nakano Y, Asada K (1981) Hydrogen peroxide is scavenged by ascorbate specific peroxidase in spinach chloroplast. Plant Cell Physiol 22:867–880 40. Arnao MB, Cano A, Acosta M (1999) Methods to measure the antioxidant activity in plant material. A comparative discussion. Free Radic Res 31:89–96 41. Singleton VL, Rossi JA Jr (1965) Colorimetry of total phenolics with phosphomolybdicphosphotungstic acid reagents. Am J Enol Viticult 16:144–158 42. Bridges SM, Salin ML (1981) Distribution of iron-containing superoxide dismutase in vascular plant. Plant Physiol 68:275–278 43. Aebi H (1983) Catalase. In: Bergmeyer HU (ed) Methods of enzymatic analysis, 2nd edn. Verlag Chemie, Weinheim