2011 IEEE International Parallel & Distributed Processing Symposium
Characterizing Task-Machine Affinity in Heterogeneous Computing Environments Abdulla M. Al-Qawasmeh1, Anthony A. Maciejewski1, Rodney G. Roberts3, and Howard Jay Siegel1,2 1
3
Department of Electrical and Computer Engineering 2 Department of Computer Science Colorado State University, Fort Collins, Colorado, USA
Department of Electrical and Computer Engineering Florida State University, Tallahassee, Florida, USA
{Abdulla.Al-Qawasmeh, aam, hj}@colostate.edu,
[email protected] It is common to arrange the estimated time to compute (ETC) of task types on machines in an ETC matrix. Entry (i, j) in the ETC matrix represents the ETC of task type i on machine j. The ETC values can be based on user supplied information, experimental data, or task profiling and analytical benchmarking (e.g., [1, 12, 13, 17, 19, 25, 26]). The determination of ETC values is a separate research problem; the assumption of such ETC information is a common practice in resource allocation research (e.g., [5, 7, 10, 13, 15, 17, 18, 22, 24]). An ETC value is the estimated time to compute a given task type on a given machine when it is run alone. Quantifying the heterogeneity of a heterogeneous computing (HC) environment is important and has multiple useful applications. Examples of such applications include, predicting the performance of HC environments [9], selecting appropriate heuristics to use in an HC environment based on its heterogeneity [3], “what-if studies” to identify the effect of adding/removing task types or machines from an HC system on its heterogeneity, and generating ETC matrices for simulation studies that span the entire range of heterogeneities [2]. The purpose of this paper is to provide heterogeneity measures that can be used as a standard way to compare different heterogeneous computing environments. Although characterizing the heterogeneity of HC environments is important, there has not been much research in this area. In [4, 6], methods for generating HC environments, based on ETC matrices, for simulation studies were proposed. The method in [4] has been used widely, e.g., in [8, 11, 14, 16]. However, these methods do not deal with the problem of characterizing the heterogeneity of existing HC environments. To the best of our knowledge there is no other research that deals with the problem of identifying standard measures for quantifying the heterogeneity of computing environments. There can be many methods to characterize the heterogeneity of an HC environment. In addition, the
Abstract—Many computing environments are heterogeneous, i.e., they consist of a number of different machines that vary in their computational capabilities. These machines are used to execute task types that vary in their computational requirements. Characterizing heterogeneous computing environments and quantifying their heterogeneity is important for many applications. In previous research, we have proposed preliminary measures for machine performance homogeneity and task-machine affinity. In this paper, we build on our previous work by introducing a complementary measure called the task difficulty homogeneity. Furthermore, we refine our measure of task-machine affinity to be independent of the task type difficulty measure and the machine performance homogeneity measure. We also give examples of how the measures can be used to characterize heterogeneous computing environments that are based on real world task types and machines extracted from the SPEC benchmark data. Keywords- heterogeneous; computing environments; task types; machines; matrix normalization; benchmarks
I.
INTRODUCTION
Many computing environments are heterogeneous, i.e., they consist of a number of different machines that vary in their computational capabilities. These machines are used to execute task types that vary in their computational requirements. Different task types can be better suited to different machine architectures. Further, while a machine A may be better than a machine B for one task type, it may not be better for another task type; performance is a function of the interaction of a machine’s capabilities and a task type’s requirements. In this paper, we use the term task type to refer to an executable program than can be run many times. A task is an instance of a task type that is executed once. This research was supported by the NSF under grant number CNS-0905399, and by the Colorado State University George T. Abell Endowment.
1530-2075/11 $26.00 © 2011 IEEE DOI 10.1109/IPDPS.2011.125
33
illustrate the motivation behind the measures that we have introduced in this paper and in [2]. Examples of HC environments, that are based on real world data from the SPEC benchmarks, are given in Section V. Section VI describes the special cases of HC environments for which the standard form matrix cannot be determined. Finally, conclusions are presented in Section VII.
measured value of the heterogeneity of the environment may vary widely depending on the methods used. Therefore, we are motivated to determine standard measures of heterogeneity. We have identified some properties that heterogeneity measures should have. These properties directed our choice of the heterogeneity measures. First, a heterogeneity measure should match intuition and common beliefs about heterogeneity. Second, it should not be affected by multiplying the ETC matrix by a scaling factor. This is because the ETC values can be represented in different time units (e.g., seconds vs. minutes). Third, when multiple measures are used to examine different aspects of heterogeneity, they should be as independent as possible of each other (i.e., we should be able to change the value of one of the measures independent of the others). There is no value of having two or more measures that are totally correlated. It would be sufficient to just use one of them. For example, if the standard deviation was used to represent the heterogeneity of a set of values, then there is no value of using the variance as another measure of heterogeneity because both measures will be totally correlated. In [2], we introduced two measures for characterizing the heterogeneity of computing environments. These measures are: machine performance homogeneity (MPH) and task-machine affinity (TMA). This paper builds on the research we have done in [2] and introduces a new complementary measure that represents the homogeneity of task types called task type difficulty homogeneity (TDH). This measure adds a new aspect of heterogeneity that will enable us to characterize a wider range of heterogeneous environments. In this paper, we have identified a computational procedure that puts a matrix, which represents an HC environment, in standard form. The standard form enables us to have the three independent heterogeneity measures: MPH, TDH, and TMA (satisfying the third property for heterogeneity measures). Putting the matrix in standard form also allows us to simplify the calculation of the TMA. In summary, the contributions of this paper are: a) to introduce a new measure that represents the homogeneity of task types, and that enables us to characterize wider ranges of heterogeneous environments, b) to determine a standard matrix form that keeps the three measures independent, and allows a simplified calculation of TMA, and c) to illustrate how the measures can be used to analyze some real world environments obtained from the SPEC benchmarks. The rest of the paper is organized as follows. Section II gives an overview of the research that we have done in [2]. The new complementary TDH measure is presented in Section III. In Section IV, we give examples of heterogeneous environments to
II.
OVERVIEW OF PREVIOUS RESEARCH
A. Overview In this section, we give a brief overview of the research done in [2]. We explain some of the concepts introduced in that paper and show how the two measures (MPH and TMA) are calculated. In addition, we give more examples to further illustrate the intuition behind the two measures. B. Estimated Computation Speed Matrix Another way of representing an HC environment is by using an estimated computation speed (ECS) matrix. The ECS matrix can be obtained from an ETC matrix by taking the reciprocal of each entry in the ETC matrix, i.e., ECS(i, j)
1/ETC(i, j).
(1)
Entry (i, j) of the ECS matrix represents the amount of task type i that can be completed in a unit time on machine j. Therefore, larger entries in the ECS matrix correspond to more powerful machines for a specific task type. In some HC environments, some machines may not be able to run specific task types because of specific task type requirements (e.g., specific architecture requirements or operating system requirements). In the ECS matrix, if task type i cannot run on machine j, then entry (i, j) will be equal to 0. The corresponding entry in the ETC matrix would be equal to ∞. Both the ETC and ECS matrices are nonnegative matrices. Although individual entries in the ECS matrix can be equal to 0, there cannot be columns with all 0 entries or rows with all 0 entries because both cases correspond to a machine that cannot execute any task type or a task type that cannot be executed on any machine, respectively. C. Machine Performance Homogeneity One way to measure the performance of a machine is by the sum of the values along the corresponding column in the ECS matrix. For example, the performance of machine 1 for the ECS matrix in Figure 1 is 17. Higher column sums correspond to machines with better performance for the given task types in the ECS matrix. The performance of machine j, MPj, for an ECS matrix with T task types is given by
34
measures more flexible, which enables them to be applied to a wide variety of environments. Therefore, the formula for calculating machine j’s performance, when weighting factors are used, can be generalized to
T
(2)
ECS(i, j) .
MPj = i=1
Clearly, if all the machines’ performances are equal, then we have a completely homogeneous computing environment in terms of machine performance. However, when the performances are not equal, there can be a number of different ways to combine the performance values to measure machine performance homogeneity (or heterogeneity). Let the machines of the ECS matrix be sorted in ascending order of their performance (i.e., the columns are ordered in ascending order of their sums). We define the machine performance homogeneity (MPH) measure to be equal to the average ratio of a machine performance to its next better performing machine, i.e., for an ECS matrix with M machines, MPH =
∑M-1 j=1 MPj ⁄MPj M
1
1
.
T
MPj
m2
m3
t1
6
10
20
t2
5
3
10
t3
3
5
13
t4
3
4
40
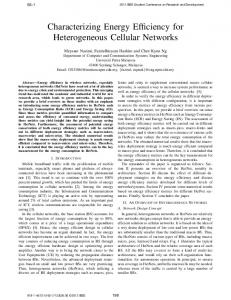
D. MPH Compared to Other Measures We compare MPH with other possible measures and show that MPH has the first property of a heterogeneity measure (i.e., it matches the intuition about heterogeneity) while the other measures do not have that property. Other possible measures include: 1) the ratio, R, of the performance of the lowest performance machine to that of the highest performance one, as a measure of homogeneity (i.e., higher values correspond to more homogeneous environments), 2) the geometric mean1, G, of the ratios of the performance of the lower performance machine to that of the higher performance machine in each pair of adjacent machines in the ECS matrix, as a measure of homogeneity, and 3) the coefficient of variation2, COV, of the machines’ performances, as a measure of heterogeneity. All of the above measures have the second property of a heterogeneity measure (i.e., they are not affected by scaling the performances by a common factor). Figure 2 shows four examples of possible machines’ performances of HC environments with five machines. Intuitively, environment 1 is the most heterogeneous because none of the machines performances are equal. Environments 2 and 3 have the same heterogeneity because they both have four machines with the same performance and the ratio of the performance of the most powerful machine and the performance of the least powerful one is 1/16. Environment 4 has three machines that have the same performance. Therefore, it is less heterogeneous than environment 1 and more heterogeneous that environments 2 and 3. In the figure, the values of each of the measures for each of the environments are given. The only measure that matches intuition is the MPH measure. Both measures, G and R, capture the heterogeneity between the highest performance machine and the lowest performance machine.
(3)
Figure 1. An example ECS matrix to illustate how machine performance is calculated.
1 2
(4)
i=1
The MPH of the ECS matrix in Figure 1 is 0.52. The weighting factor (wti) of task type i can be used to represent a number of characteristics (e.g., the importance of the task type, the number of times that a task type is executed, or the probability that a task type will be executed). Similarly, the weighting factor (wmj) of machine j can be used to represent a number of characteristics (e.g., security level of that machine). The weighting factors are incorporated in the equations for calculating each of the measures presented in this paper. These factors make the
m1
wti ECS(i, j).
w mj
/ The geometric mean of a set of n values ai is given by ∏ . The COV of a set of a set of n values ai with standard deviation S and mean μ is given by S/ μ.
35
However, they do not capture the spread of the performance of the intermediate machines.
which is quantified by the angle between the column vectors in the ECS matrix, represents task-machine affinity. For example, the angles between the columns in matrix (a) in Figure 3 are 0, which implies no task machine affinity. However, the angle between any pair of columns in matrix (b) in Figure 3 is greater than 0. The singular values, obtained from the singular value decomposition, of the normalized ECS matrix can be used to quantify the column correlation. Let σi denote the ith singular value of a normalized ECS matrix. For a normalized ECS matrix with T task types and M machines, there are min(T,M) singular values. The singular values are ordered such that
E. Task-Machine Affinity MPH represents one aspect of heterogeneity; however, it does not capture the case where various sets of task types are better suited to run on different sets of machines (i.e., task-machine affinity). For example, the two ECS matrices in Figure 3 are completely homogeneous in terms of machine performance. However, the machines in Figure 3(b) are heterogeneous in the sense that some of the machines are better suited to execute different sets of task types. Therefore, in order to represent this different aspect of heterogeneity we introduce the TMA measure. To keep the TMA independent of MPH, we normalize the ECS matrix by the column sums (which is equal to the 1-norm because the entries in the ECS matrix are non-negative) before calculating the TMA. The MPH of the normalized (and not weighted) ECS matrix is equal to 1. Intuitively, column correlation,
σ1 > σ2 >
For a given ECS matrix with normalized columns, a lower column correlation will correspond to larger values of the non-maximum singular values relative to σ1 and an intuitively higher value of TMA. Therefore, we use the following formula to calculate TMA:
Environment 1. 1, 2, 4, 8, 16 MPH = 0.5, R = 0.06, G = 0.5, COV = 0.88 Environment 2. 1, 1, 1, 1, 16 MPH = 0.77, R = 0.06, G = 0.5, COV = 1.5 Environment 3. 1,16, 16, 16, 16 MPH = 0.77, R = 0.06, G = 0.5, COV = 0.46 Environment 4. 1, 4, 4, 4, 16 MPH = 0.63, R = 0.06, G = 0.5, COV = 0.90
TMA=
III.
m2
m3
t1
20
20
20
t2
10
10
10
t3
5
5
5
m1
m2
m3
t1
5
10
20
t2
20
5
10
t3
10
20
5
∑min(T,M) σi i=2 min T,M 1
σ1 .
(5)
TASK DIFFICULTY HOMOGENEITY
A. Overview The difficulty of a task type is quantified by the sum of the ECS values of that task type over all machines (i.e., the corresponding row sum in the ECS matrix). Task types with higher row sums are considered less difficult. Because the difficulty of task types can vary widely, a measure of task type difficulty is needed. In this section, we present a measure for task type difficulty homogeneity (TDH) and show how it is calculated. In [2], we only used MPH and TMA as measures. Therefore, a simple column normalization procedure was sufficient to keep both measures independent. With the introduction of TDH, however, the 1-norm normalization procedure is not as straightforward due to the interactions between the column and the row normalizations. Therefore, we illustrate how an iterative normalization procedure can be used to find a row and column normalized ECS matrix that isolates the TMA from MPH and TDH. Let a standard ECS matrix be an ECS matrix with equal row sums and equal column sums. In addition to keeping the three measures independent, a standard ECS matrix allows us to simplify the TMA equation.
Figure 2. Machines’ performances of example HC environments.
m1
> σmin(T, M) > 0.
(a)
(b)
B. Calculating Task Difficulty Homogeneity The calculation procedure for TDH is similar to that of MPH. However, the homogeneity is calculated for task types (rows). Let TDi be the difficulty of task
Figure 3. An example ECS matrix to illustate how machine performance is calculated.
36
type i. The general formula for calculating task type difficulty, when weighting factors are used, is
Theorem 1. For a T M ECS matrix with positive elements, there are diagonal matrices D1 and D2 such that, for any nonzero scalar k, D1(ECS)D2 is a positive matrix whose rows each sum to Mk and whose columns each sum to Tk. Furthermore, D1 and D2 are unique up to scalar multiples. Sinkhorn provided an iterative procedure to obtain the required diagonal matrices and proved that the procedure converged. A similar iterative procedure is also applied in this work.
M
TD
wmj ECS(i, j).
wti
(6)
j=1
For the canonical ECS matrix, let both the machine performances and task difficulties be sorted in ascending order. Formally, the canonical form ECS matrix is a matrix where 1. MPj MPj 1 for 0 < j < M, and 2.
TD
TD
D. Simplified TMA Calculation The singular values of the standard ECS matrix are related to the column sums and row sums. The following theorem shows that for a specific choice of the row sums and the column sums the maximum singular value of the standard ECS matrix will always be 1. Theorem 2. For a T M ECS matrix with the property that each row sums to M⁄T and each column sums to T⁄M, the largest singular value is equal to 1. The proof of Theorem 2 is given in Appendix B. If we let k (in Theorem 1) be equal to 1/MT, then it follows that we can convert an ECS matrix to a standard one that has the column sums equal to T⁄M and the row sums equal to M⁄T. The maximum singular value of that standard ECS matrix will be equal to 1. This enables us to rewrite the TMA equation, presented in Section II-E, in the following simpler form
for 0 < i < T.
Following the same intuition behind MPH, we use a TDH measure that is equal to the average ratio of a task type difficulty to its next task type difficulty. The general TDH formula for a canonical ECS matrix is given by TDH=
∑T-1 i=1 TD ⁄TD T 1
.
(7)
Both, MPH and TDH take values in the interval (0, 1]. C. The Standard ECS Matrix For the TMA to be independent of MPH and TDH, the singular values must be computed from a standard ECS matrix where all the column sums are equal, and all the row sums are equal. In this section, we illustrate how such a standard ECS matrix can be computed from an ECS matrix with all positive elements, which we will refer to as a positive matrix. The problem of row and column normalization has appeared in other applications. For example, the requirement for row and column sum normalization occurs in the practical problem of estimating doubly stochastic matrices for certain types of Markov random processes. Motivated by this problem, Sinkhorn [21] proved that for any positive square matrix A, there are two diagonal matrices D1 and D2 such that D1AD2 is doubly stochastic. In other words, given any positive square matrix, one can suitably scale the individual rows and columns in such a way that each row and column sums to the same value. Furthermore, the diagonal matrices D1 and D2 are unique up to scalar multiplication. While Sinkhorn's theorem and its proof specifically apply to positive square matrices, the results can also, after suitable modifications, be used to convert a positive rectangular matrix through a series of row and column normalizations into a positive matrix with the property that the row sums are equal and the column sums are equal. This is illustrated in Appendix A. Hence, we have the following result.
min(T,M)
σi ⁄ min T,M
TMA=
(8)
1 .
i=2
We use an iterative procedure to normalize the ECS matrix. The iterative approach generates a series of ECSk matrices. The procedure switches between row normalization and column normalization until it converges to a row and column normalized matrix. The matrix ECSk is defined by
ECS
,
T⁄M ECSk i, j , k = 1,3,5,… ∑ ECSk q, j M⁄T ECSk i, j , k =2,4,6,… ∑ ECSk i, p
.
(9)
In cases where the ECS matrix contains zero-valued elements, the iteration defined by Equation 9 may not converge. This will be discussed further in Section VI.
37
IV.
produced by different manufacturers. Figure 5 shows the five different machines. Figures 6 and 7 show the peak runtime values of each of the five machines for the SPEC CINT2006Rate and SPEC CFP2006Rate benchmarks, respectively. Figure 8 shows two example 2 2 ETC matrices extracted from the values in Figures 6 and 7. The figures also show the values for each of the measures.
CONTRIVED ILLUSTRATIVE EXAMPLES
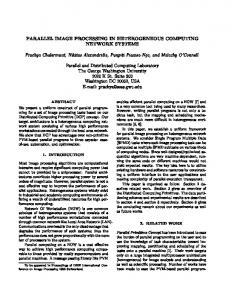
To further illustrate the intuition behind MPH, TDH, and TMA, we show, in Figure 4, some simple 2 2 ECS matrices and where they fall within the range of all possible values of the three measures. The examples have near extremal values for each of the measures. Entries with 0 values in the ECS matrix represent task types that cannot be executed on specific machines. Intuitively, matrices A, B, C and D all have a very high task-machine affinity because there is at least one task type that can only be executed on one machine (i.e., that task type has the highest affinity to the corresponding machine). The TMA measure reflects this intuition. All these matrices have a TMA value of 1. Matrix C is already a standard matrix. The second singular value of that matrix is 1. When the procedure in Equation 9 is applied to matrices A, B, and D they all converge to the standard form of C. In contrast, matrices E, F, G, and H all have no taskmachine affinity because the performance ratio of machines 1 and 2 is the same for both task types. The TMA value for these matrices is 0. Matrices C, D, G, and H are all nearly homogeneous in terms of machine performance. The performances of both machines are nearly homogeneous over both tasks. All the matrices have high MPH values. In contrast, matrices A, B, E, and F are all very heterogeneous in terms of machine performance. For all four matrices, the performance of machine 2 is much better than machine 1. These matrices have low MPH values. Matrices A, C, E, and G are all nearly homogeneous in terms of task type difficult. They have high TDH values. In contrast, the task types of matrices B, D, F, and H are all very heterogeneous. For all four matrices, task type 1 is much more difficult than task type 2. The four matrices have low TDH values. V.
EXAMPLE ECS MATRICES FROM SPEC BENCHMARKS
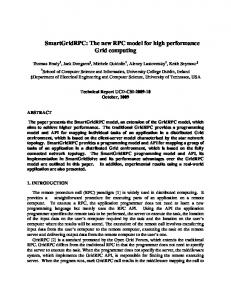
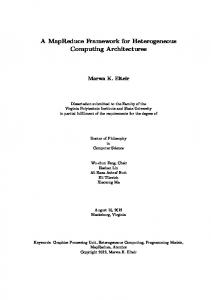
In this section, we show examples of ETC matrices extracted from the integer and floating point SPEC benchmarks (SPEC CINT2006Rate and SPEC CFP2006Rate) [23]. The matrices illustrate how environments constructed from real world task types and machines can have widely varying values for each of the measures proposed in this paper. Note that the benchmarks were used for illustration purposes only and the measures proposed in this paper can be applied to any HC environment that is represented by an ETC matrix. The SPEC CINT2006Rate consists of 12 task types. The SPEC CFP2006Rate consists of 17 task types. We have extracted the peak runtime values for five different machines. The machines have processors that have different architectures and are
Figure 4. Example extreme 2 2 ECS matrices with extremal values of each of the three measures: MPH, TDH, and TMA.
38
The two matrices are almost identical in terms of machine performance homogeneity. However, the task type difficulty and task-machine affinity of the two matrices vary. The task types of matrix (a) are more homogeneous than the ones of matrix (b). Because the ratios of the performances of the two machines of matrix (b) vary widely for each task type, the TMA value for that matrix is high. In contrast, the ratios of the performances of the two machines are very close for each of the task types of matrix (a). We also have calculated the values of the three measures for the entire CINT matrix and the entire CFP matrix. The values are shown in Figures 6 and 7. The machine performance homogeneity and the task type difficulty of both matrices are almost identical. However, for the floating point applications in the CFP matrix, task types have more affinity to machines than that of the integer applications in the CINT matrix. The iterative normalization procedure for the CFP and CINT matrices converged in 7 and 6 iterations, respectively. Every iteration consists of one column normalization followed by one row normalization. The procedure stops when the maximum error in any column or row norm is less than 1/108. The benchmarks presented in this section are for general purpose CPUs. We expect HC environments that consist of special purpose computing resources (e.g., accelerators and GPGPUs) and tasks that are better suited to run on these resources to have higher TMA values and lower TDH and MPH values. VI.
m1 = ASUS TS100-E6 (P7F-X) server system (Intel Xeon X3470) m2 = Fujitsu SPARC Enterprise M3000 m3 = CELSIUS W280 Intel Core i7-870 m4 = ProLiant SL165z G7 (2.2 GHz AMD Opteron 6174) m5= IBM Power 750 Express (3.55 GHz, 32 core, SLES) Figure 5. The five machines used from the SPEC benchmarks.
1 0 . 1
m3
m4
m5
974
627
563
1159
401.bzip2
971
1592
988
956
1363
403.gcc
642
1166
631
626
1026
429.mcf
267
946
266
463
416
445.gobmk
639
1124
642
719
957
456.hmmer
300
1698
205
391
920
458.sjeng
768
1756
779
912
1235
462.libquantum
537
686
548
431
523
464.h264ref
1082
1814
1092
1095
1804
471.omnetpp
557
1450
569
698
1850
473.astar
707
1235
714
699
1179
483.xalancbmk
414
758
415
414
793
TMA = 0.07
Figure 6. SPEC CINT2006Rate Data.
In the ECS matrix, it may be desirable to have entries equal to 0 that correspond to machines that cannot execute specific task types. However, when the ECS matrix has some entries that are equal to 0, the iterative normalization procedure described in Section III-C is not guaranteed to converge to a standard ECS matrix. Consider the following ECS matrix 0 1 0
m2
625
TDH = 0.90 MPH = 0.82
ISSUES WITH STANDARD FORM MATRICES
0 1 0
m1 400.perlbench
normalizations. Therefore, if there was a normalized version of this ECS matrix, each of the four nonzero elements must equal 1 so that the first and last row sums are 1 and the first two column sums are 1. However, this results in the original matrix, which is clearly not normalized due to the fact that, unlike the other row and column sums, the second row and third column sums are not equal to 1. The authors of [20] have presented a sufficient condition for a matrix to be row and column normalized. We summarize their results here. A square matrix A with non-negative elements is said to be decomposable if there are permutation matrices P and Q such that PAQ has the block form
(10)
In its current form, this matrix is not normalized because the second row and third column sums are both 2 while the other row and column sums are 1. It can be shown that there exists no combination of row and column normalizations to convert this matrix to a standard ECS matrix. To see this, observe that although row and column normalizations affect the values of the individual elements of the ECS matrix, zero-valued elements remain zero-valued elements and non-zero elements remain non-zero elements for any combination of row and column normalization. Consequently, those elements that are equal to 0 will remain 0 for any combinations of row and column
A11 A21
0 A22
(11)
where A11 and A22 are square matrices. In other words, a matrix A with non-negative elements is decomposable if one can reorder the rows and columns so as to obtain the above form. If one cannot do this, then the matrix is said to be fully
39
1 0 1
0 1 0
0 1 . 0
m1
m2
m3
m4
m5
410.bwaves
677
1776
664
1238
528
416.gamess
777
2701
778
1267
2522
433.milc
845
2210
851
1056
1104
434.zeusmp
694
1132
706
741
1034
435.gromacs
576
838
592
481
1061
436.cactusADM
859
1204
845
105
345
437.leslie3d
704
1507
711
1207
499
444.namd
657
979
678
648
789
447.dealII
589
893
596
518
764
450.soplex
509
1635
520
1018
441
453.povray
253
465
264
319
451
454.calculix
531
954
551
471
1227
459.GemsFDTD
855
2431
874
1420
1588
465.tonto
693
1122
724
626
1146
470.lbm
1102
1348
1150
892
940
481.wrf
964
1349
939
858
1621
The upper left 1 1 matrix is A11 and the lower right 2 2 matrix is A22 matrix. Note that while being indecomposable is a sufficient condition for being able to row and column normalize a positive matrix, it is not a necessary condition. This is illustrated by a diagonal matrix with positive elements on its diagonal. Such matrices are already in the decomposable form given in (11), but they can be easily converted into the identity matrix through row and column normalization to obtain the desired form. The case for rectangular matrices with nonnegative components is handled in a similar way. In this case, consider an m n matrix A with m < n (for the case when m > n, one can transpose, do the row and column normalizations, and transpose back). In this case, one says that A is fully indecomposable if every m m submatrix of A is fully indecomposable. In future work, we will investigate evaluating the TMA for ECS matrices that cannot be row and column normalized.
482.sphinx3
1694
2887
1668
1298
3148
VII. CONCLUSIONS
TDH = 0.91
In this paper, we introduced a new complementary measure of task type difficulty homogeneity (TDH). We have shown the motivation behind the TDH, MPH, and TMA measures through many illustrative examples and ones extracted from the SPEC benchmarks. In addition, we have demonstrated the importance of the measures for characterizing wider ranges of heterogeneous environments. We have also explained the importance of keeping the three measures independent and how, with the introduction of TDH, the column normalization procedure in [2] is not sufficient to keep the measures independent. Therefore, we illustrated how an iterative row and column normalization procedure can be used to keep the measures independent.
MPH = 0.83 TMA = 0.13.
Figure 7. SPEC CFP2006Rate Data.
m4
m5
TDH=0.16
471.omnetpp
698
1850
MPH=0.31
436.cactusADM
105
345
TMA=0.05
(a)
436.cactusADM 450.soplex
m1
m4
TDH=0.28
859
105
MPH=0.30
509 1018 (b)
TMA=0.60
(12)
ACKNOWLEDGMENTS
Figure 8. Example 2 2 ETC matrices extracted form the SPEC CINT2006Rate and CFP2006Rate benchmarks. The values for each of the measures are given for both matrices.
The authors thank Luis Briceño and Bhavish Khemka for their valuable comments on this work.
indecomposable. For any square matrix A with nonnegative elements that is fully indecomposable, there exists diagonal matrices D1 and D2 such that D1AD2 has equal row sums and equal column sums. An example of a simple matrix that fails the above condition is the matrix in Equation 10. This matrix is decomposable because it can be placed in the block form of Equation 11 by moving the last column to the front to obtain
REFERENCES [1]
[2]
40
S. Ali, T. D. Braun, H. J. Siegel, A. A. Maciejewski, N. Beck, L. Boloni, M. Maheswaran, A. I. Reuther, J. P. Robertson, M. D. Theys, and B. Yao, “Characterizing resource allocation heuristics for heterogeneous computing systems,” Advances in Computers Volume 63: Parallel, Distributed, and Pervasive Computing, 2005, pp. 91–128. A. M. Al-Qawasmeh, A. A. Maciejewski, and H. J. Siegel, “Characterizing heterogeneous envinronments
[3]
[4]
[5]
[6]
[7]
[8]
[9]
[10]
[11]
[12]
[13]
[14]
[15]
using singular value decomposition,” 19th Heterogeneous Computing Workshop (HCW 2010), 24th International Parallel and Distributed Processing Symposium, Workshops and PhD Forum (IPDPSW 2010), Apr. 2010. A. M. Al-Qawasmeh, A. A. Maciejewski, H. J. Siegel, J. Smith, and J. Potter, “Statistical measures for quantifying task and machine heterogeneity,” Supercomputing, accepted to appear. S. Ali, H. J. Siegel, M. Maheswaran, D. Hensgen, and S. Ali.,“Representing task and machine heterogeneities for heterogeneous computing systems,” Tamkang Journal of Science and Engineering, Special 50th Anniversary Issue, Vol. 3, No.3, Nov. 2000, pp.195– 207. H. Barada, S. M. Sait, and N. Baig, “Task matching and scheduling in heterogeneous systems using simulated evolution,” 10th heterogeneous Computing Workshop (HCW 2001), 15th IEEE International Parallel and Distributed Processing Symposium (IPDPS 2001), Apr. 2001. T. D. Braun, H. J. Siegel, N. Beck, L. Bölöni, R. F. Freund, D. Hensgen, M. Maheswaran, A. I. Reuther, J. P. Robertson, M. D. Theys, and B. Yao, “A comparison of eleven static heuristics for mapping a class of independent tasks onto heterogeneous distributed computing systems,” Journal of Parallel and Distributed Computing, Vol. 61, No. 6, Jun. 2001, pp. 810–837. L. Briceno, H. J. Siegel, A. Maciejewski, M. Oltikar, J. Brateman, J. White, J. Martin, and K. Knapp, “Heuristics for Robust Resource Allocation of Satellite Weather Data Processing onto a Heterogeneous Parallel System,” IEEE Transactions on Parallel and Distributed Systems, accepted to appear. L. Canon and E. Jeannot, Precise Evaluation of the Efficiency and the Robustness of Stochastic DAG Schedules, Research Report 6895, INRIA, April 2009. R. C. Chiang, A. A. Maciejewski, A. L. Rosenberg, and H. J. Siegel, "Statistical predictors of computing power in heterogeneous clusters," 19th Heterogeneous Computing Workshop (HCW 2010), 24th International Parallel and Distributed Processing Symposium, Workshops and PhD Forum (IPDPSW 2010), Apr. 2010. M. K. Dhodhi, I. Ahmad, and A. Yatama, “An integrated technique for task matching and scheduling onto distributed heterogeneous computing systems,” Journal of Parallel and Distributed Computing, Vol. 62, Sept. 2002, pp. 1338–1361. B. Eslamnour and S. Ali, “Measuring robustness of computing systems,” Simulation Modelling Practice and Theory, Vol. 17, No. 9, Oct. 2009, pp. 1457-1467. R. F. Freund and H. J. Siegel, “Heterogeneous processing,” IEEE Computer, vol. 26, June 1993, pp.13–17. A. Ghafoor and J. Yang, “A distributed heterogeneous supercomputing management system,” IEEE Computer, Vol. 26, No. 6, June 1993, pp. 78–86. D. Huang, Y. Yuan, L. Zhang, and K. Zhao, “Research on tasks scheduling algorithms for dynamic and uncertain computing grid based on a+bi connection number of SPA,” Journal of Software, Vol. 4, No 10, Dec 2009, pp. 1102-1109.
[16]
[17]
[18]
[19]
[20]
[21]
[22]
[23]
[24]
[25]
[26]
M. Kafil and I. Ahmad, “Optimal task assignment in heterogeneous distributed computing systems,” IEEE Concurrency, Vol. 6, No. 3, July 1998, pp. 42–51. S. U. Khan and I. Ahmad, “Non-cooperative, semicooperative, and cooperative games-based grid resource allocation,” 20th International Parallel and Distributed Processing Symposium, Apr. 2006. A. Khokhar, V. K. Prasanna, M. E. Shaaban, and C. Wang, “Heterogeneous computing: Challenges and opportunities,” IEEE Computer, Vol. 26, No. 6, June 1993, pp. 18–27. C. Leangsuksun, J. Potter, and S. Scott, “Dynamic task mapping algorithms for a distributed heterogeneous computing environment,” 4th IEEE Heterogeneous Computing Workshop (HCW 1995), Apr. 1995, pp. 30–34. M. Maheswaran, T. D. Braun, and H. J. Siegel, “Heterogeneous distributed computing,” Encyclopedia of Electrical and Electronics Engineering, vol. 8, JohnWiley, NY, 1999, pp. 679–690. A. W. Marshall and I. Olkin, “Scaling of Matrices to Achieve specified row and column sums,” Numerische Mathematik, Vol. 12, No. 1, 1968, pp. 83-90. R. Sinkhorn, “A relationship between arbitrary positive matrices and doubly stochastic matrices,” The Annals of Mathematical Statistics, Vol. 35, No. 2 Jun. 1964, pp. 876-879. H. Singh and A. Youssef, “Mapping and scheduling heterogeneous task graphs using genetic algorithms,” 5th IEEE Heterogeneous Computing Workshop (HCW ’96), 1996, pp. 86–97. Standard performance evaluation corporation (SPEC), Benchmarks, http://www.spec.org, accessed January 12, 2011. D. Xu, K. Nahrstedt, and D. Wichadakul, “QoS and contentionaware multi-resource reservation,” Cluster Computing, Vol. 4, No. 2, Apr. 2001, pp. 95–107. J. Yang, I. Ahmad, and A. Ghafoor, “Estimation of execution times on heterogeneous supercomputer architectures,” International Conference on Parallel Processing, vol. I, Aug. 1993, pp. 219–225. J. Yang, A. Khokhar, S. Sheikh, and A. Ghafoor, “Estimating execution time for parallel tasks in heterogeneous processing (HP) environment,” Heterogeneous Computing Workshop, pp.,23-28, Apr. 1994.
APPENDIX A Theorem 1 can be restated using standard matrix notation as: Theorem A. Let A be an m n matrix with positive elements and let k be a given nonzero scalar. Then there exists an m m diagonal matrix D1 and an n n diagonal matrix D2 such that the matrix D1AD2 has the property that each of its rows sums to nk and each of its columns sums to mk. Furthermore, D1 and D2 are unique up to a scalar multiple. Proof. For simplicity, we will prove the result for a 2 3 matrix A. The general m n case readily follows using the same approach. Consider a 3 2 array of A matrices given by the partitioned matrix
41
A A A A . A A
A
with a corresponding input singular T ⁄ vector v = 1 √n [1 1] and output singular vector u 1⁄√m [1 1]T, respectively. Furthermore, if the matrix is scaled so that = n⁄m and m⁄n, then the largest singular value is equal to 1. Proof. The equality mr = nc follows from the fact that both values are equal to the sum of the mn elements of A. The fact that √rc is a singular value with corresponding input and output singular vectors v = 1⁄√n [1 1]T and u 1⁄√m [1 1]T , respectively, readily follows from the facts that mr = nc, √rc . √rc , and T To show that √rc is in fact the largest singular value, suppose that w is an input singular vector associated with the largest singular value. This means that w is a unit vector that maximizes ||Aw|| over the set of all unit n-vectors. We claim that we can assume that the components of w are non-negative. Obviously, we can assume that at least one component of the unit vector w is positive since either w or –w can serve as the input singular vector. Suppose that w has at least one positive and at least one negative component. Since A is a matrix with non-negative elements, each component of the vector Aw is a non-negative combination of the components of w. Hence, changing the signs of all the negative components of w will not decrease the magnitudes of the individual components of Aw and will not change the norm of w. We thus obtain another unit vector z, whose components are equal to the absolute values of the corresponding components of w, with the property that ||Az|| > ||Aw||. By the assumption that ||Aw|| is the largest value over all unit n-vectors, we conclude that the value ||Az|| = ||Aw|| is the largest singular value of A and that the resulting vector z is an input singular vector associated with the largest singular value. We then take the resulting vector z as our new vector w so that the components of w are non-negative. Now if the largest singular value is different than √rc, then the input singular vectors w and v must be orthogonal. However, this is impossible as the dot product of w and v is clearly positive. We thus conclude that √rc is the largest singular value. The last part of the theorem is obtained by applying an appropriate scaling to the matrix A. ■
Applying Sinkhorn's theorem to this 6 6 positive matrix, one obtains 6 6 diagonal matrices E and F such that
M
M M M
EAF
M M M
is a positive matrix whose rows and columns sum to 1. The diagonal matrices E and F can be written as E = diag(E1, E2, E3) and F = diag(F1, F2) where E1, E2, and E3 are 2 2 diagonal matrices and F1 and F2 are 3 3 diagonal matrices. Consider now the 6 3 matrix
M
M M M
M M M
M M M M M M
M M M
where M M M for i = 1, 2, 3. Like M, the six rows of M each sum to 1 but the three columns of M each sum to 2 instead as each column of M is a sum of two columns of M. Next, consider the 2 3 matrix M M M M . The column sums of M match the column sums of M while the row sums of M are given by adding the corresponding rows sums of M , M , and M . Hence, each row of M has a sum of 3 and each column has a sum of 2. Next, note that M ∑ ∑j Mij . Because Mij E AF , we have . j
∑ Ei and ∑ Fj results in Setting two diagonal matrices D1 and D2 such that M = D1AD2 has row sums equal to 3 and column sums equal to 2. Lastly, scaling either D1 or D2 by k gives the desired result. The fact that E = diag(E1, E2, E3) and F = diag(F1, F2) are unique up to a scalar multiple implies the same for D1 and D2. Extending the same approach to the m × n case is now obvious. ■
BIOGRAPHIES
APPENDIX B
Abdulla M. Al-Qawasmeh received his B.S. in Computer Information Systems from the Jordan University of Science and Technology in 2005. He received his M.S. in Computer Science from the University of Houston Clear Lake in 2008. Since August, 2008 he has been a Ph.D. student in Computer Engineering and a Graduate Research
As in Appendix A, Theorem 2 is restated using standard matrix notation. Theorem B. Let A be an m n matrix with nonnegative elements with the property that each row sums to r and each column sums to c. Then mr = nc, and the largest singular value of A is √rc
42
Assistant at Colorado State University. His research interests include robust heterogeneous computing systems and resource management in heterogeneous computing systems. Anthony A. Maciejewski received the B.S., M.S., and Ph.D. degrees in Electrical Engineering in 1982, 1984,and 1987, respectively, all from The Ohio State University. From 1988 to 2001, he was a Professor of Electrical and Computer Engineering at Purdue University. In 2001, he joined Colorado State University where he is currently the Head of the Department of Electrical and Computer Engineering. He is a Fellow of IEEE. A complete vita is available at www.engr.colostate.edu/~aam. Rodney G. Roberts received B.S. degrees in Electrical Engineering and Mathematics from Rose– Hulman Institute of Technology in 1987 and the M.S.E.E. and Ph.D. degrees in Electrical Engineering from Purdue University in 1988 and 1992, respectively. From 1992 to 1994, he was a National Research Council Fellow at Wright–Patterson Air Force Base, Dayton, OH. Since 1994, he has been with the Florida A&M University–Florida State University College of Engineering, where he is currently a Professor of Electrical and Computer Engineering. H. J. Siegel was appointed the Abell Endowed Chair Distinguished Professor of Electrical and Computer Engineering at Colorado State University (CSU) in 2001, where he is also a Professor of Computer Science and Director of the CSU Information Science and Technology Center (ISTeC). From 1976 to 2001, he was a professor at Purdue University. Prof. Siegel is a Fellow of the IEEE and a Fellow of the ACM. He received a B.S. degree in electrical engineering and a B.S. degree in management from the Massachusetts Institute of Technology (MIT), and the M.A., M.S.E., and Ph.D. degrees from the Department of Electrical Engineering and Computer Science at Princeton University. He has co-authored over 380 technical papers. His research interests include robust computing systems, resource allocation in computing systems, heterogeneous parallel and distributed computing and communications, parallel algorithms, and parallel machine interconnection networks. He was a Coeditor-in-Chief of the Journal of Parallel and Distributed Computing, and has been on the Editorial Boards of both the IEEE Transactions on Parallel and Distributed Systems and the IEEE Transactions on Computers. He has been an international keynote speaker and tutorial lecturer, and has consulted for industry and government. For more information, please see www.engr.colostate.edu/~hj.
43