Enhanced Forest Inventory: Western Update (Where we came from, where we are now, where we are going) Joanne White and Mike Wulder Canadian Forest Service, Pacific Forestry Centre, Victoria BC
2
Acknowledgements CFS/CWFC: Roger Whitehead, Geordie Hobart Gordon Frazer, Jim Stewart, Doug Pitt UBC: Nicholas Coops, Piotr Tompalski, Thomas Hilker, Chris Bater, Martin van Leeuwen Industry: Glenn Buckmaster (HWP), Mike Davis (WFP) Beyond: Mikko Vastaranta, Christoph Stepper, Bruce Cook, Murray Woods
3
In the beginning… Wood fiber quality modelling was the focus Integrated Wood Properties Trend Assessment program (Weldwood)
Hinton Wood Products (West Fraser) received LiDAR data from GoA in 2008 van Leeuwen, M., Hilker, T., Coops, N.C., Frazer, G.W., Wulder, M.A., Newnham, G.J., Culvenor, D.S. 2011. Assessment of standing wood and fiber quality using ground and airborne laser scanning: A review. Forest Ecology and Management, 261: 1467–1478. Hilker, T., Frazer, G.W., Coops, N.C., Wulder, M.A., Newnham, G.J., Stewart, J.D., van Leeuwen, M., Culvenor, D.S. 2013. Prediction of wood fiber attributes from lidar-derived forest canopy indicators. Forest Science, 59(2): 231–242.
Airborne LiDAR metrics explained about half the observed variance in intrinsic wood fiber attributes (510% less than growth-related field measurements). Difference is offset by broader spatial coverage of LiDAR
4
Hinton Forest Management Area • Hinton Wood Products, West Fraser Mills • ~1 million ha; est. 1951 • Pure coniferous: 80% by area • Lodgepole pine: 65% by volume Data: • •
Lidar: ~1 point/m2 735 ground calibration plots
Enhanced forest inventory (2011): • • •
58 grid cell metrics (FUSION; 25 m) Non-parametric, by forest type (C,D,M) Attributes: • Height (top, mean, 75th) • QMD, BA • Volume (merchantable, total) • Biomass (total)
5
Validation: Volume • Weight-scaled volume from 272 cut blocks harvested since LiDAR acquisition
• Compared volume estimates from EFI to Cover Type Volume Table (CVT) estimates • CVT underestimated volume by an average of 19.8% and EFI overestimated volume by 0.6% White, J.C., Wulder, M.A., Buckmaster, G. 2014. Validating estimates of merchantable volume from airborne laser scanning (ALS) data using weight scale data. The Forestry Chronicle, 90: 378–385.
6
Data acquisition: leaf-on vs. leaf-off • Leaf-off models provided comparable results to leaf-on models for both coniferous and deciduous forest types • Mixing of leaf-on models and leaf-off data (and vice versa) result in large RMSE and bias and should be avoided • Combining leaf-on and leaf-off data in pooled models for an ABA does not adversely impact model outcomes White, J.C., Arnett, J.T.T.R., Wulder, M.A., Tompalski, P., Coops, N.C. 2015. Evaluating the impact of leaf-on and leaf-off airborne laser scanning data on the estimation of forest inventory attributes with the area-based approach. Canadian Journal of Forest Research, 45: 1498–1513.
7
Data acquisition: leaf-on vs. leaf-off • Alberta currently has a patch-work of leafon and leaf-off data
8
Alberta (context) • > 33 million ha of airborne lidar • Data release to forest companies in response to MPB
9
Best Practices Guide Released July 2013 Synthesizes 25 years of scientific research Descriptive, not prescriptive Available for download from CFS bookstore: http://cfs.nrcan.gc.ca/publications?id =34887 Most downloaded publication from the CFS bookstore in 2013 White, J.C., Wulder, M.A., Varhola, A., Vastaranta, M., Coops, N.C., Cook, B.D., Pitt, D, Woods, M. 2013. A best practices guide for generating forest inventory attributes from airborne laser scanning data using the area-based approach. Information Report FI-X-10. Canadian Forest Service, Canadian Wood Fibre Centre, Pacific Forestry Centre, Victoria, B.C. 50 p.
10
Digital aerial photogrammetry (DAP) Interest in generating 3D information (point clouds, CHM) from digital aerial imagery White, J.C., Wulder, M.A., Vastaranta, M., Coops, N.C., Pitt, D., Woods, M. 2013. The utility of image-based point clouds for forest inventory: A comparison with airborne laser scanning. Forests, 4: 518–536.
Vastaranta, M., Wulder, M. A., White, J. C., Pekkarinen, A., Tuominen, S., Ginzler, C., Kankare, V., Holopainen, M., Hyyppä, J. and Hyyppä, H. 2013. Airborne laser scanning and digital stereo imagery measures of forest structure: Comparative results and implications to forest mapping and inventory update. Canadian Journal of Remote Sensing, 39(5): 382–395.
Model outcomes (EFI attributes) are comparable, but there are key differences between these data High spatial resolution DEM is required
11
Northern Vancouver Island • ~120,000 ha of LiDAR • Cooperative acquisition between BC Timber Sales (BCTS) and Western Forest Products • Highly productive, temperate rainforest dominated by western hemlock • Lidar: 11.6 points/m2
12
TRIM II DEM (25 m) 180 170 160 150 140
0
500
1,000
1,500
2,000
LiDAR DEM (1 m) 180 170 160 150 140 130 0
500
1,000
1,500
2,000
13
Species importance
Differences between reference stand volumes and simulated stand volumes for errors in species attribution, height, or both (mean ± SD), for conventional forest inventory (air photo interpretation or API), and LiDAR-based measures. Tompalski, P., Coops, N. C., White, J. C., Wulder, M. A. 2014. Simulating the impacts of error in species and height upon tree volume derived from airborne laser scanning data. Forest Ecology and Management, 327: 167–177.
14
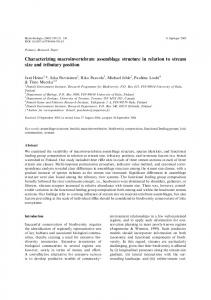
Augmenting productivity estimates
• Stand dominant height calculated based on ALS data • Revised site index value was generated • Calculated projected stand volume at 80 years
Comparison of volume per ha calculate for each stand with original (VORG) and revised (VREV) SI value. Mean difference in volume: 51.5%
Tompalski, P., Coops, N.C., White, J.C., Wulder, M.A. 2015. Augmenting site index estimation with airborne laser scanning data. Forest Science, 61: 861–873.
15
Developing productivity models
Time series of satellite imagery
Stand age
Airborne laser scanning
Dominant height Chronosequence
16
Developing productivity models Reference age = 32 years
• Estimating site productivity for young stands Tompalski, P., Coops, N. C., White, J. C., Wulder, M. A., Pickell, P. D. (2015). Estimating Forest Site Productivity Using Airborne Laser Scanning Data and Landsat Time Series. Canadian Journal of Remote Sensing, 41(3), 232–245.
17
Downscaling ABA estimates: Volume Additional information on individual tree volume extracted for every cell
Tompalski, P., Coops, N., White, J., Wulder, M. 2015. Enriching ALSderived area-based estimates of volume through tree-level downscaling. Forests, 6(8), 2608– 2630.
18
Digital aerial photogrammetry (DAP) • NVI • Differences between lidar and image-based point clouds across a range of slope and canopy cover classes • Compared both metrics and model outcomes • Image data: • UltraCamX • GSD: 0.30 m • Point density: 12.3 points/m2
Comparing model outcomes: ALS vs. DAP
19
• ALS performs better, but differences in RMSE are not statistically significant • DAP is not producing biased outcomes, relative to ALS
White, J.C., Stepper, C., Tompalski, P., Coops, N.C., Wulder, M.A. 2015. Comparing ALS and imagebased point cloud metrics and modelled forest inventory attributes in a complex coastal forest environment. Forests, 6: 3704–3732.
20
Current research: EFI layers as inputs to growth and yield modelling EFI outputs and DEM to inform riparian management DAP: Within-stand information derived from DAP Benchmarking for CHM specification
BP2: Modelling and spatial extension
21
CWFC research priorities:
Improved estimation efficiency Site productivity Growing the inventory Realize and document sector value
Linkages to AWARE: Hinton FMA, West Fraser Themes: Broad Scale, Stand Scale, Cross-cutting No BC site in AWARE
22
Uptake British Columbia NVI – BCTS and WFP (~120,000 ha) Island Timberlands (~255,000 ha) Alex Fraser Research Forest (~3,487 ha) Okanagan – BCTS and Tolko (450,000 ha) East Quesnel TSA (~490,000 ha) Cross-border sharing of expertise WA FPInnovations developing business case for lidar
Alberta Hinton (~1 Mha) Grande Prairie (1.2 Mha) Spray Lakes (~0.5 Mha) Lidar for all forest lands Wet Areas Mapping (WAM); many companies are now using this product Structural metrics to inform biodiversity
23
Status and direction Where we came from Where we are now Where we are going
24
Thanks! Joanne White and Mike Wulder Canadian Forest Service
Questions?
[email protected] [email protected]