Sep 14, 2010 - Research, Albuquerque, NM 87110, with initial support from the Department of Energy SBIR Program. [17] M.K. Matzen, in Proceedings of the ...
PHYSICAL REVIEW SPECIAL TOPICS - ACCELERATORS AND BEAMS 13, 090401 (2010)
Circuit models and three-dimensional electromagnetic simulations of a 1-MA linear transformer driver stage D. V. Rose, C. L. Miller, D. R. Welch, R. E. Clark, E. A. Madrid, and C. B. Mostrom Voss Scientific, LLC, Albuquerque, New Mexico 87108, USA
W. A. Stygar, K. R. LeChien, M. A. Mazarakis, W. L. Langston, J. L. Porter, and J. R. Woodworth Sandia National Laboratories, Albuquerque, New Mexico 87185, USA (Received 8 April 2010; published 14 September 2010) A 3D fully electromagnetic (EM) model of the principal pulsed-power components of a high-current linear transformer driver (LTD) has been developed. LTD systems are a relatively new modular and compact pulsed-power technology based on high-energy density capacitors and low-inductance switches located within a linear-induction cavity. We model 1-MA, 100-kV, 100-ns rise-time LTD cavities [A. A. Kim et al., Phys. Rev. ST Accel. Beams 12, 050402 (2009)] which can be used to drive z-pinch and material dynamics experiments. The model simulates the generation and propagation of electromagnetic power from individual capacitors and triggered gas switches to a radially symmetric output line. Multiple cavities, combined to provide voltage addition, drive a water-filled coaxial transmission line. A 3D fully EM model of a single 1-MA 100-kV LTD cavity driving a simple resistive load is presented and compared to electrical measurements. A new model of the current loss through the ferromagnetic cores is developed for use both in circuit representations of an LTD cavity and in the 3D EM simulations. Good agreement between the measured core current, a simple circuit model, and the 3D simulation model is obtained. A 3D EM model of an idealized ten-cavity LTD accelerator is also developed. The model results demonstrate efficient voltage addition when driving a matched impedance load, in good agreement with an idealized circuit model. DOI: 10.1103/PhysRevSTAB.13.090401
PACS numbers: 52.58.Lq, 52.65.Rr, 84.70.+p
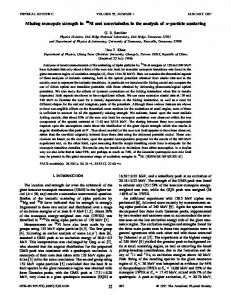
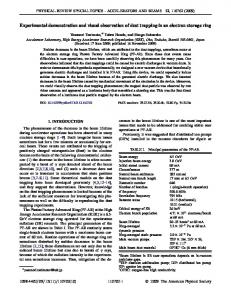
I. INTRODUCTION Linear transformer drivers (LTDs) are a rapidly developing area of pulsed-power technology that are capable of delivering high-power, high-current, 100–300 ns output pulses in a compact configuration [1–6]. The LTD platform is a type of induction accelerator that utilizes close packing of primary energy storage and switching to achieve a shortduration, high-peak-power pulse. A single LTD cavity is comprised internally of capacitors, switches, and ferromagnetic cores. Within each cavity, a set of two capacitors and a switch, connected in series, is referred to as a brick. Individual bricks are typically arranged azimuthally around the inside of the cavity and are connected in parallel to a radial transmission line inside the cavity. The parallelplate radial transmission line is either directly connected to a load or (more typically) feeds a coaxial transmission line that joins many similar LTD cavities in serial to form a type of induction voltage adder (IVA) [7]. High-current LTD cavities are presently being developed for use in z-pinch accelerators [4,5,8–11]. Besides z-pinch loads [12], the LTD accelerator architecture is sufficiently flexible to allow programmed power pulse shaping [9], enabling the same facility to drive various dynamic loads for material studies [13–15]. The 1-MA LTD-cavity design [5], shown schematically in Fig. 1, is considered. The capacitors are charged via an external 1098-4402=10=13(9)=090401(11)
circuit and the ferromagnetic cores are premagnetized [5]. The cores inhibit the flow of current along the inside of the LTD cavity. An external trigger circuit causes the gas switch to close, allowing the capacitors to discharge and drive a pulse through the radial parallel-plate transmission line and out through an insulated gap at the inner radius of the cavity. We describe a new EM computational modeling capability that is being developed to analyze the generation and propagation of EM energy in single LTD cavities and through a ten-cavity accelerator (Mykonos) presently under construction at Sandia National Laboratories (SNL) [10,11]. A full EM simulation of an LTD-cavity Electrodes Insulator Magnetic Core Capacitor
Gas Switch
FIG. 1. (Color) Cross-sectional view of the 1-MA LTD cavity indicating the locations of the major components, including the gas switch, capacitors, and magnetic cores.
090401-1
Ó 2010 The American Physical Society
D. V. ROSE et al.
Phys. Rev. ST Accel. Beams 13, 090401 (2010)
compliments conventional circuit analysis by providing the capability to assess self and mutual inductances, observe the magnitude and nature of high-frequency field components inside the cavity, and calculate field stresses at critical component junctions. The 3D EM particle-in-cell (PIC) code LSP [16] is used to model EM wave generation and propagation in the individual LTD cavities at the component level driving a simple resistive load [5], and through multiple cavities connected in series by a water-filled coaxial transmission line terminated by a matched impedance load. The Mykonos accelerator is a ten-cavity LTD prototype accelerator that could be used as a basis for nextgeneration, large-scale, pulsed-power facilities for z-pinch and materials dynamics research such as the proposed 1000-TW ZX facility [8,17]. The model presented here offers a new capability for testing modifications to existing LTD systems, such as pulse shaping [9] and cavity-load coupling [18] prior to installation. In addition, prototype designs of future large-scale, multiple-axes facilities [8,17] could, in principle, be analyzed using this computational modeling approach. This paper is organized as follows. In Sec. II a fully 3D EM numerical simulation model of a single LTD cavity is described. In Sec. III, an equivalent circuit model of an LTD cavity is presented. These models utilize a new, simple physics-based model for the current loss through the ferromagnetic cores, which is described in Appendix A. Comparisons between the 3D simulation model, the circuit model, and recent electrical measurements [5] from a single LTD-cavity driving a resistive load are given in Sec. IV. A 3D EM simulation model for a ten-cavity accelerator is described in Sec. V. Results from the tencavity EM simulation driving a simple water-filled transmission line terminated by a matched impedance load are described. A summary of this work and suggestions for future use of this computational model are given in Sec. VI.
IVA cavities (see, for example, Ref. [7]). In addition, LSP has been utilized in a number of studies of high-power MITLs [25–30] to motivate and validate theoretical models of electron power flow. The single-cavity simulation geometry is illustrated in Fig. 2. The internal component models within the cavity as
II. 3D EM SIMULATION MODEL All of the LSP simulations described here are carried out in 3D cylindrical coordinates (r, �, z) which make use of the inherent symmetry in the individual LTD cavities and the single-axis multiple-cavity accelerator model discussed in Sec. V. LSP has been used to model a number of pulsedpower generators including the SNL ZR accelerator [19,20]; the SNL LTDR [21], a 1-MV, seven-cavity LTD accelerator; and the SNL RITS-6 accelerator [18,22], a 12MV IVA. For the LTDR and RITS-6 accelerator models, the LSP PIC simulations were used to model the evolution of electron power flow along magnetically insulated transmission lines (MITLs), with EM power driven into the system through equivalent transmission line circuit representations of the pulsed-power sections. Oliver, et al. [23,24] developed a 3D LSP simulation model of a single RITS cavity that was used to optimize internal components, and similar models have been developed for other
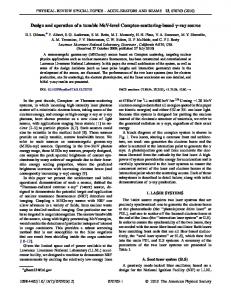
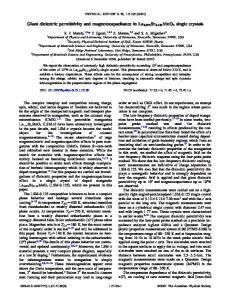
FIG. 2. (Color) Schematic of the 3D LSP simulation geometry used for the single-cavity analysis. The figure shows the azimuthal plane passing through the center of the switch and capacitors. The simulation model is periodic in � between 0 and �=20 radians. The dashed red line indicates the approximate brick current path used in the estimation of the mutual inductance.
090401-2
CIRCUIT MODELS AND THREE-DIMENSIONAL . . . described here are used throughout this work. The system has periodic symmetry in the � direction, and Fig. 2 shows a simulation geometry containing a single LTD brick. Simulations with more or all of the bricks are also possible, allowing the study of variable triggering of the different switches within a single cavity for pulse shaping [9] or the impact of switch jitter and fault tolerance [31]. The simulation grid is nonuniformly zoned in all coordinate directions. The azimuthal cell size varies between � ¼ 0:15 to 0.45 deg and is smallest at the center of the switch to partially resolve the breakdown channel cross section. The zoning in the z direction is largest at the sides of the cavity, with �z ¼ 5 mm, and smallest in the center of the cavity, �z ¼ 1:25 mm, to accurately resolve wave propagation in the radial-feed gap of the cavity. The radial grid resolution is �r ¼ 5 mm throughout most of the interior of the cavity. The radial grid size is decreased for radii smaller than the inner radius of the cavity to resolve radial dimensions of the resistive load, and inside the switch to better approximate the inductance of the switch discharge channel. In total, the single-cavity simulation model that includes only a single LTD brick uses approximately 3:6 � 105 grid cells. A fully 3D cavity model that explicitly includes all 40 bricks is also presented. It uses approximately 1:4 � 107 grid cells. LSP employs a two-direction domain decomposition scheme and all simulations have been carried out on various parallel computer systems using between 4 and 40 processor cores. The simulation model includes two idealized capacitors composed of parallel plates separated by a high relative permeability dielectric medium. The entire capacitor is enclosed in a plastic medium that roughly approximates the dimensions of the GA 35426 capacitors (40 nF, 100 kV) used in the 1-MA LTD cavities. The initial charge on the capacitors is set by initializing a 100-kV potential difference across the conducting plates inside the capacitors using a Poisson electrostatic field solve to initialize the simulation. The capacitors are connected to the radial transmission line and the switch end caps by conducting plates that are approximately the same size as the aluminum connectors used in the SNL LTD cavity. The capacitors begin to discharge once the gas-filled switch closes. Here the switch is modeled simply as a conductivity channel connecting the cylindrical end plates of the switch housing. The outer shell connecting the end plates is assumed to be a dielectric material, and the switch volume is filled with air and modeled here simply as a dielectric material medium. The switches used in the SNL 1-MA LTD cavity are a low-inductance, multiple anodecathode (AK) gap design developed by the High Current Electronics Institute [5,32,33]. Recent studies of the performance of this switch [33] have shown that several mmscale breakdown channels [34] develop in each of the six gaps. The switch AK gap used in the model is larger than the sum of the six individual gaps in LTD switch. We use a
Phys. Rev. ST Accel. Beams 13, 090401 (2010) single conductivity channel to span the AK gap, set to give a final resistance of 0:66 �, the nominal operating resistance of the switch after closure [5]. This channel has a cross-sectional area of approximately 0:045 cm2 . Additional inductance is added to the switch by enclosing the ends of the conductivity channel in a 2.75-cm-radius ‘‘material’’ channel with a high relative permeability inside the switch end plates [35]. A range of operating inductances can be obtained, spanning the inferred inductance of the actual switch. We note that the use of this idealized conductivity channel only roughly approximates the time-dependent electrical characteristics of the otherwise complex gas breakdown and streamer formation that takes place in the actual switches. The parallel-plate radial transmission line that is the outlet for the LTD cavity is filled with a dielectric material. In the experiments reported in Refs. [4,5], single-cavity tests are carried out with simple resistive load attached across this outlet. The single-cavity tests drive a resistive load across the cavity outlet. We model the approximate dimensions and resistivity of this load, giving the same load inductance estimated in Ref. [5]. The final inner radius of the single-cavity test geometry is terminated by an infinite impedance boundary condition at r ¼ 75:5 cm. Current flow along the inside of the cavity is impeded by premagnetized ferromagnetic cores [5]. These cores are typically composed of multiple concentric windings of ferromagnetic material separated by insulating dielectric material. The thin windings increase the relative surface area over which eddy currents can flow. As current begins to flow along the inside of the cavity, current flow is induced around the cross sections of the individual windings. This current flow results in an EM induction that opposes the current flow along the inside of the cavity. A finite but relatively small current (10% to 20% of the peak output current) is measured, which varies in time roughly with the output voltage. A detailed model of the eddy current flow around, and diffusion into, the ferromagnetic core material would require grid cell sizes much less than the thickness of windings (i.e., � 50 �m). For a 3D EM model of the 1-MA LTD cavities, this would require a total number of grid cells well beyond current large-scale computing capabilities. Several idealized models for the ferromagnetic cores have been utilized in previous EM simulations of IVA cavities. The simplest model places a high permeability material in the same volume occupied by the cores. This type of core model has been used successfully in the design and analysis of the RITS IVA cavities [7,18,22–24], where the measured core currents are less than 3% of the peak output current [36]. The relative permeability, �r ¼ �=�0 , for the core volume is set to a value of 1000, effectively preventing any current from flowing around the inside of the cavity over time scales of interest ( � 100 ns). We note that this basic core model
090401-3
D. V. ROSE et al.
Phys. Rev. ST Accel. Beams 13, 090401 (2010)
has been extended significantly by Hughes et al. [37] to include a hysteresis (B-H) loop model, multiple windings, and asymmetric material conductivity to set the value �r in time. This model was used successfully in the analysis of electrical breakdown characteristics inside the DARHT-II [38,39] accelerator cavities [37,40,41]. Based on the results of circuit model calculations, we have chosen to model the core loss in the 3D LSP simulation model as a resistor in the path of the core current. The most convenient way to accomplish this in the 3D model is to (artificially) place a resistive medium along the top of the cavity. The top of the cavity then contains an infinite impedance outlet boundary at large radius which does not interfere with the construction of multiple-cavity simulation models, such as the example presented in Sec. V. As described in Appendix A, we model the behavior of the ferromagnetic cores as a time-dependent resistance in the core-current path. The model assumes a linearly rising current, resulting in a t�1=2 dependence for the core resistance. Treating all of the variables on the right-hand side except for the time t as constants, Eq. (A11) gives the following expression for the core loss resistance: � RC ðtÞ ¼ pffiffi ; t
(1)
where the coefficient � is a constant related to the physical parameters of the ferromagnetic core. For the 1-MA LTD modeled here, these parameters give � ’ 1:6 � 10�4 for t in seconds and RC in � in Eq. (1). For the 3D EM simulation results presented in this work, the resistance of the medium varies in time according to Eq. (1). The inductance of the single-cavity simulation model was determined in a separate simulation that removed the switch conductivity channel, setting the core resistance to zero and driving a voltage pulse into cavity through the outlet path. An effective inductance of 15:8 � 0:1 nH was obtained. In addition, the mutual inductance between the core-current path along the interior of the cavity and the main brick current path through the switch, capacitors, and connecting hardware was estimated at 3:4 � 0:1 nH. This path is indicated in Fig. 2 by a dashed red line. These inductance values are used in the circuit model presented in Sec. III. III. LTD EQUIVALENT CIRCUIT MODEL Equivalent circuit models are commonly used to analyze the electrical performance of high-current LTD cavities [4,5,9,10]. We have developed a new equivalent circuit model of an LTD cavity. The circuit model includes a model for the time-dependent current loss through the core-current path. Appendix A summarizes the derivation of a time-dependent resistance term that is used in both the circuit model and the 3D EM simulations in Sec. II.
V0
C
LL
RS
LB
LC
I1
I3
I2
RL
RC(t)
M
FIG. 3. (Color) Equivalent circuit model of the 1-MA LTD cavity including variable resistance RC ðtÞ core loss model and mutual inductance M between the core and brick circuit legs.
The LTD equivalent circuit model developed for this analysis is illustrated in Fig. 3. The model includes the main components in the primary current path which is composed of capacitors and switches. Here all of the capacitors inside a single cavity are represented by a single lumped capacitance C, initially charged to 200 kV. The inductance associated with the 40 bricks (where each brick is composed of two capacitors and a switch connected in series) is represented by the inductor LB , and the switch resistance is denoted as RS . The load inductance and resistance is denoted as LL and RL , respectively. The loss or core-current path is represented by the series combination of an inductance LC and a time-dependent resistance RC ðtÞ. Finally, the mutual inductance between the core and brick current paths is accounted for by inductor M. Treating the voltage drop VðtÞ across the resistors, capacitors, and inductors in Fig. 3 by the relations VðtÞ ¼ RIðtÞ; 1 Zt VðtÞ ¼ Ið�Þd� þ Vð0Þ; C 0 dIðtÞ ; VðtÞ ¼ L dt
(2a) (2b) (2c)
we apply Kirchhoff’s laws using the current assignments given in Fig. 3 with the current summation rule, I1 ¼ I2 þ I3 ;
(3)
and arrive at the following set of coupled integrodifferential equations:
090401-4
CIRCUIT MODELS AND THREE-DIMENSIONAL . . .
Phys. Rev. ST Accel. Beams 13, 090401 (2010)
1 Zt dI dI dI I1 ð�Þd� þ V0 þ LB 1 þ RS I1 þ RL I2 þ LL 2 � M 3 ¼ 0; C 0 dt dt dt dI2 dI1 dI3 þ RL I2 þ M � RC ðtÞI3 � LC ¼ 0: LL dt dt dt
(4a) (4b)
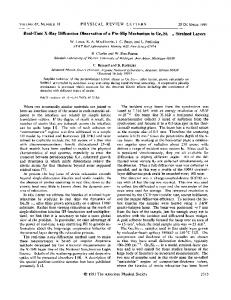
Differentiating Eq. (4a) with respect to t and making use of Eq. (3) to eliminate I3 gives the following set of coupled differential equations for I1 and I2 : � 2 � I1 d2 I d2 I dI dI d I1 d2 I2 þ LB 21 þ LL 22 þ RS 1 þ RL 2 � M � ¼ 0; (5a) C dt dt dt dt dt2 dt2 dI dI dI (5b) LL 2 þ RL I2 � ðI1 � I2 ÞRC ðtÞ þ ðM � LC Þ 1 þ LC 2 ¼ 0: dt dt dt The initial conditions for this circuit are obtained by noting that the initial currents are zero and that the impedance of the inductors will be large relative to that of the resistors and capacitors immediately after the switch closes. These initial conditions can be written as I1 ð0Þ ¼ I2 ð0Þ ¼ 0; � � � � M � LC dI1 ð0Þ M � LB LB þ LC � 2M þ ¼ ðM � LC Þ V0 � V0 dt LL þ M LL þ M dI2 ð0Þ V0 M � LB dI1 ð0Þ ¼ : þ dt LL þ M LL þ M dt Equations (5) with initial conditions (6) are solved numerically using an adaptive step size Runge-Kutta algorithm in MATHEMATICA [42]. IV. SINGLE LTD-CAVITY MODEL RESULTS Using the 3D model described in Sec. II, we have carried out EM simulations of a single LTD cavity driving a resistive load. The simulations use a load cavity with dimensions that approximate the load used in the singlecavity tests presented in Ref. [5]. The load cavity in the simulations has an inductance of 1.05 nH, and the load has a fixed resistance of 0:107 �. In Fig. 4, we compare the simulated load voltage and core loss currents with measurements from Ref. [5] and circuit model calculations. The load voltage calculated from both models is in very good agreement with the measured load voltage over most of the pulse duration. The calculated core loss currents plotted in Fig. 4(b) use a value of � ¼ 1:62 � 10�4 to match the peak value of the measured core loss current. The time-dependent core loss model described in Appendix A provides a reasonable approximation to the measured waveform. The measured core current indicates a finite amplitude signal rising before the load voltage, and this may be due to signal pickup on the current-measuring probes in the experiment. Otherwise, the model provides a reasonable approximation to the measured core current during the rising portion of the core current. The model fails to accurately track the falling portion of the measured core loss current, but this is to be expected based on the assumption of a linearly rising current profile [given in Eq. (A3)] used to derive the time-dependent core resistance function given in Eq. (1). The overall agreement between
(6a) (6b) (6c)
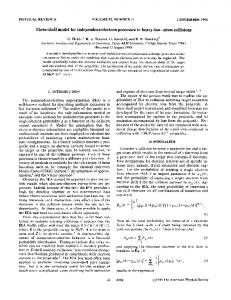
the 3D EM simulation model and the equivalent circuit model is very good, with the only discrepancy being the presence of a low-amplitude, low-frequency LC or cavity mode present in the 3D simulation model that can be seen in the core current just before the peak value is reached and continuing throughout the remainder of the pulse. Overall, the agreement between these models and the measurements demonstrates that 3D simulation is well characterized and a suitable tool for modeling LTD cavities. To illustrate the electric field dynamics within the cavity, the magnitude of the electric field inside the cavity at two times is shown in Fig. 5. At initialization (t ¼ 0), the electric fields within the capacitor models illustrate the internal energy storage location. The fringe fields around the capacitors are not likely to be an accurate representation of the actual fields around the physical capacitors due to capacitor construction details that are not included in the model. For times near peak power (t ¼ 80 ns), the field magnitude is now highest in the narrow, parallel-plate radial-feed outlet channel that connects to the load cavity. At this time, the voltage across the capacitor plates has fallen by roughly one-half, consistent with the change in electric field magnitude. Although the radial outlet boundary at the top of the cavity shows a high electric field magnitude due to the potential difference across the two halves of the cavity, no current flows out along this radial outlet. As described in Sec. II, this artificial boundary is part of the equivalent core loss model which includes a time-dependent resistive medium spanning the interior gap of this outlet. The simulation model used to obtain the results described above utilizes periodic boundaries in the � direc-
090401-5
D. V. ROSE et al.
Phys. Rev. ST Accel. Beams 13, 090401 (2010)
a) 100
Load Voltage (kV)
a) t=0
A. Kim Data (2009) EM Simulation Circuit Model
b) t=80 ns
kV/cm 70
56
50 42
28
0 0
Core Current (kA)
b)
100
200
300
Circuit Parameters: -1/2 RC(t)=0.000162t , LB=6.5 nH, M=3.7 nH 200
14
LC=15.8 nH, RL=0.107 Ω, LL=1.05 nH RS=0.0165 Ω 0
A. Kim Data (2009)
Circuit Model
100
FIG. 5. (Color) Electric field magnitudes from the single-cavity 3D LSP simulation model at (a) t ¼ 0 and (b) t ¼ 80 ns. The plots show the azimuthal plane passing through the center of the switch and capacitors.
EM Simulation 0 0
100
200
300
t (ns) FIG. 4. (Color) Comparison of (a) load voltages and (b) core currents. The black curves are measured traces from Ref. [5] with RL ¼ 0:107 �. The blue curves are from the circuit model calculations and the red curves are from a 3D LSP single-cavity simulation.
tion between 0 and �=20 deg to model the identical operation of all 40 bricks in the LTD cavity. However, several potential applications of the 3D model require asymmetric characteristics including pulse shaping and fault tolerance. The 3D model is easily extended to explicitly include all 40 bricks. Figure 6 plots the electric field magnitude at t ¼ 80 ns for one-quarter of the total simulation extent in the z ¼ 13 cm plane. Individual switch housings and capacitor plates can be seen in this view. For this example, all 40 bricks were similarly configured and discharged to check the agreement with the single
FIG. 6. (Color) Electric field magnitudes from the 3D LSP simulation model of a single cavity that includes all 40 bricks. The plot here is for the z ¼ 13 cm plane and shows one-quarter of the total azimuthal extent of the simulation region.
090401-6
CIRCUIT MODELS AND THREE-DIMENSIONAL . . .
Phys. Rev. ST Accel. Beams 13, 090401 (2010)
brick simulation model described above. As expected, no differences were found between the two models. The azimuthal electric field magnitude structures observed in Fig. 6 suggest further study of the possible excitation of azimuthal electric field modes driven by asymmetric brick firings. This and other studies utilizing the full 40 brick simulation model will be the subject of a future paper.
The individual cavities are triggered sequentially, with 6.6 ns between cavity firings to deliver the optimum peak power and rise time to the load [43]. Figure 8 shows the load power as a function of time for the 3D EM simulation model (red curve). The peak load power is 0.92 TW with a time to peak of 67 ns. Also shown in Fig. 8 is the power from a the circuit calculation of a ten-cavity accelerator based on the circuit model shown in Fig. 3. For this calculation, the circuit parameters have been scaled to represent the equivalent ten-cavity parameters [43]. The peak value and overall waveform shape of the downstream power obtained from the 3D simulation model is in good agreement with the circuit calculation.
V. TEN-CAVITY ACCELERATOR MODEL A ten-cavity LTD accelerator, using 1-MA 100-kV cavities, is presently under construction at SNL [10,11]. The cavities are connected in series through a water-filled coaxial transmission line that will drive a resistive load. Here we utilize the single cavity, single brick 3D EM model described above to build a ten-cavity accelerator model driving a coaxial transmission line terminated by a matched impedance load. A 2D view of the 3D simulation geometry can be seen in Fig. 7, which plots the electric field magnitudes in the cavities and transmission line at 0 and 150 ns. The center conductor of the coaxial transmission line is tapered to optimize the impedance at each cavity outlet, and varies linearly in radius between these points. This gives a roughly linear taper to the central conductor. This transmission line is filled with water (�r ¼ 80) and terminated with a matched impedance wave outlet boundary. The electric field magnitudes plotted for t ¼ 150 ns in Fig. 7(b), the time of peak load power, demonstrate voltage addition along the transmission line.
VI. SUMMARY A 3D, fully EM model of the principal pulsed-power components of a new high-current LTD accelerator has been developed. A 3D EM simulation model for highcurrent, fast-rise-time LTD cavities has been developed and benchmarked against single-cavity electrical measurements. A new model of the current loss through the magnetic cores has been developed for use both in the equivalent circuit models of an LTD cavity and in the 3D EM simulations. The model reproduces measured load voltages in both the circuit calculations and the 3D EM simulations. A 3D EM model of a ten-cavity LTD accelerator, presently under construction at SNL, has also been developed. The model results demonstrate efficient voltage addition
a) t=0
b) t=150 ns
FIG. 7. (Color) Electric field magnitudes from the ten-cavity 3D LSP simulation model at (a) t ¼ 0 and (b) t ¼ 150 ns. The plots show the azimuthal plane passing through the center of the switch and capacitors.
090401-7
D. V. ROSE et al. 1.0
Phys. Rev. ST Accel. Beams 13, 090401 (2010)
EM Simulation
tems support staff for their outstanding efforts to enable the completion of the numerical simulations. We thank M. Dyson and S. Welch for technical assistance in the preparation of this manuscript and K. Androlewicz of Ktech, Inc. for preparing Fig. 1. Sandia National Laboratories is a multiprogram laboratory operated by Sandia Corporation, a wholly owned subsidiary of Lockheed Martin company, for the U.S. Department of Energy’s National Nuclear Security Administration under Contract No. DE-AC0494AL85000.
Circuit Model
Load Power (TW)
0.8
0.6
0.4
APPENDIX A: A TIME-DEPENDENT CURRENT LOSS MODEL FOR A FERROMAGNETIC CORE
0.2
0.0 0
100
200
300
t (ns) FIG. 8. (Color) Total load power as a function of time for the ten-cavity LTD system as calculated from the circuit model (blue) with the RC ðtÞ core loss model and from the 3D LSP simulation model (red).
when driving a matched impedance load, in good agreement with an idealized circuit model. The 3D EM simulation model will be used to analyze the electrical performance of the ten-cavity accelerator when construction is completed. In the near future, the 3D EM simulation model will be used to develop new LTD cavities for improved electrical performance, intercavity pulse-shaping studies, and fault tolerance studies. The model could also be used in conjunction with other numerical tools in the development of next-generation accelerator facilities for pulsed-powerdriven inertial fusion energy and other applications [8,44]. ACKNOWLEDGMENTS The authors would very much like to thank R. J. Leeper, M. K. Matzen, R. McKee, and L. Schneider at Sandia National Laboratories for invaluable contributions. We thank D. D. Hinshelwood at the Naval Research Laboratory and T. C. Genoni at Voss Scientific for helpful discussions regarding transmission line and circuit modeling. We thank A. Kim at the Institute of High Current Electronics for providing the experimental data and many helpful discussions regarding the 1-MA LTD cavity. One of the authors (D. V. R.) wishes to thank J. Leckbee, D. L. Johnson, J. E. Maenchen, and B. V. Oliver for helpful discussions of LTD technology over many years. The numerical simulations were carried out on parallel computer systems at Voss Scientific and Sandia National Laboratories. The authors thank all of the computer sys-
As discussed in the main body of this article, not all of the current that is generated by the capacitors and switches of an LTD cavity is delivered to the load, since a fraction flows along the cavity’s interior surface. The current that flows along this path is impeded by the inductance associated with this path, the effective resistance due to the presence of the ferromagnetic cores located within the cavity, and the effective resistance of the interior cavity surface itself (since the interior-cavity-wall material is usually not a perfect conductor). In this Appendix we develop expressions for effective resistances of the cores and interior surface. The expressions can be used in both circuit and 3D EM models of an LTD. The development of these expressions follows the more general analysis of energy loss in current-carrying conductors that is given in Ref. [43]. We first develop an expression for the effective resistance due to the cores. The total energy loss (per unit surface area of core material) Wt is assumed to be the sum of four components [43]: Wt ¼ Wr þ Wm þ Ww þ W�L ;
(A1)
where Wr is the loss due to resistive (i.e., Ohmic) heating of the core material, Wm is the energy of the magnetic field that has diffused into the core, Ww is the j~ � B~ work performed on the material, and W�L is the energy required by the change in vacuum inductance due to motion of the conductor-vacuum boundaries of the cores. For the cores normally used in an LTD cavity we can neglect Ww and W�L : Ww þ W�L ¼ 0:
(A2)
The source of energy that is lost to the core is the magnetic field that is applied to, and subsequently diffuses into, the core material. The magnetic field is produced by the core current IC ðtÞ; i.e., the current that flows along the interior LTD-cavity surface, since this is the current that encircles the cores. We consider here the case where IC ðtÞ is a linear function of time: � ¼ 0; t < 0; (A3) IC ðtÞ / t; t � 0:
090401-8
CIRCUIT MODELS AND THREE-DIMENSIONAL . . .
Phys. Rev. ST Accel. Beams 13, 090401 (2010)
Although there are an infinite number of possible current time histories, we restrict our analysis in this article to such a linear ramp. Assuming Eq. (A3) allows us to use the results presented by Knoepfel [45,46], and to simplify our model. (It is straightforward to apply the approach presented herein to other power-law functions.) As shown by Knoepfel [45,46], when (i) Eq. (A3) is a reasonable approximation to the current time history, (ii) the resistivity and permeability of the core material can be approximated as constants, and (iii) the skin depth is much less than half the thickness of the ferromagnetic bands used to fabricate the cores, we can express the energy loss as follows: pffiffiffiffiffiffiffiffi 4 �C tB2C ðtÞ Wr þ Wm ¼ pffiffiffiffi 3=2 3=2 ; (A4) 5 ��C �0
To develop an expression for the effective resistance of the interior surface of an LTD cavity, we use arguments similar to the above to find that pffiffiffiffiffiffiffiffiffiffiffiffiffiffiffiffiffiffi �S �0 �S AS Rsurf ðtÞ ¼ (A10) pffiffi : 2�5=2 r2S t
where �C is the resistivity of the ferromagnetic material out of which the cores are fabricated, BC ðtÞ is the magnetic field at the surface of the core material, and �C is the material’s relative permeability. Following Parks and Spence [47], we obtain an effective core resistance by equating the time rate of change of Wt to an effective Ohmic power loss: @ Z Wt dA ¼ IC2 Rcore : (A5) @t AC Here AC is the total surface area of the core, which is given by 4�rC S ; (A6) AC ¼ 4�rC nw ¼ � where rC is the nominal distance of the core from the symmetry axis of the LTD, n is the number of bands in the core, w is the width of the core material, S is the total cross-sectional area of the core (not including the dielectric insulation between the bands of the core), and � is the thickness of a single core band. Combining Eqs. (A1)–(A6), and assuming that the magnetic field at the surfaces of the core’s bands can be approximated by BC ðtÞ ’
�C �0 IC ðtÞ ; 2�rC
(A7)
we obtain the following expression for the effective circuit resistance due to the cores: pffiffiffiffiffiffiffiffiffiffiffiffiffiffiffiffiffiffiffi 2 �C �0 �C S pffiffi : (A8) Rcore ðtÞ ¼ �3=2 rC � t Equation (A8) predicts Rcore / ð�C �C Þ1=2 S=rC �t1=2 , which differs significantly from the scaling � S RC / C 2 ; (A9) rC � predicted by Ref. [48]. However Eq. (A9), which is independent of �C and t, was developed under a different set of assumptions [48].
In this expression �S is the effective permeability of the interior-cavity-wall material, �S is the material’s resistivity, AS is the total area of the cavity’s interior surface, and rS is the nominal radius at which the surface is located. Combining Eqs. (A8) and (A10), we find that the total effective resistance is given by pffiffiffiffiffiffiffiffiffiffiffiffiffiffiffiffiffiffiffi pffiffiffiffiffiffiffiffiffiffiffiffiffiffiffiffiffiffi 2 �C �0 �C S �S �0 �S AS � RC ðtÞ ¼ þ pffiffi ¼ pffiffi : (A11) p ffiffi t 2�5=2 r2S t �3=2 rC � t We caution that � is not independent of the core current IC ðtÞ, since as this current increases the magnetic field within the cavity increases, which increases �C (and also �S , when the interior-cavity-wall material is ferromagnetic). This effect is, of course, not accounted for by Eq. (A11); when this equation is used, one can only assume as effective constant value of �C (and if necessary, �S ) for the problem at hand. Including this effect (for a linear-ramp core current) would give RC ðtÞ / t�b ;
where b > 1=2:
(A12)
Of course, one could simply use Eq. (A12) and determine b empirically. APPENDIX B: CONSTANT RC MODEL COMPARISON We compare the simulated core current that is obtained using the t�1=2 scaling suggested by Eq. (A11) and the current obtained using Eq. (A9) (which is independent of time), with the core-current measurement that is described in the main body of this article. Figure 9 plots the numerical solution to the system of circuit equations presented in Sec. III with RC ðtÞ as given by Eq. (A11) to the same calculation carried out with RC ¼ 0:66 �. This constant value was selected to give approximately the same peak core-current value as obtained in the experimental result given in Fig. 4. For both core loss models, the calculated load voltages are in good agreement with the measurement for times up to �230 ns. However, the calculated core loss current waveform for the constant RC model is not in agreement with the measurement, with a rapidly rising current value that peaks well before the measured value and falls too quickly. The time-dependent core loss resistance model gives a core-current rise time that approximates the measured value, and falls more slowly than the constant RC model, but still faster than the measurement. As described in Appendix A, the RC ðtÞ model was derived assuming only a linearly rising current pulse, and therefore is not expected be in agreement with the core-current
090401-9
D. V. ROSE et al.
Load Voltage (kV)
a)
Phys. Rev. ST Accel. Beams 13, 090401 (2010)
150 Circuit Parameters: LB=6.5 nH, RS=0.0165 Ω, M=3.7 nH,
[2]
LC=15.8 nH, RL=0.107 Ω, LL=1.05 nH Circuit Model -4 1/2 RC(t)=1.62x10 /t
100
50
A. Kim Data (2009)
0 0
100
200
[7] [8]
[9]
300
250
200
Core Current (kA)
[5] [6]
Circuit Model RC=0.66 Ω
b)
[3] [4]
[10]
Circuit Model RC=0.66 Ω
Circuit Model -4 1/2 RC(t)=1.62x10 /t
150
[11]
[12]
A. Kim Data (2009)
100
[13]
[14]
50 [15]
0 0
100
200
300
[16]
t (ns) FIG. 9. (Color) Comparison of (a) load voltages and (b) core currents. The black curves are the measured signals from Kim et al. [5]. The blue curves are from circuit calculations with RC ðtÞ as given by Eq. (1). The green curves are from circuit calculation with RC ¼ 0:66 �.
[17]
[18] [19]
measurement during the falling portion of the LTD power pulse. However, we observe that both time-dependent and constant RC models give essentially the same load-voltage time histories; hence Eq. (A9) provides a reasonable approximation when it is inconvenient to use the timedependent expression given by Eq. (A11).
[20] [21]
[1] B. M. Kovalchuk, V. A. Vizir, A. A. Kim, E. V. Kumpjak, S. V. Loginov, A. N. Bastrikov, V. V. Chervjakov, N. V.
090401-10
Tsou, P. Monjaux, and D. D. Kh’yui, Russ. Phys. J. 40, 1142 (1997). A. A. Kim, B. M. Kovalchuk, E. V. Kumpyak, and N. V. Tsoy, Russ. Phys. J. 42, 985 (1999). A. N. Bastrikov et al., Laser Part. Beams 21, 295 (2003). M. G. Mazarakis et al., Phys. Rev. ST Accel. Beams 12, 050401 (2009). A. A. Kim et al., Phys. Rev. ST Accel. Beams 12, 050402 (2009). L. Chen, L. Zhou, W. Zou, J. Ren, Y. Li, S. Wu, W. Xie, S. Feng, and J. Deng, Acta Phys. Pol. A 115, 1186 (2009) [http://przyrbwn.icm.edu.pl/APP/PDF/115/a115z680. pdf]. I. D. Smith, Phys. Rev. ST Accel. Beams 7, 064801 (2004). W. A. Stygar, M. E. Cuneo, D. I. Headley, H. C. Ives, R. J. Leeper, M. G. Mazarakis, C. L. Olson, J. L. Porter, and T. C. Wagoner, Phys. Rev. ST Accel. Beams 10, 030401 (2007). W. A. Stygar et al., Phys. Rev. ST Accel. Beams 12, 010402 (2009). M. G. Mazarakis et al., in Proceedings of the 17th IEEE International Pulsed Power Conference, Washington, DC, 2009, edited by F. Peterkin and R. Curry (IEEE, Piscataway, NJ, 2009), p. 138. K. LeChien et al., in Proceedings of the 17th IEEE International Pulsed Power Conference, Washington, DC, 2009 (Ref. [10]), p. 1186. D. D. Ryutov, M. S. Derzon, and M. K. Matzen, Rev. Mod. Phys. 72, 167 (2000). D. B. Reisman, A. Toor, R. C. Cauble, C. A. Hall, J. R. Asay, M. D. Knudson, and M. D. Furnish, J. Appl. Phys. 89, 1625 (2001). M. D. Knudson, C. A. Hall, R. Lemke, C. Deeney, and J. R. Asay, Int. J. Impact Engng. 29, 377 (2003) [http:// dx.doi.org/10.1016/j.ijimpeng.2003.09.033]. J. R. Asay and M. D. Knudson, in High-Pressure Shock Compression of Solids VIII: The Science and Technology of High-Velocity Impact, edited by L. C. Chhabildas, L. Davison, and Y. Horie (Springer, New York, 2005), p. 329. LSP is a software product developed by ATK Mission Research, Albuquerque, NM 87110, with initial support from the Department of Energy SBIR Program. M. K. Matzen, in Proceedings of the 16th IEEE Pulsed Power and Plasma Science Conferecne, Albuquerque, NM, 2007, edited by E. Schamiloglu and F. Peterkin (IEEE, Piscataway, NJ, 2007), p. 1. N. Bruner, T. Genoni, E. Madrid, D. Welch, K. Hahn, and B. Oliver, Phys. Rev. ST Accel. Beams 12, 070401 (2009). D. V. Rose, D. R. Welch, E. A. Madrid, C. L. Miller, R. E. Clark, W. A. Stygar, K. Struve, P. A. Corcoran, and B. Whitney, in Dense Z-Pinches, 7th International Conference on Dense Z-pinches, AIP Conf. Proc. No. 1088, edited by D. A. Hammer and B. R. Kusse (American Institute of Physics, Melville, New York, 2009), p. 263. D. V. Rose et al., Phys. Rev. ST Accel. Beams 13, 010402 (2010). D. V. Rose, D. R. Welch, B. V. Oliver, J. J. Leckbee, J. E. Maenchen, D. L. Johnson, A. A. Kim, B. M. Kovalchuk, and V. A. Sinebryukhov, IEEE Trans. Plasma Sci. 34, 1879 (2006).
CIRCUIT MODELS AND THREE-DIMENSIONAL . . . [22] N. Bruner et al., Phys. Rev. ST Accel. Beams 11, 040401 (2008). [23] B. V. Oliver, T. C. Genoni, D. L. Johnson, V. L. Bailey, P. Corcoran, I. Smith, J. E. Maenchen, I. Molina, and K. Hahn, in Proceedings of the 14th IEEE International Pulsed Power Conference, Dallas, TX, 2003, edited by M. Giesselmann and A. Neuber (IEEE, Piscataway, NJ, 2003), p. 395. [24] B. V. Oliver, R. E. Clark, T. C. Genoni, V. L. Bailey, P. Corcoran, D. L. Johnson, I. Smith, K. Hahn, I. Molina, and J. E. Maenchen, Mission Research Corporation Report No. MRC/ABQ-R-2119, 2003. [25] P. F. Ottinger and J. W. Schumer, Phys. Plasmas 13, 063101 (2006). [26] P. F. Ottinger and J. W. Schumer, Phys. Plasmas 13, 063109 (2006). [27] J. W. Schumer, P. F. Ottinger, and C. L. Olson, IEEE Trans. Plasma Sci. 34, 2652 (2006). [28] P. F. Ottinger and J. W. Schumer, IEEE Trans. Plasma Sci. 35, 154 (2007). [29] V. Bailey, P. Corcoran, V. Carboni, I. Smith, D. L. Johnson, B. Oliver, K. Thomas, and M. Swiekosz, in Proceedings of the 15th IEEE Internation Pulsed Power Conference, Monterey, CA, 2005, edited by J. Maenchen and E. Schamiloglu (IEEE, Piscataway, NJ, 2005), p. 322. [30] V. L. Bailey, P. Corcoran, D. L. Johnson, I. Smith, B. Oliver, and J. Maenchen, in Proceedings of the 16th IEEE Pulsed Power and Plasma Science Conference, Albuquerque, NM, 2007 (Ref. [17]), p. 1268. [31] J. J. Leckbee, J. E. Maenchen, D. L. Johnson, S. Portillo, D. M. Van De Valde, D. V. Rose, and B. V. Oliver, IEEE Trans. Plasma Sci. 34, 1888 (2006). [32] K. Hahn, J. R. Woodworth, W. T. Clark, J. R. Blickem, R. Starbird, M. J. Hardin, and Y. Maron, in Proceedings of the 16th IEEE Pulsed Power and Plasma Science Conference, Albuquerque, NM, 2007 (Ref. [17]), p. 125. [33] J. R. Woodworth et al., Phys. Rev. ST Accel. Beams 12, 060401 (2009). [34] K. R. LeChien and J. M. Gahl, Rev. Sci. Instrum. 75, 174 (2004).
Phys. Rev. ST Accel. Beams 13, 090401 (2010) [35] The switch model described here was originally suggested by P. Corcoran, L3 Communications (2009). [36] D. L. Johnson et al., in Proceedings of the 13th IEEE International Pulsed Power Conference, Las Vegas NV, edited by B. Reinovsky and M. Newton (IEEE, Piscataway, NJ, 2001), p. 600. [37] T. P. Hughes, T. C. Genoni, H. A. Davis, M. Kang, and B. A. Prichard, in Proceedings of the 15th IEEE International Pulsed Power Conference, Monterey CA, 2005 (Ref. [29]), p. 143. [38] M. J. Burns et al., in Proceedings of the 2001 Particle Accelerator Conference, Chicago, IL, 2001, edited by P. Lucas and S. Webber (IEEE, Piscataway, NJ, 2001), p. 325. [39] R. D. Scarpetti, S. Nath, H. A. Davis, C. A. Ekdahl, S. A. Eversole, D. W. Jones, B. T. Cuistian, H. V. Smith, G. J. Caporaso, and S. S. Yu, in Proceedings of the 15th IEEE International Pulsed Power Conference, Monterey, CA, 2005 (Ref. [29]), p. 37. [40] K. Nielson et al., in Proceedings of the 15th IEEE International Pulsed Power Conference, Monterey, CA, 2005 (Ref. [29]), p. 43. [41] W. L. Waldron, K. E. Nielson, and P. W. Spence, in Proceedings of the 15th IEEE International Pulsed Power Conference, Monterey, CA, 2005 (Ref. [29]), p. 47. [42] S. Wolfram, The Mathematica Book (Wolfram Media, Champaign, IL, 2003), 5th ed. [43] W. A. Stygar et al., Phys. Rev. ST Accel. Beams 11, 120401 (2008). [44] D. R. Welch, T. C. Genoni, D. V. Rose, N. Bruner, and W. A. Stygar, Phys. Rev. ST Accel. Beams 11, 030401 (2008). [45] H. Knoepfel, Pulsed High Magnetic Fields (NorthHolland, London, 1970). [46] H. E. Knoepfel, Magnetic Fields (Wiley, New York, 2000). [47] D. E. Parks and P. W. Spence (private communication). [48] A. A. Kim, M. G. Mazarakis, V. I. Manylov, V. A. Visir, and W. A. Stygar, Phys. Rev. ST Accel. Beams 13, 070401 (2010).
090401-11