Local Discriminant Bases (LDB) obtained from local cosine packets (CP) in combination with LDA to select and classify the most relevant time and frequency ...
CLASSIFICATION OF MOVEMENT EEG WITH LOCAL DISCRIMINANT BASES Nuri Firat Ince, Ahmed Tewfik*, Sami Arica Department of Electrical and Electronics Engineering, University of Cukurova Department of Electrical Engineering, University of Minnesota* ABSTRACT We use local discriminant bases and linear discriminant analysis to classify EEG of left and right hand movement execution and imagination. The local discriminant bases adaptively segment and extract features from real and imagined movement EEG (2003 BCI Competition) using cosine packets and KullbackLeibler, Euclidean and Hellinger class separability (CS) criteria. We also tried Principal Component Analysis (PCA) as another feature reduction method. In our case, CS ordered coefficients resulted in lower classification error than PCA using a smaller number of coefficients. We observed that the most discriminative components were located on the post movement beta and alpha synchronization. Pre-movement features were also selected by the algorithm. We believe that these segments correspond to the mental state and strategy of the subject during the movement execution/imagination. The main advantage of the algorithm is that it adaptively finds these physiological states in an ongoing EEG. This may eliminate the inter- and intra-subject variability. The average error rate of the classification was 12.7% for movement execution and 14.2% for movement imagination. Accordingly, the algorithm would be the 3rd best in the 2003 BCI competition.
which is an improved LVQ [5]. This method allowed selecting the most relevant frequency bands. It has been reported that these bands are subject specific [5]. Besides band power, adaptive autoregressive (AAR) modeling for parameter estimation and linear discriminants (LDA) for classification has also been used [6]. The time changing parameters of AAR were fed as features to LDA. Since AAR parameters define the dynamic changes in EEG, there is no need to select the most relevant frequency bands with this method. On the other hand searching for the optimal time point for classification is a challenge in this approach. It has been reported that the optimal time point is also subject specific. Both DSLVQ and AAR algorithms have attempted to find the frequency bands or time points, which have maximum influence on classification. The two methods emphasize the importance of selecting the optimal time-frequency (T-F) points and the subject dependency of this selection. These results have led us to utilize a method where patterns spread over the T-F plane can be extracted adaptively for better classification. Since the ERD and ERS are time locked activities we use Local Discriminant Bases (LDB) obtained from local cosine packets (CP) in combination with LDA to select and classify the most relevant time and frequency points adaptively.
1. INTRODUCTION
2. MATERIALS
Electroencephalogram (EEG) has become an important tool for communication and control for handicapped persons. It has helped to construct brain computer interfaces (BCI) in a noninvasive manner. There are several ways to construct BCI including P300 waves, evoked potential and rhythmic activities. It has been shown that imagery of left and right hand movements can also be used as a strategy for BCI [1]. For this reason, the analysis of movement related alterations of alpha and beta rhythms have received significant attention in recent years. It was found that execution of either left or right hand movement results in amplitude attenuation and increase in the alpha and beta bands of EEG. These patterns are called event related desynchronization (ERD) and synchronization (ERS) respectively [2]. It has been shown that as well as execution, imagination of movement induces similar patterns on the motor cortex. A detailed description can be found in [3]. Several methods have been used to detect and classify these event-related activities in single sweep EEG. Initially band power from fixed windows was used in combination with learning vector quantization (LVQ) for classification [4]. However it was important to figure out which bands should be used for a better classification. This problem was solved by distinction sensitive learning vector quantization (DSLVQ),
We use a subset of the data in [7] for movement executions (ME) and the Imagery (MI) data of the 2003 BCI Competition [8]. The ME EEG data was collected from three subjects (S1, S2, S3). Consecutive movements of finger were performed with a time separation of no less than 10 sec. These movements were detected via a micro-switch. EEG was digitized from 19 electrodes selected from the extended 10-20 system with Nuamps Neroscanҏ™. The electrode skin impedance was kept below 10 k:. The signal was sampled at 250 Hz. Channels on motor cortex were transformed into local average derivation. There exist 240, 120 and 100 sweeps for each movement from each subject respectively. The MI data was recorded from a normal subject (I1, female, 25year) during a feedback session. The subject sat relaxed in a chair with armrests. The task was to control a feedback bar by means of imagery left or right hand movement. The order of left and right cues was random. The experiment consists of 7 runs with 40 trials each. All runs were conducted on the same day with several minutes break in between. Given are 280 trials each with a 9sec length. Three bipolar EEG channels (anterior ‘+’, posterior ‘-‘) were measured over C3, Cz and C4. The EEG was sampled at 128Hz and was filtered between 0.5 and 30Hz.
0-7803-8874-7/05/$20.00 ©2005 IEEE
V - 413
ICASSP 2005
3.3 Feature Extraction and Classification
3. METHODS 3.1. Local Discriminant Bases Important features for classification often appear as a transient phenomenon. For this reason it is important to focus on local properties of the signal. The best basis algorithm was developed to extract such local information [9]. However the main concern of this method is signal representation. This method expands the signal into orthonormal bases by using wavelet packets or local trigonometric bases over a dyadic grid – binary tree. This tree is then pruned to minimize a cost function such as entropy by a divide and conquer algorithm. If the selected cost function is entropy such an algorithm results in selecting the sub basis, which maximizes signal compression. For classification the discrimination power of the nodes must be measured. For this reason, the entropy criterion is replaced by another cost function, which can measure the distance of the nodes between the classes. By pruning the binary tree to maximize the selected cost function local discriminant bases (LDB) are extracted [10]. There are various choices for distance measures. Assume p, q are normalized energy distributions of signals belonging to class1 and class2 respectively. We used: x The symmetric Kullback Leibler distance, which is also named as J-divergence, n
pi
¦ p log q
I ( p, q )
i 1
i
v
I � p, q � I � q , p
J ( p, q) x
(1)
i
(2)
Euclidean distance n
D � p, q
pi � qi
¦� p
2
i
� qi
2
(3)
i 1
x
and the Hellinger distance n
¦�
H � p, q
pi �
qi
2
(4)
i 1
We also considered the Fisher criterion for feature selection.
F
�P
1 2
Since the C3 and C4 electrodes are the most active electrodes in a hand/finger movement task, we construct two adaptive segmentations one for C3 and the other for C4 electrodes to discriminate between left and right events. After getting the segmentation, we sort the coefficients from the time frequency plane according to their discrimination power. Then a small group is selected for classification. We observed however during our analysis that the most discriminating features are always located on alpha and beta bands. In order to represent the activities in these bands, many correlated cosine packet coefficients are selected. It is a well-known problem that high dimensional data causes the classifier to lose its generalization capability. The high dimensionality and correlation between features were ignored in the original LDB. In order to reduce this dimensionality we averaged the cosine packet coefficients in the 8-13Hz and 14-35Hz bands. This corresponds to getting the alpha and beta band powers (BP) in adaptively selected time intervals. Then we sorted the alpha and beta band powers according to their discrimination power. Finally we used this reduced feature set for classification as an input to LDA. LDA is one of the most commonly used statistical classifier due to its ease of implementation and trainability. It can be seen as a method for identifying best discriminating hyperplane in an n dimensional space. A detailed description can be found in [12]. The weight vector used in LDA is calculated as
� P2 2
V1 � V 2
�1
( ¦1 � ¦ 2 ) ( m1 � m2 )
where ¦ , m are the covariance matrix and mean of class features respectively. The distance of a feature vector to the discriminating hyperplane is calculated as
vT x where x is the feature vector and d is the distance. d
where P and V are the mean and standard deviation of the feature it belongs to. After pruning the tree, the coefficients with the most discrimination power are sorted according to the given CS criterion. Then a small subset is selected from the entire set. 3.2. Cosine Packets Most of the time in order to get local information the signal is analyzed in short blocks with a Fourier basis. This type of block transform generates side-lobe artifacts due to disjoint rectangular windows. When smooth windows are used, orthogonality is lost. It is possible to construct orthogonal transforms with smooth and overlapping windows by using trigonometric bases. The construction can be obtained from sine or cosine bases. The cosine packet coefficients can be computed with fast discrete cosine transform (type IV), after a preliminary folding step [11].
(7)
In [13] PCA was used for dimension reduction to classify electromyogram signal. Here we also consider PCA for dimension reduction on the band power coefficients. We projected the entire feature set onto its eigenvectors.
uk (5)
(6)
T
Wk x
(8)
uk is the projected vector, Wk is the kth eigenvector of the covariance matrix of the feature set and x is the feature where
vector. Then we sorted these features according to their corresponding eigenvalues in descending order. Ten-fold cross validation was used to calculate the classification error of ME data. The MI data set consists of 140 sweeps for training and 140 for testing. Five-fold cross validation was used to select the optimum number of features during the training phase for this data set. 4. RESULTS Table 1 shows the classification error of the features selected by CS and PCA. The values in the last column, labeled as “Fixed”, represent the classification error obtained from a uniform segmentation where the EEG was analyzed in 0.5 sec intervals and all BP coefficients were used without any dimensional reduction.
V - 414
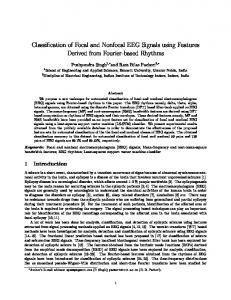
4.1 Movement Data Although CS and PCA have very similar results, the best were obtained with the CS method. The PCA uses more features than CS to lower the classification error. The initial features of PCA resulted in very poor classification error (See Figure 1). This can be explained by the fact that the first eigenvectors may be in the direction of the most energetic features, which are alpha activities, or some high amplitude oscillations before the movement with large variability. We saw that the primary features selected by CS are most of the time, post movement beta synchronization. These features are followed by alpha oscillations, which belong to the planning stage. Post movement alpha synchronization is also selected as a primary feature. The locations of these features are a few seconds after the movement whereas beta synchronization occurs right after the movement (See Figure 2). We notice that adding more PCA features for classification is more robust than CS features. The uncorrelated characteristic of PCA features can be a reason for this Interestingly the algorithm constructed different tiling for each channel for some subjects, where normally a mirroring was expected. CS PCA Fixed NC Err NC Err 37 22.3 37 J J 33 Fisher 40 22.1 40 D D 21.5 Fisher 40 37 22.2 37 H H 32 Fisher 23 11.7 15 J J 21 Fisher 11 26 D D 15 12.4 15 Fisher 23 10.8 29 H H 21 Fisher 17 12.6 30 J J 18 Fisher 13 12.5 30 D D 20 Fisher 13 17 12.6 30 H H 18 Fisher MI CS PCA Fixed Err NC Err NC Err 15 8 15 9 J J 15 9 Fisher 19.2 6 21 4 D D 23.6 22.1 8 Fisher 15 9 H H 14.2 7 14.2 12 Fisher Table 1. Results with minimum error for each subject are highlighted. Besides classification, the number of coefficients (NC) for minimal error is also given. Err 19.7 19.7 19.6 18 20.1 19.7 9.5 9 8.3 9.17 9.3 9.17 12.8 12.5 12.3 12 12.8 12.5
I1
S3
S2
S1
ME
4.2 Imagery Data The adaptive segmentation of C3 and C4 electrodes to discriminate left and right MI was very close. Here a perfect mirroring did not exist either. We used individual CP and BP for
classification. There was an improvement from CP to BP but not as large as in ME data. The main reason for this is that the subject has only alpha activity or that the only discriminant components occur in a short interval just after the cue in the alpha band. So both methods are using a few coefficients to represent this discriminative information. The features are selected from the intervals 3-6 and 4-6 sec. on C3 and C4 electrodes respectively (Figure 3). The locations of the features were not identical on either channel. Interestingly, we observed that a few of the selected features occur before presentation of the cue. We believe these intervals are the mental states where the subject is producing imagery activity. Because we are limited to using intervals of dyadic lengths with LDB, we examined two 8 sec subintervals (the 0-8 and 1-9 second intervals) from the total record length, which was 9 sec. In both cases the algorithm chose the same intervals for feature selection. 4.3. C3-C4 Asymmetry It has been reported that the left and right hand movement causes ERD and ERS events on the left and right hemisphere. The occurrences of these activities are mirrored on both hemispheres according to the direction of the movement. It has been stated that the ERD starts earlier on the contra-lateral side during planning and becomes symmetric on both sides during the movement. In the post movement state, ERS occurs on both sides but with higher amplitude on contra-lateral side [14]. We observed similar patterns on these data sets. But the adaptive segmentation of C3 and C4 was different on some subjects. We saw that a large difference exists on beta ERS energy between left and right hand finger movement on subject2. The energy of beta ERS of C4 for left-hand finger movement was much higher than the right-hand finger movement beta ERS. On the other hand the C3 electrode always shows similar ERS activity on both movement tasks. Another important difference was the pre movement alpha oscillation on C4 side before right hand movement (See Figure 2). Handedness can be a reason for this asymmetry. It has been recently shown that asymmetric hemisphere modeling can give better results than when perfect mirroring is assumed between both hemispheres [15]. 5. CONCLUSION In this paper, we used LDB obtained from CP for adaptive segmentation and feature selection of movement EEG. The original CS sorted cosine packet features result in high dimensionality. We used band power obtained from cosine packet coefficients to represent alpha and beta activities and to reduce the dimensionality. This method also partly groups the correlated coefficients together. Such pre-processing resulted in an improvement of 10% on ME and 2% on MI data set. We observed that the algorithm constructed different segmentations for each subject. With this property inter and intra subject variability can be eliminated. According to the mental state and imagery strategy, the LDB bases will differ from day to day or from subject to subject. Next we plan to adapt the bands in each segment for maximum discrimination. The adaptive segmentation is based on the difference of the activities on the same electrode. The segmentation can also be constructed for each movement task by using the asymmetric behavior between C3 and C4. We plan to answer these questions as a next step of our study.
V - 415
6. ACKNOWLEDGMENT This project is supported by The National Scientific Research Council of Turkey (TUBITAK). Project No. 103E030. 7. REFERENCES
Figure 1. The classification error obtained by selecting individual coefficients, CS and PCA ordered coefficients in specific bands of Subject 2. (CS = Euclidean)
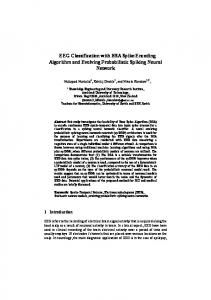
Figure 2. Alpha ERS on electrode C4 during planning phase. Right after movement the beta ERS starts at electrode C3 and it is followed by strong alpha ERS on C4. The arrow indicates the onset of the movement.
Figure 3. LDB features of imagery data. At sec 3 an arrow is displayed on the screen and the subject was asked to imagine left or right hand movement according to the direction. The darker features have the more discrimination power. Their locations differ on both electrodes.
[1] G. Pfurtscheller, C. Neuper, “Motor Imagery and DirectBrain-Communication,” Proceedings of the IEEE, pp. 1123-1134, vol.89 no7, 2001. [2] G. Pfurtscheller, A. Aranibar “Event related cortical desynchronization detected by power measurements of scalp EEG”. Electroencephalography and Clinical Neurophysiology; 42:817-826, 1977. [3] C. Neuper and G. Pfurtscheller, “Motor imagery and ERD”, In: Pfurtscheller G., Lopes da Silva FH, editors. Handbook of Electroencephalography and Clinical Neurophysiology, Revised Series, Volume 6. Amsterdam: Elsevier, 303-325, 1999. [4] J. Kalcher, D. Flotzinger , G. Pfurtscheller, “Brain-computer interface - A new communication device for handicapped persons”. Journal of Microcomputer Applications, 16:293-299, 1993. [5] M. Prezenger and G. Pfurtscheller, “Frequency component selection for an EEG-based brain computer interface”, IEEE Trans. on Rehabil. Eng. 7:413-419, 1999. 7:413-419, 1999. [6] A. Schlögl, D. Flotzinger, G. Pfurtscheller, “Adaptive autoregressive modeling used for single trial EEG classification”, Biomed. Technik,42:162-167, 1997. [7] N.F. Ince, S. Arica, “Analysis and Visualization of ERD and ERS with Adapted Local Cosine Transform”, Proceedings of 26th Annual International Conference of IEEE Engineering in Medicine and Biology Society, EMBC 2004 IEEE, San Francisco, 2004. [8] http://ida.first.fraunhofer.de/projects/bci/competition [9] MV. Wickerhauser, RR. Coifman, “Entropy based algorithms for best basis selection”. IEEE Transactions on Information Theory, 32:712-18, 1992. [10] N. Saito, “Local feature extraction using a library of bases”, Dissertation, Yale University, 1994. [11] M.V. Wickerhauser, “Adapted Wavelet Analysis from theory to software”, A.K. Peters, Massachussetts, 1994. [12] R. Duda, P. Hart, “Pattern Classification and Scene Analysis”, John Wiley&Sons, 1973. [13] K. Engelhart, B. Hudgins, P.A. Parker, M. Stevenson, “Classification of the Myoelectric Signal using Time-Frequency Based Representations”, Medical Engineering and Physics on Intelligent Data Analysis in Electromyography and Electroneurography, 1999. [14] G. Pfurtscheller, K. Pichler-Zalaudek, Christa Neuper, “ERD and ERS in voluntary movement of different limbs”, In: Pfurtscheller G., Lopes da Silva FH, editors. Handbook of Electroencephalography and Clinical Neurophysiology, Revised Series, Volume 6. Amsterdam: Elsevier, 245-268, 1999. [15] B. Obermaier, C. Munteanu, G. Pfurtscheller, “Asymmetric Hemisphere Modelling in an offline Brain Computer Interface”, IEEE Transactions on Systems Man and Cybernetics PartC Applications and Reviews,4:31;536-540, 2001
V - 416