International Journal of Computer and Electrical Engineering, Vol. 1, No. 5 December, 2009
1793-8163
Classification of Transients using Wavelet Based Entropy and Radial Basis Neural Networks T. Jayasree, D. Devaraj, R. Sukanesh
provides a fast and effective way of analyzing nonstationary voltage and current waveforms. As in the Fourier Transform, the WT decomposes a signal into its frequency components. Unlike the Fourier Transform, the wavelet can tailor the frequency resolution, a useful property in the categorization of the source of a transient. The ability of wavelets to focus on short time intervals for high- frequency components and long intervals for low- frequency components improves the analysis of signals with localized impulses and oscillations. In this paper, wavelet multi resolution analysis is used to extract the relevant features from the disturbance waveform. The dimensionality of the feature vector is reduced by applying an entropy- based feature selection technique. Artificial Neural Network (ANN) have been proposed in the literature [4] for automatic disturbance waveform recognition. The most important and useful property of ANN is the ability to interpolate unforeseen patterns. Once trained with sufficient number of example patterns that covers a wide range of input variables ANNs can interpolate any new pattern that falls in the domain of its input features. Gouda et al.[2] proposed the wavelet multi-resolution analysis technique to detect, localize and classify different power quality problems. A new feature extraction method based on the standard deviation at different resolution levels was applied as input to the neural network to classify power quality disturbances type. He and Starzyk [3] proposed a novel approach for PQ disturbance classification based on the wavelet transform and Self Organizing Learning Array (SOLAR). In this paper, energy value at each decomposition level using multi-resolution analysis is applied to SOLAR. Elmitwally et al. [5] proposed a new classifier using neuro fuzzy network. A power quality disturbance recognition system using wavelet statistical features is employed. Safavian et al.[6] proposed a variance fractal trajectory method to categorize the power system transients and to extract the features. Based on these extracted features, classification of transients is carried out using a statistical maximum likelihood classifier, which discriminates between three classes of voltage disturbances such as faults, breaker operations and capacitor switching. N.P.Subramoniam et al. [7] has presented the classification of high impedance transients based on the energy curve from the wavelet coefficient at each level. Most of the authors have used feed forward neural networks with sigmoidal nonlinearities for model development. The short coming of this network is that it takes long time for training. Also, it has no inherent ability to detect the outliers. In this paper, we propose RBF networks [8] to recognize the
Abstract— This paper presents an Artificial Neural Network (ANN) based approach for power system transient classification. Wavelet transform is applied to extract the features from the raw signal. An entropy based method is proposed to select the input features of the network. The entropy based method reduces the size of the input features without losing the characteristics of the signal. The selected features are given to a Radial Basis Function (RBF) neural network for further classification. The data required to develop the network are generated by simulating various faults in the test system. The simulation results show that the proposed method provides a robust and accurate method for power system transient classification. Index terms— Artificial Neural Networks, classification, Power system transients, disturbances, Wavelet Transform.
I. INTRODUCTION Power system transients are fast, short duration events that produce distortions in the A.C waveform. They are caused by sudden changes in the power system. Some of the more common causes of transients are: lightning strikes, switching operations and electrical faults. The effects of transients on equipment are cumulative, with every succeeding transient having a greater effect on the equipment. Transients are difficult to detect because of their short duration. The instrument for measuring the transient should have high sampling rate to provide greater accuracy in describing transient events in terms of their amplitude and frequency content. These attributes are essential for performing transient analysis. The amplitude of the waveform provides information about the potential for damage to the affected equipment. The frequency content informs us how the events may couple to other circuits and how they might be mitigated. The processing of disturbance waveform requires some form of signal analysis in the frequency domain. Traditionally Fourier Transform [1] has been used in the power engineering field to obtain the spectral content of the time domain signal. The wavelet transform (WT) [2]
Manusript received April 14, 2009. T.Jayasree is with the Electronics and Communication Engineering Department, Govt. Polytechnic College, Tuticorin, India (corresponding author to provide phone: 91 9486324974. Email:
[email protected]) D.Devaraj is with the Electrical and Electronics Engineering Department, Kalasalingam University, Srivilliputhur, India. (email:
[email protected]) R.Sukanesh is with the Electronics and Communication Engineering Department, Thiagaraja College of Engineering, Madurai, India. (email:
[email protected])
590
International Journal of Computer and Electrical Engineering, Vol. 1, No. 5 December, 2009
1793-8163 disturbance waveform. RBF networks takes less time for training and the distance - based activation function used in the hidden nodes gives the ability to detect the outliers during estimation. II.
lasting between 5 ns to 1ms and the oscillatory transient between 5 and 500 kHz are less frequent than the low frequency types but have much higher amplitude. These transients may not propagate as easily as the low frequency types but may cause arcing faults on the power distribution system which result in voltage sag on many user power systems. The high frequency transient types with high amplitude can be observed only near where the phenomenon occurs. The high frequency impulsive transient has duration below 50 ns and the frequency of the high frequency oscillatory type ranges between 0.5 to 5MHz.
POWER SYSTEM TRANSIENTS
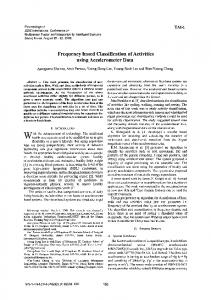
Transients [7] are momentary changes in voltage or current those occur over a short period of time. This interval is usually described as approximately 1/16th of a voltage cycle or about 1ms. Transients are classified into three categories: impulsive transient, oscillatory transient and transient due to fault. The transient is classified in the impulse category when 77% of the peak-to-peak voltage of the pure component is of one polarity. An oscillatory transient is a sudden, non- power frequency change in the steady state condition of voltage, current or both that includes positive and negative polarity values. The transient due to fault is caused by fault conditions, the energization of large loads which require high starting currents or intermittent loose connections in power wiring. Each category of the transient is sub divided in to three types related to the frequencies contained. Each type of transient can be associated with a group of phenomena occurring on the power system. The three types of transients are depicted in the following figures 2.1 to 2.3
III. PROPOSED METHODOLOGY The proposed methodology for disturbance waveform classification is based on Artificial Neural Network. Artificial Neural Network approach for any application involves two stages: network development and actual usage of the network. During the network development phase, the neural network is trained to capture the relationship between the input and output. The training and the test data required to develop the ANN are generated through off- line simulation process. After training, the network is tested with the test data to assess the generalization capability of the developed network. The block diagram representation of the proposed model for power system transient classification is shown in fig 3.1
1000
500
Waveform generation
0
-500
Feature Extraction
Feature selection
-1000
-1500
0
0.02
0.04
0.06
0.08
0.1
0.12
0.14
0.16
0.18
Transient 1 Transient 2 Transient 3
0.2
Fig 2.1 Oscillatory Transients
Neural network
10
5
Fig 3.1 Proposed model for power system transient classification
0
-5
-10
-15
-20
-25
0
0.1
0.2
0.3
0.4
0.5
0.6
0.7
0.8
Fig 2.2 Impulsive Transient 25 20 15 10 5 0 -5 -10 -15 -20
0
0.005
0.01
0.015
0.02
0.025
0.03
0.035
0.04
Fig 2.3 Transient due to fault
The impulsive low frequency transient rises in 0.1 ms and lasts more than 1ms.The oscillatory low frequency transient contains frequency components up to 5 kHz. These types are the most common transients recorded on a power system. They are not only propagated but they can also be amplified by a power systems resonance phenomenon. Measurement of these types of transients should be useful for all classes of application. The medium frequency impulsive transient
591
Generation of the appropriate training data is an important step in the development of ANN models. A large number of training data is generated through off-line simulation process. Three types of power quality transients namely, impulse transient, oscillatory transient and transient due to fault are generated by simulating various events in the test system. Feature extraction is the key for pattern recognition so that it is the most important component of designing the intelligent system based on pattern recognition since even the best classifier will perform poorly if the features are not chosen well. A feature extractor should reduce the pattern (i.e., the original waveform) to a lower dimension which contains most of the useful information from the original vector. The disturbance signal in time domain is transformed into the wavelet domain before applying the input to the neural network. The wavelet coefficients such as approximation and detail coefficients are obtained by finding the wavelet transform of the disturbance signals using Multi Resolution Analysis (MRA) technique. Most useful features must be first selected from these coefficients to reduce the dimension of feature vectors, in order to more effectively recognize the type of power
International Journal of Computer and Electrical Engineering, Vol. 1, No. 5 December, 2009
1793-8163 quality disturbances. A feature selection algorithm based on Shannon (non normalized) entropy is applied to select the input features of the network. The entropy [9] is a measure of irregularities of states such as imbalance and uncertainty. Since power quality disturbance signals have the imbalance, the non stationary, the different frequency component and the different energy distribution, the Shannon entropy is proposed to extract the features from different power system transient. The selected features are presented to the Radial Basis Function (RBF) neural network. The RBF network used here has an input layer, a hidden layer consisting of Gaussian function, a set of weights to connect hidden layer and output layer. The attractive feature of RBFNN lies in the linear dependence in the parameters which greatly simplifies the design and analysis of such networks. It also has an advantage of easy and effective learning algorithm compared to the back propagation neural network. After training, the network is tested with the test data to assess the generalization ability of the network.
coefficients h(n) and the wavelet function is associated with the high pass filter with the filter coefficients g(n).The high pass filter coefficients are called as the approximations and the low pass filter coefficients are called as the details. The approximation coefficients and the detail coefficients are given by the following equations. CAj(k) = Σ f(n)hd(-k+2n) (3) k CDj(k) = Σ f(n)gd(-k+2n) (4) k Where f(n) is the input signal and j is the resolution level. Wavelet transformation [13] has the ability to analyze different power quality problems simultaneously in both time and frequency domains. The wavelet transform is useful in detecting and extracting disturbance features of various types of electric power quality disturbances because it is sensitive to signal irregularities but insensitive to the regular-like signal behavior. V. FEATURE SELECTION USING ENTROPY In the neural network approach, by selecting only the relevant attributes of the data as input features and excluding the redundant ones, higher performance is expected with smaller computational effort. In this work, the input features of the network are selected based on entropy. Entropy [10] is a common concept in many fields, mainly in signal processing. In thermodynamics, entropy is a measure of quantifying the imbalance degree of thermostate. In mathematics, entropy is used to measure the uncertainty of problems. While in information science, entropy is the average uncertainty of information source. In other word, entropy is a measure of irregularity of states such as imbalance, uncertainty. A method for measuring the entropy appears as an ideal tool for quantifying the ordering of non-stationary signals. Various wavelet entropy measures were defined in [10].In this paper, the non normalized Shannon entropy is used Since the power quality signals have the imbalance, the non-stationary, the different frequency component and the different energy distribution, Shannon entropy is used to extract the features from different power quality disturbance signals as a measurement of these irregularities. Let the disturbance signal be U= {Uj j=1,2,…….N}.The Shannon (non normalized) entropy of the jth point is represented as N SEj = ΣEjk log Ejk (5) k=1 where Ejk is the wavelet energy spectrum at scale j and instant k and is defined as follows. The wavelet energy spectrum for detail and approximation coefficients in each decomposition level is obtained from the wavelet multi-resolution analysis of different disturbances and can be calculated as follows: EDjk = | Dj(k)|2 (6) EAjk = | Aj(k)|2 (7) Where j=1,2,………..J EDjk and EAjk are the energy spectrum for detail and approximation coefficients respectively. Dj(k) is the detailed coefficients and Aj(k) is the approximation coefficients.
IV. FEATURE EXTRACTION USING WAVELET TRANSFORM The wavelet transform [12] can be interpreted as the inner product of the complex conjugate of wavelet function h*a,τ(t) and the input signal s(t) WT (a,τ) = ∫ h*a,τ(t) . s(t)dt
(1)
Where the wavelet function ha,τ(t) is defined as ha,τ(t) = a-1/2h(t-τ/a)
(2)
The variable a is the scale parameter of the wavelet function and is proportional to the reciprocal of the frequency, τ is the translation parameter and h is called the mother wavelet. A mother wavelet [14] is a function that oscillates, has finite energy and zero mean value. Normally, the mother wavelet that resembles the analyzed signal is the best choice, as this would reduce the number of non-zero Wavelet coefficients. Wavelet decomposition enables multi resolution analysis as a single signal can be broken down into multiple frequency bands. The goal of MRA is to develop representation of a signal at various levels of resolution. Figure 4.1 shows the two level decomposition of a signal x(n)
Fig 4.1Two level multilevel decomposition of a signal x(n)
MRA is composed of 2 filters in each level, which are low pass filter and high pass filter. The scaling function is associated with the low pass Filter with the filter 592
International Journal of Computer and Electrical Engineering, Vol. 1, No. 5 December, 2009
1793-8163 VII. SIMULATION RESULTS
Where J represents the total number of resolution levels. The extracted features help to distinguish a disturbance signal from another. The frequency bands with higher entropy values, which contain useful information are selected from the entropy distribution of the wavelet detailed coefficients and the remaining frequency bands with zero entropy values are rejected.
This section presents the details of the simulation carried out on a sample power system to classify the transient waveforms. The model network shown in the fig 7.1 has been used to simulate the various disturbances in the system. The system was modeled using power system block set in Matlab/Simulink software. Transient analysis of a linear circuit
i -
+
VI.
RADIAL BASIS NEURAL NETWORKS
Rs
RL1
Load current
Breaker
Scope
150 km transmission line
The schematic diagram of RBF neural network is shown in figure 6.1.The RBF network [9] has an input layer, a hidden layer consisting of Gaussian node function, a set of weights W, to connect the hidden layer and output layer. The transfer functions in the nodes are similar to the multivariate Gaussian density function, Φj(x) = exp(-║x-μj║2/2σj2)
Ls
132.8 kV rms 60 Hz
C1
RL Load 75 MW 20 Mvar
C2
v2
+ v -
V2
Line voltage
v1 V1
?
Continuous
Double click here for details
clk Clock
Clock1
Fig 7.1 Test system for generation of power system transients
(8) The different types of transients were generated by creating various faults such as single line to ground faults, double line to ground faults and using capacitor switching circuits at different points. The signals generated in this way are found to be very close to the real situation. Training samples were obtained from different locations in the system in an attempt to simulate a variety of possible monitoring locations. This provides a wide range of variety of disturbances, since samples were taken from different locations. Totally 600 samples for each class were generated, out of which 300 was used for training and the remaining 300 for testing. Both the training and testing signals are sampled at 256 points/cycle and the normal frequency of 50 Hz. The features are extracted from these disturbance signals by finding the wavelet transform of the signal and applying MRA technique. The approximations and the detailed coefficients are obtained from the wavelet transform of the signal using ‘db4’ mother wavelet. From these features, the desired features are selected by using Shannon entropy method. Figures 7.2 to 7.4 show the entropy distribution pattern for the different types of transients. It is observed from fig 7.2 that, the oscillatory transient shows more entropy being distributed among the lower frequency bands (levels 5,6 and 7) whereas the entropy value for levels 1,2,3,4 and 8 is approximately zero.
Where x is the input vector, μj and σj are the center and spread of the corresponding Gaussian function. Each RBF unit has a significant activation over a specific region determined by μj and σj. Thus each RBF represents a unique local neighborhood in the input space. The connections in the second layer are weighted and the output nodes are linear summation units. The value of kth output node yk is given by h yk(x) = Σwkj Φj(x ) +wk0 (9) j=1 where wkj is the connection weight between the kth output and the jth hidden node and wk0 is the basis term.
Fig 6.1 Schematic diagram of RBF neural network
oscillatory transient
593
20 10 0 -10 -20 -30
0
0.02
0.04
0.06
0.08
0.1
0.12
0.14
0.16
0.18
0.2
Entropy distribution of oscillatory transient 1.5
Entropy
The training of RBF is done in three sequential stages. The first stage of the learning consists of determining the unit centers μj by the k-means clustering algorithm. Next, the unit widths σj are determined using a heuristic approach that ensures the smoothness and the continuity of the fitted function. The width of any hidden node is taken as the maximum Euclidean distance between the identified centers. Finally, the weights of the second layer connections are determined by linear regression using a least squares objective function. RBF Neural Networks (RBFNN) [11] can be viewed as alternative tool for learning in neural networks. While, RBFNN exhibit the same properties as back propagation networks such as generalization ability and robustness, they also have the additional advantage of fast learning and ability to detect outliers during estimation.
1
0.5
0
1
2
3
4
5
6
7
8
levels
Fig 7.2 Oscillatory transient and its entropy distribution
International Journal of Computer and Electrical Engineering, Vol. 1, No. 5 December, 2009
1793-8163 It is seen from figures 6.5 to 7.7 that, maximum entropy for oscillatory transient is 3.5, the minimum entropy for impulse transient is -60,where as for transient due to fault, it is -9 which clearly distinguishes the different transients. Similarly, the entropy values for each resolution level of each transient signal vary accordingly. It is also observed from the figures 7.5 to 7.7 that, the entropy values for the resolution levels 1 , 2 and 3 is approximately zero. Hence the remaining levels (i.e., level 4,5,6,7 and 8) contain useful information and are selected as input features of the neural network. The selected features are given to the RBF network for training. After training, the networks are tested with the test data. The classification results during training and testing are shown in the table I and table II.
transient due to fault 20 10 0 -10 -20
0
0.01
0.02
0.03
0.04
0.05
0.06
Entropy distribution of transient due to fault 2
Entropy
1.5 1 0.5 0
1
2
3
4
5
6
7
8
levels
Fig 7.3 Transient due to fault and its entropy distribution
From fig 7.3 it is seen that the maximum value of entropy for transient due to fault is concentrated in level4. impulsive transient 100 50 0 -50 -100
0
0.1
0.2
0.3
0.4
0.5
0.6
0.7
TABLE I RESULTS USING WAVELET ENTROPY BASED RBFNN AND BPNN
0.8
Entropy distribution of impulsive transient
Entropy
50
0
ANN type
Training error
Testing error
Training Time (sec)
Accur acy
RBFNN
0.0095
0.1950
4.2
99.3%
BPNN
0.2009
0.2155
16.5
95%
-50
-100
1
2
3
4
5
6
7
8
levels
Figure 7.4 impulse transient and its entropy distribution
As shown in fig 7.4, for impulsive transient, the minimum entropy is confined to the mid frequency band (level 4). The Shannon entropy for the detailed coefficients for the set of three types of transients analyzed with the db4 wavelet for 8 levels are shown in figures 7.5 to 7.7.
TABLE II RESULTS USING WAVELET BASED RBFNN AND BPNN
ANN type
Training error
Testing error
Training Time (sec)
Accuracy
RBFNN
13.28
0.7839
7.31
78%
BPNN
0.1556
2.1574
17.2
70.7%
Entropy for oscillatory transient 4 2 0
Shannon entropy
-2 -4 -6
A comparison in terms of classification accuracy between the results of entropy based RBF network and the results of classification using wavelet based neural classifier is made. Similarly, the results using RBFNN classifier and Back Propagation Feed forward Neural Network (BPFNN) classifier are compared. It is observed from table I and II that, the entropy based RBFNN classier provides best performance with the accuracy of 99.3%.
-8 -10 -12 -14
1
2
3
4
5
6
7
8
levels
Fig 7.5 entropy for a set of oscillatory transients Entropy for impulse transient 20 0 -20
Shannonentropy
-40 -60
TABLE III RESULTS OF RBFNN BEFORE AND AFTER APPLYING FEATURE SELECTION Trainig Training Testing RPF No.Of Time featurs Error error Accuracy NN (sec) After Feature 5 0.0095 0.1950 4.2 99.3% Select-ion before Feature 8 0.1295 0.20 5.8 96.2% Select-ion
-80 -100 -120 -140 -160
1
2
3
4
5
6
7
8
levels
Fig 7.6 entropy for a set of impulse transients Entropy for transient due to fault 4
2
Using RBFNN, the computation time is also reduced. It is clear from the table 1 that, the training time required for RBFNN classifier is one fourth of the training time required for Back Propagation neural Networks (BPNN) classifier and the generalization capability of the RBFNN is also better than BPNN. The comparison between the results of the RBFNN with and without feature selection is shown in table III. From table 3, it is evident that, using the wavelet entropy
Shannon entropy
0
-2
-4
-6
-8
-10
1
2
3
4
5
6
7
8
levels
Fig 7.7 entropy for a set of transients due to fault
594
International Journal of Computer and Electrical Engineering, Vol. 1, No. 5 December, 2009
1793-8163 Summer Meet 2 (2001) 1246-1251. A. Elmitwally, S. Fargal, M. Kandil, S. Abelkader, M. Elkatab, ” Proposed neurons fuzzy combined System for power quality violation detection And diagnosis”, Proc. Of Inert.Conference Elecrtical. Engg.Generation. TransmissionDistribution volume 148 Pp 15-20 Jan 2001. [6] Safavian. L. S. Kinsner. W, Turanli. H, Classification of transients in power systems Using multi fractal analysis”, Canadian Conference on Electrical and computer Engg. 2004 volume 3 issue, 2-5 May 2004 pp 1445-1448. [7] N.P. Subramoniam, K. Boopathy Bagan,” Analysis of high impedance transients and Improved data compression using wavelet Transform”, Serabian Journal of electrical Engineering volume 3 No.1,June 2006,19-31. [8] R. Samantaray, P. K. Dhas, G. Panda, ” Power System events classification using pattern Recognition approach”, International Journal of Emerging Electric Power systems voumel 6 Issue 1 (2006) article5 . [9] D. Devaraj, J. Preetha Roselin, R. Uma Rani, ”Artificial Neural Network model for voltage Security based contingency ranking”, Journal Of Applied soft computing (2006). [10] MATLAB. Natick, M.A:Math Works, Inc., 2000. [11] Hanoch Lev, Aleksander. M. Stankovic, S.Lin, ”Application of staggered under sampling to Power quality monitoring, ”, IEEE Trans. Power Delivery vol 15 No.3 July 2000. [12] Z.L. Gaing, ”Wavelet based neural network for Power disturbance recognition and Classification,” IEEE Trans. Power Delivery vol.19, No.4,pp. 1560-1568, Oct 2004. [13] [13] Haibo He, Janus and A. Starzyk, “ A self Organizing learning array system for Power Quality Classification based on Wavelet Transform”, in IEEE Trans. Power Delivery, vol 21 No.1 pp 286-294 Jan 2006. [14] Rioul, O. and Vetterli, M., “ Wavelets and Signal Processing”, IEEE Tran. Signal Processing, vol-8, pp.14-38, 1991.
based feature selection technique, the feature size is reduced as well as the training time; training and testing error are also less compared to the RBFNN without feature selection. Similarly, the accuracy of the RBFNN with feature selection is 99.3%, while for the other case, it is less. The feature vectors before and after applying feature selection scheme shown in figures and0.187.9.0.2 0 0.02is 0.04 0.06 0.08 0.1 0.12 7.8 0.14 0.16
[5]
Entropy distribution of oscillatory transient
Entropy
1.5
1
0.5
0
1
2
3
4
5
6
7
8
levels
Fig 7.8 Distribution of input features before applying feature selection 0.08
0.1
0.12
0.14
0.16
0.18
0.2
Entropy distribution of oscillatory transient
4
5
6
7
8
levels
Fig 7.9 Distribution of input features after applying feature selection
From fig 7.8, it is seen that the number of feature vectors is 8. i.e., the information present in levels 1 to 8.But there is no information present in levels 1, 2 and 3.That is, the entropy value for levels 1, 2 and 3 is zero. Thus it is not necessary to give all the 8 features to the input of the neural network. The levels with only non zero entropy values are selected as input features. Hence, after applying feature selection technique, the number of features is reduced to 5 (i.e., levels 4 to 8) which is shown in fig 7.9. which reduces the memory space and increases the computation speed.
T. Jayasree has received her BE degree in Electronics and Communication Engineering in 1997 from Bharathidasan university, Trichy, India and M.E degree in Applied electronics in 1999 from Bharathiyar University .Coimbatore ,India .From 1999 to 2005, she worked as lecturer in Noorul Islam College of Engineering, Nagercoil, India. From 2006 to till now, she is a lecturer in Govt. Polytechnic College, Tuticorin, India and pursuing her Ph.D. degree at Anna university, Chennai, India. Her research interests are Applications of Computational Intelligent Techniques, Power quality mpnitoring, Signal processing.
VIII. CONCLUSION In this paper, a neural network based method is proposed for automatic power system transient classification. The input features of the neural network are extracted using wavelet transform and Shannon entropy method is used to select the relevant features. Radial Basis Function neural network is used for classification. Simulation has been carried out on a sample power system to demonstrate the effectiveness of the proposed approach for transient waveform classification. The most important advantage of the proposed method is the reduction of data size as well indicating the main characteristics of signal without losing its distinguishing characteristics. Further, it reduces the memory requirement and increases computation speed.
D.Devaraj has received his B.E and M.E degree in Electrical and Electronics Engineering and Power System Engineering in 1992 and 1994 respectively from Madurai Kamaraj University, Madurai, India. From 1994 to 1997, he worked as a Lecturer in Arulmigu Kalasalingam College of Engineering, Krishnankoil. He received his PhD degree from IIT Madras, Chennai, in 2001. He is currently a Professor and Head of the Electrical and Electronics Engineering Department in Arulmigu Kalasalingam College of Engineering, Krishnankoil.India. His research interest includes Applications of Computational Intelligent Techniques, Power System Optimization, Power System Security, Fault Diagnosis and Data Mining. He has published many journal and conference publications in subject of his interests.Besides, D. Devaraj (Dr) is a Director-Power System Group, TIFAC-CORE in Network Engineering sponsored by Government of India. He is a member of Indian Society of Technical education,India.
REFERENCES G.T.Heydt, P. S. Fjeil, ”Application of windowed FFT to electric power quality assessment”, IEEE Trans on power delivery 14 (4) vol 4(1999) pp.1411-1416. [2] A.M. Gaouda, M. M.A. Salama, M. R. Sultan, A.Y.C. Hittani, “Power Quality detection and Classification using Wavelet Multi Resolution Signal decomposition”, IEEEtransaction on Power Delivery 14(4) (1999) 1469-1476. [3] He.J. A. Starzyk, “A self organizing learning Array system for power quality classification Based on wavelet transform”, IEEE Trans Power delivery 21 (1) (2006) 286-295. [4] M. Wang, A. Mamishev,” A classification of Power quality disturbances using time Frequency ambiguity plane and neural Networks”, IEEE power Engineering Soc
[1]
595
R.Sukanesh has received her B.E degree in Electronics and Communication Engineering from Madras University, Chennai, India in 1982 and M.E degeree with the specialization in communication Systems in 1985 from Bharathiyar University, Coimbathore, India. He received his PhD degree from Madhurai Kamaraj University, Madurai in 1999. From 1985 to 1991, she worked as a Lecturer in Thiagaraja College of Engineering, Madurai, India.. She is presently working as a Professor in Thiagaraja College of Engineering, Madurai. Her research interest includes Bio-Medical signal processing,image processing and neural networks. R.Sukanesh (Dr) is a member of Bio-Medical society of India (BMESI). She also a member of Institution of Engineering , Indian Society of technical education (ISTE) and Indian Association of Bio-Medical scientists (IABMS).