Clustering navigation patterns on a website using a. Sequence Alignment Method. Birgit Hay, Geert Wets and Koen Vanhoof. Limburg University Centre, Faculty ...
Clustering navigation patterns on a website using a Sequence Alignment Method Birgit Hay, Geert Wets and Koen Vanhoof Limburg University Centre, Faculty of Applied Economic Sciences, B-3590 Diepenbeek, Belgium {birgit.hay;geert.wets;koen.vanhoof}@luc.ac.be Abstract In this paper, a new method is illustrated to cluster navigation patterns on a website. Instead of clustering users by means of a Euclidean distance measure, in our approach users are partitioned into clusters using a Sequence Alignment Method. This method ensures that sequential relationships, which are captured in the data, are taken into account. The performance of the algorithm is compared with the results of a method based on Euclidean distance measures. The proposed method is validated using usertraffic data from a Belgian telecom provider. Empirical results show that the method extracts sequences with similar behavioural patterns not only with regard to content but also considering the order of pages that are visited in a sequence.
1
Introduction
Selling products and services through the web has become a lucrative business today. Marketing concepts and a clear understanding of visiting behaviour of customers and prospects on our website are important aspects to support commercial business through the Internet. In order to acquire a strong competitive advantage it is essential to be focused on new technologies, which are more powerful than the already existing ones. Web Mining combines three active research areas: Web Content Mining, Web Structure Mining and Web Usage Mining. In the first area, “the learning and inference is predominantly based on the content of pages and links, and not strictly on the behaviour of users” [Cooley et al., 1999a]. In the second area, structural information about hyperlinks and organisation of web pages is obtained. Finally, research in Web Usage Mining focuses on analysing visiting information from logged data in order to extract usage patterns. In Web Usage Mining, different techniques are used to mine the information from the logged data. For example, in [Cooley et al., 1999a] the WebMiner system is introduced for information pattern discovery on the World Wide Web. The system automatically discovers user access patterns from one or more web servers through several discovery techniques. In [Cooley et al., 1999b], the
WebSift system identifies interesting patterns from web usage data through a Beliefs with Mined Evidence (BME) and a Beliefs with Contradicting Evidence (BCE) algorithm. In [Spiliopoulou and Faulstich, 1998], a Web Utilization Miner (WUM) is presented for the discovery of interesting navigation patterns. The system consists of two modules. The Aggregation Service prepares the logged data for mining while the MINT-Processor performs the mining. A specific research topic in Web Usage Mining is clustering of navigation patterns. [Mobasher et al., 2000] consider two types of usage patterns and cluster them to build profiles based on navigational behaviour. However, order of access is not taken into account. In [Fu et al., 1999], access patterns are clustered on a generalization-based clustering approach. The method uses attribute-oriented induction and sessions are represented by vectors. Euclidean distances between the sessions are calculated and used as a basic distance measure for clustering. In [Cadez et al., 2000] navigation patterns on a web site are visualized using model based clustering. The method is implemented in a tool called WebCANVAS and takes into account the order of elements in a sequence. However little work has been found concerning the problem of clustering users based on their web navigation patterns. Moreover, concerning the problem of clustering users based on their web navigation patterns using a measure that incorporates the order of elements, except for [Cadez et al., 2000], no prior work has been found. In this study we will concentrate on clustering navigation patterns on a web site using a method that well reflects structural information (represented by the order of elements) within sequences. To this end, in this article we will introduce the Sequence Alignment Method (SAM) for clustering users based on their web navigation patterns. The SAM measures (dis)similarities between sequences and takes into account the sequential order of elements in a sequence. Moreover, the SAM distance measure between two sequences reflects the operations necessary to equalize the sequences. The higher the distance measure or score, the less equal the sequences are and vice versa. The method is validated using user-traffic data from a Belgian telecom provider. Furthermore, the method is compared with a common used distance measure called association measure, which is a
Euclidean based method and does not incorporate structural information [Everitt, 1980].
dSAM (S1, S2) = (wdD + wiI) + ηR
1
where: The article is organized as follows. First, two techniques for measuring distances between sequences are described: the SAM (non-Euclidean based) and the association measure (Euclidean-based). Then we illustrate the results of the empirical analysis using a real data set of a Belgian telecom provider. Finally, the article is concluded and topics for further research are outlined.
2
Techniques
In this section we will describe two techniques for measuring distances between sequences. First, the Sequence Alignment Method is given. Then the association method for sequence comparison is reported.
2.1 Sequence Alignment Method The Sequence Alignment Method is a non-Euclidean distance measure reflecting the order of elements and used in several research domains. The SAM [Sankoff and Kruskal, 1983], also called string edit distance, is used for sequence comparison molecular biology and speech recognition. A sequence is defined as a number of elements, objects or events arranged or coming one after the other in succession. Likewise, in [Manilla and Ronkainen, 1997] edit distance is described as a distance measure between event sequences. Also in traffic analysis studies the method is used to discover navigation patterns [Joh et al., 2000a; Joh et al., 2000b]. In this section we give a short overview of the algorithm. A more detailed explanation can be found in [Sankoff and Kruskal, 1983]. In general, the distance (or similarity) between sequences is reflected by the amount of work that has to be done to convert one sequence to another. As a result, the SAM distance measure is represented by a score. The higher/lower the score, the more/less effort it takes to equalize the sequences. In addition, the SAM scores for the following operations during the equalization process: insertion, deletion and reordering. Insertion and deletion operations are applied to unique elements; the reordering operation is applied to common elements. Common elements are elements, which appear in both compared sequences whereas unique elements appear in either one of the two compared sequences. Moreover, a change in the order of elements is called a reordering operation. Note that a change only in the positions of elements without a change in the order of elements is not called a reordering operation. In particular, the SAM distance measure between two sequences S1 and S2 is calculated using the following formula [Joh et al.,2000a; Sankoff and Kruskal, 1983]:
dSAM is the distance between two sequences S 1 and S 2, based on SAM; wd is the weight value for the deletion operations, a positive constant not equal to 0, determined by the researcher (wd>0); wi is the weight value for the insertion operations, a positive constant not equal to 0, determined by the researcher (wi>0); D is the number of deletion operations; I is the number of insertion operations; R is the number of reordering operations; η is the reordering weight, a positive constant determined by the researcher (η>0); Equation 1 indicates that the score, represented by the SAM distance measure between two sequences, consists of the costs for deleting and inserting unique elements and the costs for reordering common elements. The calculation of SAM distance measures between sequences is a combinatory problem. In practical applications, dynamic programming algorithms are used to resolve combinatory problems [Joh et al., 2000a; Mannila and Ronkainen, 1997; Wilson, 1998]. For multidimensional SAM distance measures, for example when sequences are compared with regard to pages and other information types such as time spent on pages, optimal trajectories of operation sets are found using heuristics [Joh et al., 2000b]. Notice that, for this project, the sequences are represented by server sessions and the elements stand for visited web pages. A server session or visit is defined as the click-stream of page-views for a single visit of a user to a website [Cooley, 2000]. To illustrate the SAM, consider the following sequences: Suppose: wd=wi=1 and η=wd+wi (s1, 1, 2, 45, 27, 28, 112) (s2, 1, 45, 27, 2, 28, 2) The server sessions s1 and s2 have five common elements (1, 2, 45, 27 and 28) and one unique element (112). Element 2 needs to be reordered. The result of this reordering operation is five identities and two unique elements (112 and 2). Remark that element 2 is now considered as a unique element because identities have been formed between every element of the source and target sequence, except for elements 112 (at position 6 of s1) and 2 (at position 6 of s2). The deletion (2, -) in sequence 1 and insertion (-, 112) in sequence 2 are furthermore necessary to equalize sequence 1 with sequence 2. Applying equation 1, we obtain a distance measure of 4.
2.2 Association measure A common used distance measure between sequences is the association measure [Everitt, 1980]. The method is Euclidean-based and does not take into account the order of elements within the sequences. A simple form of association measure for analysing data in nonmetric terms will transform each sequence into a vector and counts the number of dissimilarities at each position of the sequence. Missing values in either one of the compared sequences are treated as a dissimilarity. In particular, the distance between two sequences based on the association measure is presented with the following formula: n
dASS (S1, S 2) = Σ fi
2
i=1
with
fi = 1 fi = 0
if S 1 (i) ≠ S2 (i) otherwise
where dASS is the distance between two sequences, S 1 and S 2, based on the association measure; n
Σ fi is the sum of dissimilarities between sequences S1 and i=1 S2 from positions i to n; n is the number of positions of S 1 or S2 if the sequences are of equal length, otherwise n is equal to the number of positions of the longest sequence; For example, the distance between sequences s1 and s2, given in the previous subsection, will be 4 based on the association measure.
3
Empirical Analysis
3.1 Proposed Approach The empirical analysis reported in this paper concerns the question whether the structural information (sequential relationships or order of elements) embedded in webclickstream data is well reflected by the SAM and whether the incorporation of the structural information affects the final cluster solution. Hence, we first calculate pair wise distances between sequences representing sequentially ordered visited web pages using SAM as a distance measure. The SAM is used in its most common and simplest way. This means that a score of 1 is used for insertion/deletion operations. Since reordering, in general, represents an insertion operation (into the target sequence) and a deletion operation (into the source sequence), the score is doubled for a reordering operation. In order to compare the SAM with a method that does not incorporate structural information of web pages, pair wise distances
between the same sequences are calculated using the association measure which is a common used, nonEuclidean distance measure. Then the pair wise distances based on SAM are structured into a matrix. Furthermore, the association based pair wise distances are inserted into a second matrix. Finally, we examine which cluster solution better discriminates between the structural characteristics, represented by the order of visited pages, of navigation patterns. To this end, a hierarchical clustering algorithm is used and invoked on the matrices representing the SAMand association distance measures respectively. Because this study is focused on SAM, no special attention is given to the clustering method. Therefore, a simple method for hierarchical clustering like Ward’s method [Hair et al., 1998] is used. Further research will include the exploration of other clustering methods. The resulting clusters are analysed by examining the pages and the sequential order of the pages in the clusters. To this end, we will use open sequences as a measure to define navigation patterns in clusters. In [Büchner et al., 1999], open sequences are used for discovering structural information within navigation patterns. In general, sequences with the same elements occurring in the same order and irrelevant of the positions of the elements are called open sequences. For example, the open sequence (1, 3, 5) occurs in the sequences (4, 1, 2, 3, 6, 5), (1, 2, 3, 4, 2, 5) and (3, 1, 3, 5, 2).
3.2 Data For this project, log files of a Belgian telecom provider collected over a one-week period are used. In order to analyse visiting behaviour on a website, sessions of webclickstream data must be identified. A server session or visit is defined as the click-stream of page-views for a single visit of a user to a website [Cooley, 2000]. In this paper, we will use server session and visit interchangeably. First, the data stored in the log files are cleaned in such a way that URL page requests of the form ‘GET….html’ are maintained. Then a unique code is given to each distinct ip-address and URL. Third, sessions are identified using a threshold of 30 minutes viewing time. This means that, with the same ipaddress, a new session starts when the time between two page requests is more than 30 minutes. In general, a session is created when a new ip-address is met in the log file. Finally, server sessions are built in the form of (session-id, {}) representing consecutive pages requested by the same user. For example, a visit (s1,1,2,45,27,28,112) tells a user enters the website through page 1, then visits pages 2, 45, 27 and 28, and finally exits the website when page 112 has been viewed.
358) that is found, before clustering, in 85 sequences. 84 of the 85 sequences are grouped into cluster 3, resulting in a confidence value of 98.82%.
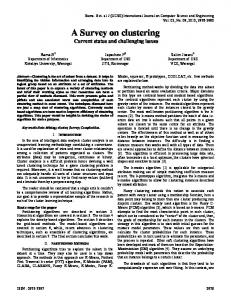
3.3 Results The resulting clusters are analysed by examining the pages and the sequential order of the pages, using open sequences as a measure for structural information within each cluster. C represents the number of clusters where hierarchical clustering stops processing. When SAM is used as a distance measure, we found a good solution when C is equal to three. Figure 1 presents a graphical overview of the visited web pages in each cluster for the 3-group clustering solution. On the horizontal axis the code of the web page is given, the frequency of the pages is presented vertically.
Open sequence
(281, 280) (281, 280, 355) (28, 27) (492, 491) (281, 280, 355, 492) (28, 27, 109) (28, 27, 109, 250) (281, 280, 355, 492, 491) (28, 27, 109, 250, 113) (28, 27, 109, 250, 113, 249) (281, 280, 355, 492, 491, 358) (113, 250, 249) (305, 286, 317) (196, 186, 194) (109, 192) (224, 242, 230)
Three profiles are discovered. The first group contains navigation patterns of web pages ranging from 1 to 250. This group of pages is presented on the web in French language. On the other hand, navigation patterns of web pages ranging from 251 to 492 are clustered into the third group, representing visits to the website of Dutch pages. Finally, another group of server sessions represents navigation patterns of web pages in both languages.
300
30
300
200
20
200
51 26
101 76
PAGE_ID
151 126
201 176
251 226
301 276
351 326
401 376
451 426
Value FREQ
400
1
10
0 1
476
51 26
101 76
151 126
5.26 4.18 5.24 3.00 1.03 3.95 0.62 0.00 0.00 0.00 0.00 2.70 43.37 26.67 16.67 33.34
Cluster 3
40
Value FREQ
Value FREQ
Cluster 2
400
0
2.43 2.33 91.90 3.00 2.06 93.78 97.50 2.00 98.55 97.75 1.18 97.30 0.00 66.67 83.33 66.66
201 176
251 226
92.31 93.49 2.86 94.00 96.91 2.27 1.88 98.00 1.45 2.25 98.82 0.00 56.63 6.66 0.00 0.00
Yet, in the second cluster open sequences are found with a relative low confidence value. We also discovered that server sessions grouped into cluster 2 are very short of length. The average length of the sessions is equal to 5.06 compared to 22.60 for cluster 1 and 21.33 for cluster 3. This means that, if we compare the sessions of cluster 2 with those of cluster 1 or 3, using SAM, many operations are necessary due to a high difference in length between the sequences. Consequently, a high distance measure is obtained. On the other hand, a relative low SAM distance measure is calculated between sequences within cluster 2 due to the short sequence length. We observe that the visitor sessions grouped in cluster 2 are navigation patters that occur rarely or are very short of length.
In cluster 1 and 3, open sequences are found with a high confidence value. For example, the open sequence (28, 27, 109, 250, 113, 249) is found in 89 server sessions in the database before clustering. After clustering, we discover that 87 out of 89 sequences are grouped together into the first cluster, which gives a confidence value of 97.75%. The same is true for the open sequence (281, 280, 355, 492, 491,
100
31.95 27.81 27.17 25.87 25.09 22.90 20.70 19.79 17.85 11.50 11.00 4.78 2.45 1.94 0.77 0.39
Table 1. Open sequences, representing sequentially ordered visited web pages, found in clusters 1, 2 and 3 when SAM is used as a distance measure.
Navigation patterns are also clustered with regard to the order of visited pages. Table 1 lists some of the open sequences found during cluster analysis, with their support and confidence values. The support value is defined as the number of sequences in the input file containing the open sequence divided by the total number of sequences in the input file. Furthermore, the confidence value is equal to the number of sequences within a cluster containing the open sequence divided by the number of sequences in the input file representing the open sequence.
Cluster 1
Confidence (%) Cluster 1 2 3
Support (%)
301 276
351 326
401 376
0 1
451 426
100
476
PAGE_ID
Figure 1. Visited web pages in cluster 1, 2 and 3 when SAM is used as a distance measure.
51 26
101 76
PAGE_ID
151 126
201 176
251 226
301 276
351 326
401 376
451 426
476
When the association distance measure is used, the interpretation of the navigation profiles is not so straightforward as when SAM is used. We discovered that, based on the association distance measure, server sessions are not clustered with regard to the content of web pages nor with regard to the order of the pages. For comparison reasons, Figure 2 presents a graphical overview of the visited web pages in each cluster with C equal to 3, based on the association distance measure. In order to compare structural information of navigation patterns within each cluster, confidence and support values of the open sequences presented in table 1 are calculated for the clusters based on the association measure (with C=3). The results are given in table 2. Open sequence
Support (%)
(281, 280) (281, 280, 355) (28, 27) (492, 491) (281, 280, 355, 492) (28, 27, 109) (28, 27, 109, 250) (281, 280, 355, 492, 491) (28, 27, 109, 250, 113) (28, 27, 109, 250, 113, 249) (281, 280, 355, 492, 491, 358) (113, 250, 249) (305, 286, 317) (196, 186, 194) (109, 192) (224, 242, 230)
31.95 27.81 27.17 25.87 25.09 22.90 20.70 19.79 17.85 11.50 11.00 4.78 2.45 1.94 0.77 0.39
Web Usage Mining studies. The SAM is a non-Euclidean distance measure and compares sequences with regard to the content and the order in which the elements occur. Experiments on a real data set show that clustering server sessions, based on the SAM distance measure, results in groups of sessions having the same visited pages. Two profiles are discovered representing structural visiting information of French pages and Dutch pages. A third profile consists of navigation patterns in both languages, representing navigation patterns occurring rarely or patterns that are very short of length. However, if visitor sessions are clustered based on the association distance measure, which is a non-Euclidean distance measure, we could not identify the same profiles with regard to pages visited within each cluster. Also, the method was unable to group sessions together based on the order of pages. The different profiles based on the association distance measure were not so obvious compared to the profiles when SAM was used. We therefore conclude that the SAM is a better method to reflect structural information (sequential relationships and order of elements) embedded in web-clickstream data.
Confidence (%) Cluster 1 2 3 42.91 41.86 56.19 45.50 43.30 58.19 60.62 45.10 60.15 52.80 45.88 35.13 15.79 26.67 33.33 33.33
34.41 33.49 25.71 30.50 31.44 23.73 21.25 30.06 19.56 22.47 22.35 10.81 52.63 26.67 16.67 33.33
22.68 24.65 18.10 24.00 25.26 18.08 18.13 24.84 20.29 24.73 31.77 54.06 31.58 46.66 50.00 33.34
To confirm our finding, the method should also be examined using other clustering algorithms and criteria to find the optimal clustering solution. In addition, the strength of the SAM will further be tested using different sets of parameters. For example, the effect of a reordering weight of 4 instead of 2 will be evaluated on the clustering results. Furthermore, the method may be elaborated using not only parameters for operations but also for pages. In order to examine the influence of operation weights and weights of pages more tests are necessary. Finally, the SAM may be enlarged from a uni-dimensional to a multi-dimensional non-Euclidean algorithm for clustering navigation patterns on the web. In the multidimensional SAM, sequences are compared taking not only pages into account but also other dimensions (e.g., time spent on pages).
Table 2. Open sequences, representing sequentially ordered visited web pages, found in clusters 1, 2 and 3 when the association measure is used as a distance measure.
4
Conclusions and Further Research
In this paper, the Sequence Alignment Method (SAM) is introduced as a distance measure between server sessions in
Cluster 1
Cluster 2
200
Cluster 3 140
120
120
100
100
80 80 100
60 60
0 1
51 26
101 76
PAGE_ID
151 126
201 176
251 226
301 276
351 326
401 376
451 426
Value FREQ
Value FREQ
Value FREQ
40
20
0 1
476
51 26
101 76
PAGE_ID
151 126
201 176
251 226
301 276
351 326
401 376
20 0 1
451 426
40
476
51 26
101 76
151 126
201 176
251 226
PAGE_ID
Figure 2. Visited web pages in cluster 1, 2 and 3 when the association measure is used as a distance measure.
301 276
351 326
401 376
451 426
476
References
[Joh et al., 2000a] C.-H. Joh, T. A. Arentze and H. J.P. Timmermans. A position-sensitive sequence alignment method illustrated for space-time activity diary data, forthcoming.
[Büchner et al., 1999] A.G. Büchner, M. Baumgarten, S.S. Anand, M.D. Mulvenna and J.G. Highes. Navigation Pattern Discovery from Internet Data. ACM Workshop on Web Usage Analysis and User Profiling (Webkdd), San Diego, USA, 1999.
[Joh et al., 2000b] C.-H. Joh, T. A. Artentze, F. Hofman and H. J.P. Timmermans. Activity Pattern Similarity: a Multidimensional Sequence Alignment Method, Transportation Research B, to appear.
[Cadez et al., 2000] I. Cadez, D. Heckerman, C. Meek, P. Smyth and S. White. Visualization of Navigation Patterns on a Web Site Using Model Based Clustering. Technical Report University of California, March 2000.
[Mannila and Ronkainen, 1997] H. Mannila and P. Ronkainen. Similarity of Event Sequences. In Proceedings of the Fourth International Workshop on Temporal Representation and Reasoning, pages 136-139, Florida, USA, 1997. TIME, IEEE Computer Society.
[Cooley, 2000] R. Cooley. Web Usage Mining: Discovery and Application of Interesting Patterns from Web Data. University of Minnesota http://wwwusers.cs.umn.edu/~cooley/pubs.html.
[Mobasher et al., 2000] B. Mobasher, H. Dai, T. Luo, M. Nakagawa, Y. Sun, and J. Wiltshire. Discovery of Aggregate Usage Profiles for Web Personalization. Webkdd, Boston MA, USA, 2000.
[Cooley et al., 1999a] R. Cooley, B. Mobasher and J. Srivastava. Data preparation for Mining World Wide Web Browsing Patterns. Knowledge and Information Systems, 1(1): 5-32, 1999.
[Sankoff and Kruskal, 1983] D. Sankoff and J.B. Kruskal, editors. Time Warps, String Edits and Macromolecules: the Theory and Practice of Sequence Comparison. Addison-Wesley, Reading, MA, 1983.
[Cooley et al., 1999b] R. Cooley, P.-N. Tan and J. Srivastava. WebSift: The Web Site Information Filter System. In Proceedings of the Web Usage Analysis and User Profiling Workshop, August 1999.
[Spiliopoulou and Faulstich, 1998] M. Spiliopoulou and L.C. Faulstich. WUM : A Web Utilization Miner. EDBT Workshop WebDB98, Valencia, Spain, 1998. Springer Verlag.
[Everitt, 1980] B. Everitt. Cluster Analysis. Halsted Press, New York, USA, 1980. [Fraley and Raftery, 1998] C. Fraley, A. Raftery. How many clusters? Which clustering method? Answers via model-based cluster analysis. Computer Journal,volume (41): 578-588, 1998. [Fu et al., 1999] Y. Fu, K. Sandhu and MY. Shih. Clustering of Web Users Based on Access Patterns. In Proceedings of the Fifth ACM SIGKDD International Conference on Knowledge Discovery & Data Mining, San Diego, USA 1999. [Hair et al., 1998] J.F. Hair, R.E. Andersen, R.L. Tatham and W.C. Black. Multivariate Data Analysis. Prentice Hall, New Jersey, USA, 1998.
[Wang et al., 2000] X. Wang, J.T.L. Wang, K.I. Lin, D. Shasha, B.A. Shapiro and K. Zang. An Index Structure for Data Mining and Clustering. Knowledge and Information Systems, volume(2): 161-184, 2000. [Wilson, 1998] W.C. Wilson. Activity Pattern Analysis by means of Sequence-Alignment Methods. Environment and planning, A(30):1017-1038, 1998.