Proceedings of the 4th International Workshop on Compositional Data Analysis (2011)
CoDaPack 2.0: a stand-alone, multi-platform compositional software M. COMAS2, and S. THIÓ-HENESTROSA1 1
Universitat de Girona, Spain
[email protected] 2 Universitat de Girona, Spain
Abstract Historically CoDaPack 3D has intended to be a software of Compositional Data with an easy and intuitive way of use. For this reason from the beginning it has been associated to Excel, a software known and used for many people. However, over the years different versions of Excel and Windows have been appeared and CoDaPack has had to be adapted to these new versions due to some incompatibilities. For this reason, and also because of CoDaPack only works with Excel under windows, the Girona Compositional Data Group has decided to implement a new software with at least the same capabilities and the same profile of users but independent of any other software. The graphical user interface has three different areas: The variables area, the data area and the results area which has a textual output window and independent graphical output. Also, because the new CoDaPack is being developed under Java code, the final software is going to work in any platform having a Java Virtual Machine: Windows, Linux and other Unix based systems.
1. Introduction CoDaPack and its follower CoDaPack3D 1.x (Thió-Henestrosa and Martín-Fernández, 2005, 2006) have been the only user friendly software available on Compositional Data Analysis since its first apparition in the beginning of this century. This software ran as menus inside Excel under Windows operating system. As a Whole package only exists another software called Compositions (Van den Boogaart and Tolosana, 2008) but its use is not intuitive as it is a set of R routines. There are also other packages that perform specific methodology: robCompositions (Templ, 2010) about robust estimation for compositional data, and Compos Analysis (P. G. Smith 2004 and 2010) an Add-In for use with Microsoft Excel but it is not freeware and it is centred on MANOVA analysis. Finally, there is also a lot of software that draws ternary diagrams. One of the problems of the association of CoDaPack with Excel and Windows were that after every actualization of Excel and Windows versions CoDaPack had have to be adapted as some parts were not supported on new versions. Also, after one specific windows security update CoDaPack stopped working because some components were disabled. Another of the limitations of CoDaPack was that it only ran under Windows operating system and all users of Unix based systems couldn’t work with CoDaPack. Mainly due to both reasons we decided to reprogram CoDaPack in order not to depend on other software and to build more stable software. This new package, now called CoDaPack 2.0, is being developed under Java code and the final software is going to work in any platform having a Java Virtual Machine: Windows, Linux and Unix based systems including MAC OS. Also it is intended to be easy to use and oriented to a non expert-computer users. The Package is still in a developing phase and on CoDaWork’11 we present the first capabilities.
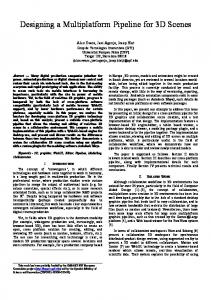
2. CoDaPack 2.0 structure CoDaPack 2.0 main window (Figure 1) has four main areas: Menus, variables, alphanumerical results and data. Also graphical outputs appear in independent windows. Egozcue, J.J., Tolosana-Delgado, R. and Ortego, M.I. (eds.) ISBN: 978-84-87867-76-7
1
Proceedings of the 4th International Workshop on Compositional Data Analysis (2011)
At this moment, the variables area is merely informative as only contains a list of the labels of the variables stored on the data part. In future version, direct access facilities are going to be available from this area. This window is useful if there is a lot of variables as it is easy to see their name and the order where they are placed.
Figure 1. CoDaPack 2.0 structure: Menus on very top, variables on left side, alphanumerical results on right top and data on left bottom.
The data part contains variables organized in columns. The window has and Excel like appearance but it doesn’t work as a spreadsheet as it can’t be edited. The data area is headed by a grey row that contains the label of the variables. Also each row is headed by a grey number that indicates the position. Variables could be numerical and alphanumerical but only alphanumerical are treated as categorical data. If a concrete data is a zero CoDaPack 2.0 distinguishes between non available data and non detected data. Non available data is a missing value or a structural zero and non detected data is a low value under detection limits. In this case it is useful to begin this data with a “