Journal of Alzheimer’s Disease 26 (2011) 395–405 DOI 10.3233/JAD-2011-0044 IOS Press
395
Combinatorial Markers of Mild Cognitive Impairment Conversion to Alzheimer’s Disease - Cytokines and MRI Measures Together Predict Disease Progression Simon J. Furneya , Deborah Kronenbergb , Andrew Simmonsa , Andreas Günterta , Richard J. Dobsona , Petroula Proitsia , Lars Olof Wahlundc , Iwona Kloszewskad , Patrizia Mecoccie , Hilkka Soininenf , Magda Tsolakig , Bruno Vellash , Christian Spengeri and Simon Lovestonea,∗ a King’s
College London, Institute of Psychiatry and National Institute of Health Research (NIHR) Biomedical Research Centre for Mental Health, London, UK b National Institute for Health Research (NIHR), Biomedical Research Centre Guy’s and St. Thomas’ NHS Foundation Trust and King’s College London, London, UK c Department of Neurobiology, Care Sciences and Society, Section of Clinical Geriatrics, Karolinska Institutet, Karolinska University Hospital, Huddinge, Stockholm, Sweden d Department of Old Age Psychiatry & Psychotic Disorders, Medical University of Lodz, Lodz, Poland e Section of Gerontology and Geriatrics, Department of Clinical and Experimental Medicine, University of Perugia, Perugia, Italy f Department of Neurology, University of Eastern Finland and Kuopio University Hospital, Kuopio, Finland g Third Department of Neurology, Aristotle University of Thessaloniki, Thessaloniki, Greece h Department of Internal and Geriatrics Medicine, Hôpitaux de Toulouse, Toulouse, France i Department of Clinical Science, Intervention and Technology, Karolinska, Institutet, Stockholm, Sweden
Abstract. Progression of people presenting with Mild Cognitive Impairment (MCI) to dementia is not certain and it is not possible for clinicians to predict which people are most likely to convert. The inability of clinicians to predict progression limits the use of MCI as a syndrome for treatment in prevention trials and, as more people present with this syndrome in memory clinics, and as earlier diagnosis is a major goal of health services, this presents an important clinical problem. Some data suggest that CSF biomarkers and functional imaging using PET might act as markers to facilitate prediction of conversion. However, both techniques are costly and not universally available. The objective of our study was to investigate the potential added benefit of combining biomarkers that are more easily obtained in routine clinical practice to predict conversion from MCI to Alzheimer’s disease. To explore this we combined automated regional analysis of structural MRI with analysis of plasma cytokines and chemokines and compared these to measures of APOE genotype and clinical assessment to assess which best predict progression. In a total of 205 people with MCI, 77 of whom subsequently converted to Alzheimer’s disease, we find
∗ Correspondence
to: Simon Lovestone, King’s College London, Institute of Psychiatry and National Institute of Health Research (NIHR) Biomedical, De, Crespigny Park, London SE5 8AF, UK. Tel.: +44 20 7848 0239/0550, Fax: +44 20 7848 0632; E-mail:
[email protected].
ISSN 1387-2877/11/$27.50 © 2011 – IOS Press and the authors. All rights reserved
396
S.J. Furney et al. / Cytokines and MRI as Prognostic Makers for MCI Conversion
biochemical markers of inflammation to be better predictors of conversion than APOE genotype or clinical measures (Area under the curve (AUC) 0.65, 0.62, 0.59 respectively). In a subset of subjects who also had MRI scans the combination of serum markers of inflammation and MRI automated imaging analysis provided the best predictor of conversion (AUC 0.78). These results show that the combination of imaging and cytokine biomarkers provides an improvement in prediction of MCI to AD conversion compared to either datatype alone, APOE genotype or clinical data and an accuracy of prediction that would have clinical utility. Keywords: Proteomics, MRI, mild cognitive impairment, Alzheimer’s disease, biomarkers
INTRODUCTION The challenge of the neurodegenerative diseases is daunting; it is estimated that the global prevalence of dementia will rise from 24.3 million cases in 2005 to 81.1 million cases in 2040 [1]. Alzheimer’s disease (AD) is the commonest form of dementia [2]. Rising to the challenge posed by this health burden, there are many potential disease modification therapies in development with approximately 10 compounds for AD in phase III and more than 50 in phase II [3]. There is a consensus that disease modification therapy is most likely to be efficacious very early in the disease process and because of this there is an increasing drive towards very early identification and diagnosis. Given the inherent difficulty of very early, and even prodromal, diagnosis, biomarkers are likely to play an important role. They are incorporated into the proposed revision of diagnostic criteria [4] for AD and have been increasingly examined for their potential to predict which people with mild cognitive impairment (MCI) are most likely to progress to full dementia [5]. This is important as only a minority with MCI progress to full dementia in the time frame of a typical clinical trial. A recent meta-analysis showed an annual conversion rate of 8.1% and a cumulative proportion of 33.6% for MCI conversion to AD [6] and in a previous systematic review we found study-related variables including recruitment strategy to be the most important factors predicting conversion [7]. The primary focus in the search for biomarkers for AD to date has been on neuroimaging, and on A and tau proteins in cerebrospinal fluid (CSF) [8, 9]. Various studies using structural MRI have identified brain regions within the medial temporal lobe, particularly the hippocampus and entorhinal cortex, as potential biomarkers of conversion from MCI to AD [10–14]. In addition molecular imaging using amyloid PET ligands also report efficacy as markers predictive of conversion [15]. CSF is an excellent fluid for biomarker discovery in neurodegeneration as it is
in direct contact with the extracellular space of the brain and is therefore supposed to reflect biochemical changes occurring in the brain [16]. Recently Shaw et al. showed in the US Alzheimer’s Disease Neuroimaging Initiative (ADNI) study that the t-tau/A1–42 ratio discriminated between those who will remain MCI subjects and those who will convert to AD within one year follow-up [17]. In addition it has been reported that MCI subjects with abnormal results on both FDGPET and episodic memory were more likely to convert to AD [18]. However, structural MRI is not sufficiently predictive of conversion [14, 19], PET imaging is a highly specialised approach available in relatively few centres, and lumbar puncture for CSF, although nontraumatic and without side effects in the majority of patients, necessitates a high level of skill and a hospital setting. A blood-based biomarker would be hugely advantageous especially in large-scale population and community based studies of elderly frail people. Previously we and others have demonstrated using proteomics that blood-based biomarkers were feasible and reproducible in independent studies [20–22]. However, the most impressive evidence for a specific and sensitive marker of MCI conversion to date comes from a study reporting that 18 signalling proteins in blood plasma could be used to predict conversion from MCI to AD 2–6 years later with an accuracy of 91% [23]. However these results have not yet been independently replicated. Recently, O’Bryant et al. developed a serum protein-based classifier for the prediction of AD patients and controls [24]. For the most part, these studies have concentrated on single modality biomarkers although there are theoretical reasons and increasing data from combinatorial studies to think that combining biomarkers might have added benefits [25–28]. Some studies have combined imaging with clinical variables to try to increase predictive power, with mixed results. One such study found no added benefit of combining structural MRI data with clinical measures [12] whereas another developed a predictor including three clinical predictors
S.J. Furney et al. / Cytokines and MRI as Prognostic Makers for MCI Conversion
(SRT immediate recall, FAQ and UPSIT) as well as two imaging markers (hippocampal and entorhinal cortex volume) [29]. Davatzikos et al. recently integrated MRI and CSF biomarkers and noted improved predictive accuracy compared to either individual data type [9] and Ewers et al. investigated the accuracy of MRI and CSF biomarkers and neuropsychological tests for predicting the conversion from MCI to Alzheimer’s disease [30]. However no study, to our knowledge, has investigated the potential added benefit of combining biomarkers that are readily obtained in routine clinical practice. To explore this we combined automated regional analysis of structural MRI with analysis of serum cytokines and APOE genotype to assess if the combination of data types improved prediction of progression in a small cohort of participants from the AddNeuroMed study, a European ADNI-like biomarker study [31]. In addition, we have examined the predictive accuracy of a cytokine panel in a larger dataset, which includes the AddNeuroMed cohort. MATERIALS AND METHODS Subjects The study population used in this report was derived from the AddNeuroMed study, a European multicentre study, aiming to identify biomarkers for AD [31] and the Alzheimer Research Trust–funded cohort at King’s College London (KCL-ART) [32]. The participating AddNeuroMed clinical centres were in Kuopio, Perugia, Lodz, Thessaloniki, Toulouse and London. Subjects were patients who attended local memory clinics and received a diagnosis of MCI. Diagnosis of dementia was made according to NINCDS-ADRDA criteria and DSM IV, amnestic MCI diagnosis was based on CDR (CDR = 0.5), MMSE (MMSE ≥ 24) and amnestic cognitive impariment according to word list learning recall task of the CERAD (50%). Baseline cytokine levels of three MCI non-converter subjects, were excluded from the analysis, because of overall highly elevated cytokine levels (i.e. more than 60% of all cytokines measured showed apparently arbitrarily high levels) or because more than 50% of all cytokine measures were missing. Multivariate analysis A machine-learning approach (Support Vector Machines) to class prediction was used to identify a set of combined analytes that might discriminate between converters and non-converters. Support Vector Machines (SVMs) are used extensively in computational biology as they have been shown to predict binary outcomes with high accuracy and possess the ability to model diverse and high-dimensional data [40]. The total number of subjects with cytokine data was 205 (MCI-N = 128, MCI-C = 77). The feature selection stage did not improve the accuracies of any of the classifiers and therefore the model built with all of the data
400
S.J. Furney et al. / Cytokines and MRI as Prognostic Makers for MCI Conversion
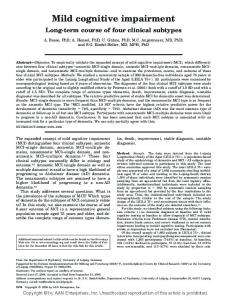
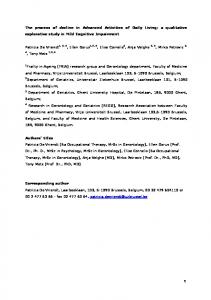
for each of the training datasets was applied to the relevant test dataset (Table 2). The AUCs (Figure 1) from the test datasets were 0.62 (APOE ε4 dosage), 0.60 (Cytokine subset), 0.61 (Cytokine data, Clinical data and APOE ε4 dosage), 0.59 (Clinical data) and 0.65 (Cytokine data). Cytokine and imaging dataset We then sought to assess whether combining structural MRI data with the cytokine data would improve classification accuracy. MRI brain scans of a subset of the subjects were processed and the regional cortical thickness was measured from 34 areas and the regional cortical volume was measured bilaterally from 24 areas (see Methods for details).
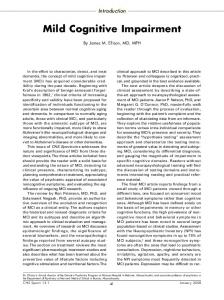
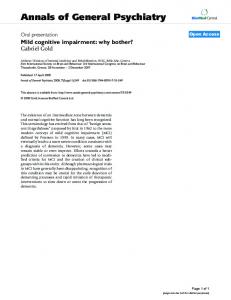
The number of subjects with both imaging and cytokine data was 48 (MCI-N = 26, MCI-C = 22). Feature selection improved the training set prediction accuracy for the Cytokine dataset and the combined Cytokine and Clinical dataset. The other datasets showed greatest accuracy when including all data (Table 3). The most accurate model for each training dataset was then applied to the relevant test dataset. In this smaller dataset, the cytokine data by themselves do not classify the test subjects particularly well (AUC = 0.60). In fact, in this cohort APOE ε4 dosage alone (AUC0.74) is a better predictor of conversion than the cytokine or imaging data (Table 3). The combination of the cytokine and imaging data is the most accurate classifier (AUC = 0.78) showing a modest improvement over APOE ε4 dosage. The imaging or cytokine data alone predict the test subjects with AUCs = 0.68 and 0.60, respectively. The sensitivity, specificity, positive and negative predictive values of each classifier is shown in supplementary table 3. DISCUSSION
Cyt-Clin Cyt Cyt7 Clin APOE
Fig. 1. Entire cytokine cohort receiver operating characteristic (ROC) curves of most accurate training classifiers applied to the test datasets. Cyt-Clin = Cytokine and Clinical data, Cyt = Cytokine data, Clin = Clinical data, Cyt7 = subset of 7 cytokines in common with the panel of 18 identified by Ray et al. , and APOE = APOE ε4 dosage.
This study focused, for the first time, on combinatorial biomarkers using readily available techniques in order to identify a marker set predictive of conversion from MCI to dementia within the time frame of a typical disease modification trial. Alone, cytokine levels showed some predictive value for MCI conversion while imaging data showed a modest predictive accuracy. However, the predictive model using combined cytokine levels and imaging measures outperformed either individual classifier (Table 3 and Figure 2). The cytokine classifier exhibits low sensitivity and a higher specificity (supplementary table 3) whereas the converse is true of the imaging classifier. When the two data-types are combined the classification accuracy is improved (Table 3 and supplementary table 3).
Table 3 Classification area under the ROC curve for the training and test datasets for cohort with cytokine and imaging data (n = 48; best training set classifier in bold)
Cytokine + imaging + clinical + APOEε4 dosage Cytokine + imaging Cytokine + clinical Imaging + clinical Cytokine Imaging Clinical APOEε4 dosage
Training SVM (all data)
Training SVM (10 attributes)
Training SVM (5 attributes)
Test
0.60
0.50
0.50
0.74
0.56 0.49 0.63 0.48 0.62 0.50 0.59
0.51 0.50 0.54 0.50 0.52 N/A N/A
0.54 0.50 0.52 0.50 0.54 N/A N/A
0.78 0.53 0.67 0.60 0.68 0.50 0.74
S.J. Furney et al. / Cytokines and MRI as Prognostic Makers for MCI Conversion
All Cyt-lmag Cyt-Clin Imag-Clin Cyt Imag Clin APOE
Fig. 2. Cytokine and imaging cohort receiver operating characteristic (ROC) curves of most accurate training classifiers applied to the test datasets. All = Cytokine, Imaging, Clinical data and APOE ε4 dosage, Cyt-Imag = Cytokine and Imaging data, CytClin = Cytokine and Clinical data, Imag-Clin = Imaging and Clinical data, Cyt = Cytokine data, Imag = Imaging data, Clin = Clinical data, and APOE = APOE ε4 dosage.
Considering that the potential disease modifying therapies are non-hazardous and aim to focus on an early stage of the disease the ideal predictive model would have a high negative predictive value and a high specificity. From a clinical point of view our here introduced model combining imaging and cytokine measures is favorable above combined imaging measures alone, which have been a point of primary interest in the literature so far. Previous studies have looked at a number of brain regions (e.g. volumes of hippocampus, entorhinal cortex, ventricles, and whole brain) as potential biomarkers of conversion from MCI to AD [10, 29, 41]. Devanand et al. integrated the baseline predictors cognitive test performance, informant report of functional impairment, APOE genotype, olfactory identification deficit, and magnetic resonance imaging (MRI) hippocampal and entorhinal cortex volumes [29]. Ultimately, they used five variables in a predictor: Pfeffer Functional Activities Questionnaire (FAQ; informant report of functioning), University of Pennsylvania Smell Identification Test (UPSIT; olfactory identification), Selective Reminding Test (SRT) immediate recall (verbal memory), MRI hippocampal volume, and MRI entorhinal cortex volume. A recent imaging study, also based upon the AddNeuroMed patient cohort, has analyzed regional MRI volumes and
401
thicknesses as predictors of conversion from mild cognitive impairment to AD [14]. Analysis of the expanded patient cohort of 103 subjects (22 converters at year one follow up) showed that the bilateral hippocampus and amygdala, and right caudate baseline volumes were significantly smaller in MCI to AD converters compared to stable MCI subjects. We analyzed a subset of 7 of the 18 signaling proteins for MCI conversion identified by an earlier study [23] (see Materials & Methods for details). We trained an SVM using these 7 cytokines and applied the model to a test set resulting in an AUC of 0.60. Our findings suggest that the inflammatory markers identified by Ray et al. may show some differential expression in people with established AD, and we are able to show some prognostic value of these markers for the more demanding, but more clinically important task of predicting MCI conversion. Some of the cytokines we have examined have been previously implicated in AD as potential markers. Reports describing IL-1 levels in serum of AD patients have been conflicting with some groups describing an increase in IL-1 serum levels in AD patients compared to controls [42, 43], but others finding no change [44]. A meta analysis also found a genetic association of a IL-1 polymorphism and AD [45-47]. It has been hypothesized that proinflammatory cytokines, such as IL-1 are activating a cascade of neurotoxic changes in the brain, that are related with the development of neuritic plaques and neurofibrillary tangles characteristics in AD [48]. VEGF is associated with neuroprotection and regeneration in the brain. It co-localizes with plaques in AD brain [49] and some studies report an increase in VEGF levels in serum and CSF [50, 51], whereas others find a decrease in serum [52] and no change in CSF [53]. In the cytokine/imaging cohort the classifier using APOE ε4 dosage alone performs better than most other classifiers. It is not surprising that APOE performs well as it is clear that the ε4 allele is associated with AD and has previously been associated with the time to progression from MCI to AD [54]. In addition, in this smaller dataset the mean APOEε4 dosage per converting patient is much greater than in converters in the entire cohort (0.77 compared to 0.54 – Table 1). There are limitations to our study. Most obviously, the sample size of the cytokine and imaging cohort is relatively small (n = 48), which meant constructing a predictive model with a training set of 31 subjects. When applying our predictors to the set of 17 subjects, although the combination of cytokines outperforms APOEε4 dosage, the increase in performance is mod-
402
S.J. Furney et al. / Cytokines and MRI as Prognostic Makers for MCI Conversion
est. It is noteworthy that adding clinical information (including basic cognitive tests, diagnosis and medical history but not very detailed neuropsychometry) adds nothing to the predictive power. This emphasises that the clinical assessment of MCI alone does not predict conversion. As such, our predictor would need to be applied to a larger dataset to independently assess its accuracy. Nonetheless, we show preliminary evidence that a combined set of imaging and cytokine measures provides a small improvement in prediction of MCI to AD conversion than either cytokine or imaging data alone. It remains to be seen whether the accuracy reported here may be improved still further by the addition of other biomarkers or by alternative MRI analytical routines. As the prediction in this case was over only one year after test these data hold out the promise of a combinatorial biomarker for use in both clinical practice and, perhaps more pressingly, for patient stratifica-
tion and enrichment in trials of disease modification agents. FUNDING This work was supported by AddNeuroMed which is funded through the EU FP6 program as part of InnoMed. In addition, we are grateful for additional support from the NIHR Specialist Biomedical Research Centre for Mental Health at the South London and Maudsley NHS Foundation Trust, the NIHR Comprehensive Biomedical Research Centre at Guy’s and St Thomas’s NHS Foundation Trust and King’s College London and the Alzheimer’s Research Trust, UK. ACKNOWLEDGMENTS We would like to thank James Campbell and Leo Schalkwyk for statistical advice.
Supplementary Table 1 Proteins measured with luminex 30- and 6-plex (HGNC, HUGO Gene Nomenclature Committee) Cytokine
Official full name (HGCN)
BDNF DR5 EGF Eotaxin FGF G-CSF GDNF GM-CSF HGF IFN-␣ IFN-␥ IL-1␣ IL-1 IL-1RA IL-2 IL-2R IL-3 IL-4 IL-5 IL-6 IL-7 IL-8 IL-10 IL-12 IL-13 IL-15 IL-17 IP-10 MCP-1 MCP-3 MIG MIP-1␣ MIP-1 RANTES TNF-␣ VEGF
Brain-derived neurotrophic factor Tumor necrosis factor receptor superfamily, member 10b Epidermal growth factor Chemokine (C-C motif) ligand 11 Fibroblast growth factor 2 (basic) Colony stimulating factor 3 (granulocyte) Glial cell derived neurotrophic factor Colony stimulating factor 2 (granulocyte-macrophage) Hepatocyte growth factor Interferon, alpha 1 Interferon, gamma Interleukin 1, alpha Interleukin 1, beta Interleukin 1 receptor, type I Interleukin 2 Interleukin 2 receptor, alpha Interleukin 3 Interleukin 4 Interleukin 5 Interleukin 6 Interleukin 7 Interleukin 8 Interleukin 10 Interleukin 12 Interleukin 13 Interleukin 15 Interleukin 17 Chemokine (C-X-C motif) ligand 10 Chemokine (C-C motif) ligand 2 Chemokine (C-C motif) ligand 7 Chemokine (C-X-C motif) ligand 9 Chemokine (C-C motif) ligand 3 Chemokine (C-C motif) ligand 4 Chemokine (C-C motif) ligand 5 Tumor necrosis factor Vascular growth factor A
Gene symbol (HGNC) BDNF TNFRSF10B EGF CCL11 FGF2 CSF3 GDNF CSF2 IFNA1 IFNG IL1A IL1B IL1R1 IL2 IL2RA IL3 IL4 IL5 IL6 IL7 IL8 IL10 IL12 IL13 IL15 IL17 CXCL10 CCL2 CCL7 CXCL9 CCL3 CCL4 CCL5 TNF VEGFA
S.J. Furney et al. / Cytokines and MRI as Prognostic Makers for MCI Conversion Supplementary Table 2 MRI regional cortical thickness from 34 areas and the regional cortical volume measured bilaterally from 24 areas Volumes
Cortical thicknesses
3rd Ventricle 4th Ventricle 5th Ventricle Brain Seg Vol Brain Stem CC Anterior CC Central CC Mid Anterior CC Mid Posterior CC Posterior CSF Left Accumbensarea Left Amygdala Left Caudate Left Cerebellum Cortex Left Cerebellum White Matter Left Cerebral Cortex Volumes Left Cerebral White Matter Left choroid plexus Left Hippocampus Left Inf Lat Vent Left Lateral Ventricle Left non WM hypointensities Left Pallidum Left Putamen Left Thalamus Proper Left Ventral DC Left vessel Left WM hypointensities Optic Chiasm Right Accumbensarea Right Amygdala Right Caudate Right Cerebellum Cortex Right Cerebellum White Matter Volumes Right Cerebral Cortex Right Cerebral White Matter Right Hippocampus Right Inf Lat Vent Right Lateral Ventricle Right non WM hypointensities Right non WM hypointensities Right Pallidum Right Putamen Right Thalamus Proper Right Ventral DC Right vessel Right WMhypointensities
Banks of STS caudal anterior cingulate caudal middle frontal corpus callosum cuneus entorhinal frontal pole fusiform inferior parietal inferior temporal isthmus cingulate lateral occipital lateral orbito frontal lingual medial orbitofrontal middle temporal para central Cortical thicknesses para hippocampal pars opercularis pars orbitalis pars triangularis pericalcarine post central posterior cingulate precentral precuneus rostral anterior cingulate rostral middle frontal superior frontal superior parietal superior temporal supra marginal temporal pole transverse temporal Cortical thicknesses
403
Supplementary Table 3 Sensitivity (SN), specificity (SP), positive predictive value (PPV), negative predictive value (NPV) and Accuracy (ACC) for the cytokine and imaging cohort classifiers Cytokine + imaging + clinical + APOE4 dosage Cytokine + imaging Cytokine + clinical Imaging + clinical Cytokine Imaging Clinical APOE4 dosage
SN
SP
PPV
NPV
ACC
0.75
0.67
0.67
0.75
0.71
0.75 0.38 0.63 0.50 0.88 0.25 0.75
0.78 0.78 0.67 0.78 0.44 0.67 0.67
0.75 0.60 0.63 0.67 0.58 0.40 0.67
0.78 0.59 0.67 0.64 0.80 0.50 0.75
0.76 0.59 0.65 0.65 0.65 0.47 0.71
REFERENCES [1]
[2]
[3]
[4]
[5]
[6]
[7]
[8]
[9]
[10]
Ferri CP, Prince M, Brayne C, Brodaty H, Fratiglioni L, Ganguli M, Hall K, Hasegawa K, Hendrie H, Huang Y, Jorm A, Mathers C, Menezes PR, Rimmer E, Scazufca M (2005) Global prevalence of dementia: a Delphi consensus study. Lancet 366, 2112-2117. Fratiglioni L, Launer LJ, Andersen K, Breteler MM, Copeland JR, Dartigues JF, Lobo A, Martinez-Lage J, Soininen H, Hofman A (2000) Incidence of dementia and major subtypes in Europe: A collaborative study of population-based cohorts. Neurologic Diseases in the Elderly Research Group. Neurology 54, S10-S15. Pogacic V, Herrling P (2009) List of drugs in development for neurodegenerative diseases. Update June 2008. Neurodegener Dis 6, 37-86. Dubois B, Feldman HH, Jacova C, Dekosky ST, BarbergerGateau P, Cummings J, Delacourte A, Galasko D, Gauthier S, Jicha G, Meguro K, O’Brien J, Pasquier F, Robert P, Rossor M, Salloway S, Stern Y, Visser PJ, Scheltens P (2007) Research criteria for the diagnosis of Alzheimer’s disease: revising the NINCDS-ADRDA criteria. Lancet Neurol 6, 734-746. Modrego PJ (2006) Predictors of conversion to dementia of probable Alzheimer type in patients with mild cognitive impairment. Curr Alzheimer Res 3, 161-170. Mitchell AJ, Shiri-Feshki M (2009) Rate of progression of mild cognitive impairment to dementia–meta-analysis of 41 robust inception cohort studies. Acta Psychiatr Scand 119, 252-265. Bruscoli M, Lovestone S (2004) Is MCI really just early dementia? A systematic review of conversion studies. Int Psychogeriatr 16, 129-140. Diniz SO, Pinto JA, Forlenza OV (2008) Do CSF total tau, phosphorylated tau, and -amyloid 42 help to predict progression of mild cognitive impairment to Alzheimer’s disease? A systematic review and meta-analysis of the literature. World Journal of Biological Psychiatry 9, 172-182. Davatzikos C, Bhatt P, Shaw LM, Batmanghelich KN, Trojanowski JQ (2010) Prediction of MCI to AD conversion via MRI CSF biomarkers and pattern classification. Neurobiol Aging. Desikan RS, Cabral HJ, Fischl B, Guttmann CR, Blacker D, Hyman BT, Albert MS, Killiany RJ (2009) Temporoparietal MR imaging measures of atrophy in subjects with mild cognitive impairment that predict subsequent diagnosis of Alzheimer disease. AJNR Am J Neuroradiol 30, 532-538.
404 [11]
[12]
[13]
[14]
[15]
[16] [17]
[18]
[19]
[20]
[21]
[22]
S.J. Furney et al. / Cytokines and MRI as Prognostic Makers for MCI Conversion Devanand DP, Pradhaban G, Liu X, Khandji A, De Santi S, Segal S, Rusinek H, Pelton GH, Honig LS, Mayeux R, Stern Y, Tabert MH, de Leon MJ (2007) Hippocampal and entorhinal atrophy in mild cognitive impairment: prediction of Alzheimer disease. Neurology 68, 828-836. Fleisher AS, Sun S, Taylor C, Ward CP, Gamst AC, Petersen RC, Jack CR, Jr., Aisen PS, Thal LJ (2008) Volumetric MRI vs clinical predictors of Alzheimer disease in mild cognitive impairment. Neurology 70, 191-199. Jack CR, Jr, Petersen RC, Xu YC, O’Brien PC, Smith GE, Ivnik RJ, Boeve BF, Waring SC, Tangalos EG, Kokmen E (1999) Prediction of AD with MRI-based hippocampal volume in mild cognitive impairment. Neurology 52, 13971403. Liu Y, Paajanen T, Zhang Y, Westman E, Wahlund LO, Simmons A, Tunnard C, Sobow T, Mecocci P, Tsolaki M, Vellas B, Muehlboeck S, Evans A, Spenger C, Lovestone S, Soininen H (2010) Analysis of regional MRI volumes and thicknesses as predictors of conversion from mild cognitive impairment to Alzheimer’s disease. Neurobiol Aging 31, 1375-1385. Okello A, Koivunen J, Edison P, Archer HA, Turkheimer FE, Nagren K, Bullock R, Walker Z, Kennedy A, Fox NC, Rossor MN, Rinne JO, Brooks DJ (2009) Conversion of amyloid positive and negative MCI to AD over 3 years: an 11C-PIB PET study. Neurology 73, 754-760. Blennow K (2004) Cerebrospinal fluid protein biomarkers for Alzheimer’s disease. NeuroRx 1, 213-225. Shaw LM, Vanderstichele H, Knapik-Czajka M, Clark CM, Aisen PS, Petersen RC, Blennow K, Soares H, Simon A, Lewczuk P, Dean R, Siemers E, Potter W, Lee VM, Trojanowski JQ (2009) Cerebrospinal fluid biomarker signature in Alzheimer’s disease neuroimaging initiative subjects. Ann Neurol 65, 403-413. Landau SM, Harvey D, Madison CM, Reiman EM, Foster NL, Aisen PS, Petersen RC, Shaw LM, Trojanowski JQ, Jack CR, Jr, Weiner MW, Jagust WJ (2010) Comparing predictors of conversion and decline in mild cognitive impairment. Neurology. Cuingnet R, Gerardin E, Tessieras J, Auzias G, Lehericy S, Habert MO, Chupin M, Benali H, Colliot O (2010) Automatic classification of patients with Alzheimer’s disease from structural MRI: A comparison of ten methods using the ADNI database. Neuroimage. Akuffo EL, Davis JB, Fox SM, Gloger IS, Hosford D, Kinsey EE, Jones NA, Nock CM, Roses AD, Saunders AM, Skehel JM, Smith MA, Cutler P (2008) The discovery and early validation of novel plasma biomarkers in mild-to-moderate Alzheimer’s disease patients responding to treatment with rosiglitazone. Biomarkers 13, 618-636. Thambisetty M, Simmons A, Velayudhan L, Hye A, Campbell J, Zhang Y, Wahlund LO, Westman E, Kinsey A, Guntert A, Proitsi P, Powell J, Causevic M, Killick R, Lunnon K, Lynham S, Broadstock M, Choudhry F, Howlett DR, Williams RJ, Sharp SI, Mitchelmore C, Tunnard C, Leung R, Foy C, O’Brien D, Breen G, Furney SJ, Ward M, Kloszewska I, Mecocci P, Soininen H, Tsolaki M, Vellas B, Hodges A, Murphy DG, Parkins S, Richardson JC, Resnick SM, Ferrucci L, Wong DF, Zhou Y, Muehlboeck S, Evans A, Francis PT, Spenger C, Lovestone S (2010) Association of plasma clusterin concentration with severity, pathology, and progression in Alzheimer disease. Arch Gen Psychiatry 67, 739-748. Thambisetty M, Hye A, Foy C, Daly E, Glover A, Cooper A, Simmons A, Murphy D, Lovestone S (2008) Proteome-based identification of plasma proteins associated with hippocampal
[23]
[24]
[25]
[26]
[27]
[28]
[29]
[30]
[31]
[32]
[33]
[34]
metabolism in early Alzheimer’s disease. J Neurol 255, 17121720. Ray S, Britschgi M, Herbert C, Takeda-Uchimura Y, Boxer A, Blennow K, Friedman LF, Galasko DR, Jutel M, Karydas A, Kaye JA, Leszek J, Miller BL, Minthon L, Quinn JF, Rabinovici GD, Robinson WH, Sabbagh MN, So YT, Sparks DL, Tabaton M, Tinklenberg J, Yesavage JA, Tibshirani R, Wyss-Coray T (2007) Classification and prediction of clinical Alzheimer’s diagnosis based on plasma signaling proteins. Nat Med 13, 1359-1362. O’Bryant SE, Xiao G, Barber R, Reisch J, Doody R, Fairchild T, Adams P, Waring S, Diaz-Arrastia R (2010) A Serum Protein-Based Algorithm for the Detection of Alzheimer Disease. Arch Neurol 67, 1077-1081. Mosconi L, Perani D, Sorbi S, Herholz K, Nacmias B, Holthoff V, Salmon E, Baron JC, De Cristofaro MT, Padovani A, Borroni B, Franceschi M, Bracco L, Pupi A (2004) MCI conversion to dementia and the APOE genotype: a prediction study with FDG-PET. Neurology 63, 2332-2340. Borroni B, Premi E, Di Luca M, Padovani A (2007) Combined biomarkers for early Alzheimer disease diagnosis. Curr Med Chem 14, 1171-1178. Visser PJ, Scheltens P, Verhey FR, Schmand B, Launer LJ, Jolles J, Jonker C (1999) Medial temporal lobe atrophy and memory dysfunction as predictors for dementia in subjects with mild cognitive impairment. J Neurol 246, 477-485. Okamura N, Arai H, Maruyama M, Higuchi M, Matsui T, Tanji H, Seki T, Hirai H, Chiba H, Itoh M, Sasaki H (2002) Combined analysis of CSF tau levels and [(123)I]iodoamphetamine SPECT in mild cognitive impairment: implications for a novel predictor of Alzheimer’s disease. Am J Psychiatry 159, 474-476. Devanand DP, Liu X, Tabert MH, Pradhaban G, Cuasay K, Bell K, de Leon MJ, Doty RL, Stern Y, Pelton GH (2008) Combining early markers strongly predicts conversion from mild cognitive impairment to Alzheimer’s disease. Biol Psychiatry 64, 871-879. Ewers M, Walsh C, Trojanowski JQ, Shaw LM, Petersen RC, Jack CR, Jr., Feldman HH, Bokde AL, Alexander GE, Scheltens P, Vellas B, Dubois B, Weiner M, Hampel H Prediction of conversion from mild cognitive impairment to Alzheimer’s disease dementia based upon biomarkers and neuropsychological test performance. Neurobiol Aging. Lovestone S, Francis P, Strandgaard K (2007) Biomarkers for disease modification trials–the innovative medicines initiative and AddNeuroMed. J Nutr Health Aging 11, 359-361. Hye A, Lynham S, Thambisetty M, Causevic M, Campbell J, Byers HL, Hooper C, Rijsdijk F, Tabrizi SJ, Banner S, Shaw CE, Foy C, Poppe M, Archer N, Hamilton G, Powell J, Brown RG, Sham P, Ward M, Lovestone S (2006) Proteome-based plasma biomarkers for Alzheimer’s disease. Brain 129, 30423050. Jack CR, Jr, Bernstein MA, Fox NC, Thompson P, Alexander G, Harvey D, Borowski B, Britson PJ, Ward JLW, Dale C, Felmlee AM, Gunter JP, Hill JL, Killiany DL, Schuff R, Fox-Bosetti N, Lin S, Studholme C, DeCarli C, Krueger CS, Ward G, Metzger HA, Scott GJ, Mallozzi KT, Blezek R, Levy D, Debbins J, Fleisher JP, Albert AS, Green M, Bartzokis R, Glover G, Mugler G, Weiner J, MW (2008) The Alzheimer’s Disease Neuroimaging Initiative (ADNI): MRI methods. J Magn Reson Imaging 27, 685-691. Simmons A, Westman E, Muehlboeck S, Mecocci P, Vellas B, Tsolaki M, Kloszewska I, Wahlund LO, Soininen H, Lovestone S, Evans A, Spenger C (2009) MRI measures of
S.J. Furney et al. / Cytokines and MRI as Prognostic Makers for MCI Conversion
[35]
[36]
[37]
[38]
[39]
[40]
[41]
[42]
[43]
[44]
Alzheimer’s disease and the AddNeuroMed study. Ann N Y Acad Sci 1180, 47-55. Simmons A, Other AN, Other AN, Lovestone S(in press) The AddNeuroMed framework for multi-centre MRI assessment of longitudinal changes in Alzheimer’s disease : experience from the first 24 months. Int J Ger Psych. Fischl B, Dale AM (2000) Measuring the thickness of the human cerebral cortex from magnetic resonance images. Proc Natl Acad Sci U S A 97, 11050-11055. Fischl B, Salat DH, Busa E, Albert M, Dieterich M, Haselgrove C, van der Kouwe A, Killiany R, Kennedy D, Klaveness S, Montillo A, Makris N, Rosen B, Dale AM (2002) Whole brain segmentation: automated labeling of neuroanatomical structures in the human brain. Neuron 33, 341355. Fischl B, Salat DH, van der Kouwe AJ, Makris N, Segonne F, Quinn BT, Dale AM (2004) Sequence-independent segmentation of magnetic resonance images. Neuroimage 23(1), S69-S84. Frank E, Hall M, Trigg L, Holmes G, Witten IH (2004) Data mining in bioinformatics using Weka. Bioinformatics 20, 2479-2481. Ben-Hur A, Ong CS, Sonnenburg S, Scholkopf B, Ratsch G (2008) Support vector machines and kernels for computational biology. PLoS Comput Biol 4, e1000173. den Heijer T, Geerlings MI, Hoebeek FE, Hofman A, Koudstaal PJ, Breteler MM (2006) Use of hippocampal and amygdalar volumes on magnetic resonance imaging to predict dementia in cognitively intact elderly people. Arch Gen Psychiatry 63, 57-62. Alvarez XA, Franco A, Fernandez-Novoa L, Cacabelos R (1996) Blood levels of histamine, IL-1 beta, and TNF-alpha in patients with mild to moderate Alzheimer disease. Mol Chem Neuropathol 29, 237-252. De Luigi A, Fragiacomo C, Lucca U, Quadri P, Tettamanti M, Grazia De Simoni M (2001) Inflammatory markers in Alzheimer’s disease and multi-infarct dementia. Mech Ageing Dev 122, 1985-1995. Lombardi VR, Garcia M, Rey L, Cacabelos R (1999) Characterization of cytokine production, screening of lymphocyte subset patterns and in vitro apoptosis in healthy and Alzheimer’s Disease (AD) individuals. J Neuroimmunol 97, 163-171.
[45]
[46]
[47]
[48] [49]
[50]
[51]
[52]
[53]
[54]
405
Beloosesky Y, Salman H, Bergman M, Bessler H, Djaldetti M (2002) Cytokine levels and phagocytic activity in patients with Alzheimer’s disease. Gerontology 48, 128-132. Di Bona D, Plaia A, Vasto S, Cavallone L, Lescai F, Franceschi C, Licastro F, Colonna-Romano G, Lio D, Candore G, Caruso C (2008) Association between the interleukin-1beta polymorphisms and Alzheimer’s disease: a systematic review and meta-analysis. Brain Res Rev 59, 155-163. Yasutake C, Kuroda K, Yanagawa T, Okamura T, Yoneda H (2006) Serum BDNF, TNF-alpha and IL-1beta levels in dementia patients: comparison between Alzheimer’s disease and vascular dementia. Eur Arch Psychiatry Clin Neurosci 256, 402-406. Mrak RE, Griffin WS (2005) Potential inflammatory biomarkers in Alzheimer’s disease. J Alzheimers Dis 8, 369-375. Yang SP, Bae DG, Kang HJ, Gwag BJ, Gho YS, Chae CB (2004) Co-accumulation of vascular endothelial growth factor with beta-amyloid in the brain of patients with Alzheimer’s disease. Neurobiol Aging 25, 283-290. Chiappelli M, Borroni B, Archetti S, Calabrese E, Corsi MM, Franceschi M, Padovani A, Licastro F (2006) VEGF gene and phenotype relation with Alzheimer’s disease and mild cognitive impairment. Rejuvenation Res 9, 485-493. Tarkowski E, Issa R, Sjogren M, Wallin A, Blennow K, Tarkowski A, Kumar P (2002) Increased intrathecal levels of the angiogenic factors VEGF and TGF-beta in Alzheimer’s disease and vascular dementia. Neurobiol Aging 23, 237-243. Mateo I, Llorca J, Infante J, Rodriguez-Rodriguez E, Fernandez-Viadero C, Pena N, Berciano J, Combarros O (2007) Low serum VEGF levels are associated with Alzheimer’s disease. Acta Neurol Scand 116, 56-58. Blasko I, Lederer W, Oberbauer H, Walch T, Kemmler G, Hinterhuber H, Marksteiner J, Humpel C (2006) Measurement of thirteen biological markers in CSF of patients with Alzheimer’s disease and other dementias. Dement Geriatr Cogn Disord 21, 9-15. Blom ES, Giedraitis V, Zetterberg H, Fukumoto H, Blennow K, Hyman BT, Irizarry MC, Wahlund LO, Lannfelt L, Ingelsson M (2009) Rapid progression from mild cognitive impairment to Alzheimer’s disease in subjects with elevated levels of tau in cerebrospinal fluid and the APOE epsilon4/epsilon4 genotype. Dement Geriatr Cogn Disord 27, 458-464.