Vol. 14 no. 1 1998 Pages 48-54
BIOINFORMATICS
Combining evidence using p-values: application to sequence homology searches Timothy L. Bailey and Michael Gribskov San Diego Supercomputer Center, PO Box 85608, San Diego, CA 92186Ć9784, USA Received on February 8, 1997; revised on May 8, 1997; accepted on May 20, 1997
Abstract Motivation: To illustrate an intuitive and statistically valid method for combining independent sources of evidence that yields a p-value for the complete evidence, and to apply it to the problem of detecting simultaneous matches to multiple patterns in sequence homology searches. Results: In sequence analysis, two or more (approximately) independent measures of the membership of a sequence (or sequence region) in some class are often available. We would like to estimate the likelihood of the sequence being a member of the class in view of all the available evidence. An example is estimating the significance of the observed match of a macromolecular sequence (DNA or protein) to a set of patterns (motifs) that characterize a biological sequence family. An intuitive way to do this is to express each piece of evidence as a p-value, and then use the product of these p-values as the measure of membership in the family. We derive a formula and algorithm (QFAST) for calculating the statistical distribution of the product of n independent p-values. We demonstrate that sorting sequences by this p-value effectively combines the information present in multiple motifs, leading to highly accurate and sensitive sequence homology searches. Availability: The MAST sequence homology search algorithm incorporating the results described here is available for interactive use and downloading at URL http://www.sdsc.edu/MEME Contact:
[email protected] Introduction The purposes of this paper are to introduce the use of the product of p-values of independent tests in the context of sequence homology searches, and to present a simple and efficient algorithm for computing the distribution of this statistic. Beyond the particular application to sequence similarity, the approach is of general interest because it addresses the important question of how to combine evidence from independent sources. This problem occurs frequently in many contexts where the goal is to classify multivariate observations. Sequence homology searches are a key computational tool of molecular biology. Protein and DNA molecules are linear
48
polymers that can be represented by sequences of letters showing the order of their basic building blocks, each of which is represented by a single letter. In homologous proteins, i.e. molecules that are descended from a common ancestor, sequence similarity is strongly correlated with the function and structure of the molecule. Homology, structure and function are key questions of interest to molecular biologists, and inferences about all three can be made based on sequence similarities. Most homology searches involve comparing a single sequence (the ‘query’) to a database of known (‘target’) sequences. This often fails to identify very distant homologs because, in this case, the sequence similarly is limited and confined to the most important portions of the molecules. When two unrelated sequences are compared, numerous chances for apparent matches arise, causing a severe ‘noise’ problem in homology searches of large databases. The signal-to-noise ratio in homology searches can be increased by searching using patterns called ‘motifs’ as the query. Motifs describe the key, defining portions of a family of molecules. Several computer algorithms exist for automatically constructing a characteristic set of sequence motifs from a family of biological sequences (Bairoch, 1995; Henikoff et al., 1995; Neuwald et al., 1995; Bailey and Gribskov, 1996). Since the motifs describe only a small portion of the query sequences, there are fewer opportunities for chance similarities when they are compared to a target sequence. For this reason, sequence homology searches using a set of motifs characteristic of a protein or DNA family provide more discrimination between distant homologs and random matches. Motifs can be thought of as ‘generalized sequences’, and are represented by position-specific scoring matrices. Whereas a sequence has a letter at each position, a motif has a vector of values which gives the score for matching that position of the motif to each letter in the alphabet. The match score of a motif with w columns and position i in a target sequence is defined as the sum of the scores for the letters in the sequence at positions i to i + w – 1 matched with columns 1 to w of the motif, respectively. This is illustrated for a DNA motif and a DNA target sequence in Figure 1. The match score of a motif and a sequence is defined as the maximum E Oxford University Press
Sequence homology searches using p-values
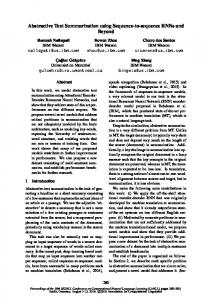
Fig. 1. Computing motif match scores. The motif in this example represents a sequence pattern eight positions wide and hence contains eight columns of scores. Each column contains scores for matching each of the four letters in the DNA alphabet (ACGT) to that position in the motif. The subsequence starting at position i is GGTGCTGG, so the match score for position i in the sequence is determined by summing the score for G in position 1, G in position 2, T in position 3, etc., as shown in the illustration. The procedure for protein motifs is identical except that the protein alphabet contains 20 letters, and protein motifs consequently contain 20 rows.
match score over all positions in the sequence where the motif would fit without overhanging the ends of the sequence. To make statistically valid inferences about homology searches using sets of motifs as the query, the match scores of the target sequence and each motif must somehow be combined into a statistic whose distribution is known or can be estimated. We propose the following method based on the Fisher ‘omnibus’ procedure for combining one-sided statistical tests (Fisher, 1970). The match score of a single motif compared to a random sequence is a discrete random variable whose distribution can be calculated exactly (Staden, 1990). From this distribution, we can calculate the p-value of the match score of a target sequence—the probability of observing a match score at least as good when the motif is compared to a random sequence. Given a set of motifs characterizing a family of sequences, each p-value is the result of an (approximately) independent one-sided test of the membership of the target sequence in the family. The smaller the p-value, the stronger the evidence for membership. The p-values can be combined by taking their product, which will be smaller as the combined evidence for membership increases. The product of the p-values of the individual matches is the statistic whose distribution we will use to assign a significance level to the combined match of the sequence to the set of motifs. The above method for combining motif scores makes intuitive sense. Suppose we have two motifs, A and B, which characterize a sequence family. For a given target sequence, we calculate two p-values, pA and pB , giving the probabilities of a random sequence matching motif A and motif B, re-
spectively, as well or better than the target sequence does. The product of the p-values, pA pB , is the probability of the joint event, but it should not be used directly as a measure of the total match because there are many values for pA and pB for which the product has the same value. It seems natural to assume that observing pA = 0.01 and pB = 0.01 (moderate matches to motifs A and B) would be equally as good evidence for membership of the target sequence in the family as would observing pA = 0.1 and pB = 0.001 (weak match to motif A and strong match to motif B). Using the product of the motif p-values as the test statistic takes this into account since the p-value of the total match of the target sequence to the two motifs is then the probability that product pA pB is less than or equal to the observed value, which is the same in the two examples. The idea of using the product of p-values as a test statistic is illustrated graphically for the case of two p-values in Figure 2. If the underlying distributions are continuous, p-values pA and pB are uniform random variables on the interval [0, 1], so the probability that pA pB < 0.1 is equal to the area beneath the curve pA pB = 0.1. In what follows, we will show an efficient method for calculating the distribution of the product of independent, uniform random variables, and demonstrate that this distribution closely approximates the distribution of the product of motif score p-values.
Methods The distribution of the product of independent, uniform random variables is of interest because, under the null hypothesis, the distribution of the p-value of a continuous test statis-
49
T.L.Bailey and M.Gribskov
The distribution of the product of independent, uniform [0, 1] random variables can also be calculated directly without transformation to (1) and without reference to the χ2 distribution. The method is given by the following theorem.
Theorem 1 The probability, Fn (p), that the product of n independent, uniform [0, 1] random variables n
Zn + P Pi
(2)
i+1
has an observed value less than or equal to p, is given by
ȍ (* i!ln p) n*1
F n(p) + p
i
(3)
i+0
for 0 < p ≤ 1, and is zero when p is zero.
Proof of Theorem 1 Fig. 2. Using the product of p-values as a test statistic. An observed product of two p-values of 0.1 could be the result of any event whose two p-values, x and y, lie on the curve xy = 0.1. Likewise, the probability of observing a product of two p-values less than 0.1 is the probability of all the points below the curve. If the p-values are independent and uniformly distributed, the area within the unit square beneath the curve is equal to the probability that the product is less than or equal to 0.1.
tic is exactly uniform on the interval [0, 1]. The distribution of the product of p-values based on independent, continuous test statistics is therefore given by the distribution of the product of independent, uniform [0, 1] random variables. If Pi , i = 1, …, n, are independent random variables each distributed uniformly on the interval [0, 1], the statistic1 n
–2ln P P i i+1
(1)
has a χ2 distribution with 2n degrees of freedom (Oosterhoff, 1969). To show this, note that –2 ln Pi is distributed χ2 with 2 degrees of freedom and that the sum of independent, χ2 variables is χ2 with degrees of freedom equal to the sum of the individual degrees of freedom. This distribution is useful for combining evidence from multiple single-tailed hypothesis tests. If the observations are independent and the null hypothesis distributions are continuous, then the p-values associated with the observations will be independent and uniform on the interval [0, 1]. The above statistic (1) can then be used in a hypothesis test, rejecting the null hypothesis when it is sufficiently small. In practice, this is cumbersome because of the computational costs of calculating the χ2 distribution. 1Throughout
this paper, we use ln(x) for the natural logarithm of x, and log(x) for its base-10 logarithm
50
Feller (1957) notes that we can convert the product of n independent, uniform random variables to the sum of n independent, exponential random variables which has distribution function
ȍ xi! , n–1
G n(x) + 1–e –x
i
xu0
(4)
i+0
If we define Yi = –ln Pi for 1≤ i≤ n, then the Yi are mutually independent and exponentially distributed since Pr(Yi ≥ t) = Pr(Pi ≤ e–t) = e–t
(5) (6)
Therefore, Sn = Y1 + … + Yn is the sum of independent, exponential random variables and has the distribution function given in equation (4). Since Zn = e *Sn and e *Sn < p if, and only if, Sn > – ln p, the distribution function of Zn is given by 1 – Gn (– ln p). Substituting – ln p for x in equation (4) proves the theorem. An implementation of equation (3) for calculating the distribution of the product independent, uniform [0, 1] random variables is given in Figure 3. The inputs are n (the number of random values in the product) and p (the product). We will refer to this as the QFAST algorithm. The computational requirements of the QFAST algorithm are modest. Each iteration of the loop uses only three arithmetic operations. To compute the p-value of the product of n independent, uniform [0, 1] random variables, only n additions, n multiplications, n divisions and one logarithm are required. For small values of n, this is considerably less computation than would be required to compute the distribution of equation (1) using a standard algorithm for the χ2 distribution function, which typically require >10 times as many numerical operations.
Sequence homology searches using p-values
Fig. 3. The QFAST algorithm.
To verify this, we compared the speed of the QFAST algorithm and the χ2 distribution algorithm of Press et al. (1995). Protein sequence databases currently contain >250 000 sequences, so we measured the CPU time required to compute 250 000 p-values using the two methods. A uniform random variable, p, was sampled, and then the corresponding p-value (pretending p to be the product of n independent p-values) was computed. On a Sun Ultrasparc 1 processor, using QFAST is faster than computing the χ2 distribution for all values of n up to 50. For example, QFAST requires 0.42 s to compute 250 000 p-values when n = 2, while using the χ2 distribution algorithm requires 3.2 s (7.6 times slower). With typical database searches using queries containing about four motifs, using QFAST saves several seconds per search.
Algorithm As we discussed in the Introduction, using the product of p-values of motif match scores as the test statistic for determining the match of a target sequence and a set of motifs characterizing a protein or DNA family makes intuitive sense. We have shown that if the motif scores were independent, continuous random variables, the distribution of the product of p-values, Zn , would be given by Fn (p) and could be calculated exactly using the QFAST algorithm. Motif scores are discrete random variables, however, so the assumption that their p-values follow a uniform [0, 1] distribution is an approximation. The independence assumption is, likewise, not completely true. Nonetheless, we shall show that the distribution of the product of motif score p-values is well approximated by the distribution of the product of independent, uniform [0, 1] random variables. The MAST (Motif Alignment and Search Tool) sequence homology search algorithm uses the QFAST algorithm to calculate the statistical significance of matches of a group of motifs characteristic of a protein or DNA sequence family and a target sequence. MAST takes a group of motifs as the ‘query’ and compares it to each sequence in a database of sequences. For each motif, MAST finds the position in the
sequence that best matches it, calculates the p-value of the match (‘position p-value’), and normalizes the p-value for the length of the sequence (‘sequence p-value’). For each sequence, the sequence p-values are multiplied together and the p-value of the product (‘combined p-value’) is taken as the statistical significance of the combined match to all the motifs. The next three paragraphs describe this procedure in detail. The position p-value of the match between motif m and position i in sequence s, pm,s,i , is defined as the probability that a match as good as the observed match would occur at a single, randomly chosen position in a random sequence. Suppose motif m represents a sequence pattern w letters wide. MAST obtains pm,s,i by calculating the cumulative density function for matching a length w sequence to the motif. Following Tatusov et al. (1994), we assume, without loss of generality, that the motif matrix contains integer entries mj,k , 1≤ j≤ L, 1≤ k≤ w, where L is the length of the sequence alphabet. The null hypothesis assumes that each position in sequence s is iid with the average letter distribution observed in naturally occurring sequences, pi , 1≤ i≤ L. Let M(k)(x) be the match score probability density function for the motif matrix if it consisted of only its first k columns. If this were known, we could compute the density for the matrix consisting of the first k + 1 columns as
ȍM L
M (k)l)(x) +
(k)
(x * m j,k ) 1)p j
(7)
j+1
This reflects the fact that the only way for the first k + 1 positions in a sequence segment to have score x is for its first k positions to have score x – y, and the letter in position k + 1 of the segment to receive score y. This can happen in L different ways since there are L possible letters in position k + 1 of the sequence segment. To start the induction, set M(0)(0) = 1 and M(0)(x) = 0 for x > 0. This reflects the fact that, using no columns of the matrix, the only possible score is 0, with probability 1. After w iterations, M(w)(x) contains the probability density for matching the motif with a random sequence of length w, from which the cumulative density (and, hence, pm,s,i ) may be trivially obtained. The sequence p-value of the match between motif m and sequence s, pm,s , is defined as the probability of a random sequence of the same length matching the motif as well or better than the actual sequence does. MAST computes pm,s as follows. Let l be the length of the target sequence. There are k = l – w + 1 positions in sequence s where the motif may occur. The sequence p-value for motif m compared with sequence s is computed by normalizing the smallest position p-value by the length of the sequence according to the equation pm,s = 1 – (1 – pm,s,i*) k
(8)
51
T.L.Bailey and M.Gribskov
where i* is the index of the position with the smallest position p-value. (This formula is based on the simplifying assumption that all position p-values are independent.) For a query containing n motifs, the sequence p-values comprise n separate pieces of evidence for or against membership of the sequence in the biological sequence family represented by the query motifs. The combined p-value for the sequence is computed by MAST using the QFAST algorithm to approximate the p-value of the product of the sequence p-values of each of the motifs. If the p-values for a sequence were independent, uniform [0, 1] random variables, QFAST would give the exact p-value of their product. Despite the fact that the match scores are discrete and that there may be slight dependencies among the match scores for different motifs, we shall show that the final p-values determined by MAST are extremely accurate and can be used both to classify the membership of sequences in the family, as well as to give a sound basis for judging the reliability of each individual classification decision.
Implementation We used the MAST algorithm to study two aspects of using the product of motif score p-values as the test statistic for deciding whether a target sequence belongs to the sequence family characterized by a set of motifs. Firstly, we investigated whether equation (3) accurately approximates the true distribution of the product of motif match score p-values. Secondly, we verified that the test statistic correctly classifies target sequences. Our experimental methodology involved: (i) selecting a large number of protein sequence families; (ii) constructing a set of characteristic motifs for each family; (iii) creating a database of pseudo-random sequences; (iv) using MAST to calculate the combined p-value of each pseudo-random sequence and a family of motifs; (vi) comparing the observed and expected distributions of combined p-values; (vii) measuring the classification accuracy of combined pvalues when searching a database of real sequences (SWISS-PROT release 28; Bairoch, 1994). We chose 75 sequence families from the Prosite database of protein sequence families (Bairoch, 1995). [The families chosen are listed in Bailey and Gribskov (1997).] The MEME motif discovery program (Bailey and Elkan, 1995) was used to generate a set of five motifs for each sequence family. The database of pseudo-random sequences contains 100 000 sequences of lengths varying uniformly from 10 to 1000 characters, where each position is iid with the residue frequencies of SWISS-PROT release 31. To measure the accuracy of the p-values, MAST was used to calculate the p-value of the comparison score of each set of motifs and each sequence in the pseudo-random database, and the nega-
52
Fig. 4. Accuracy of MAST p-values. The distribution of p-values estimated by MAST using the QFAST algorithm is compared with the observed distribution. The graph shows the negative logarithm of the observed fraction of sequences with the given p-value or less versus the negative logarithm of p-value. The points labeled ‘all motifs’ are each the average of 75 experiments where five motifs characteristic of a single protein family were used to search a pseudo-random sequence database of 100 000 protein sequences of varying lengths. The points labeled ‘independent motifs’ show the average result when all motifs that are highly similar to other motifs in their queries are removed. Points below the line x = y correspond to average p-values that overestimate the statistical significance of matches.
tive logarithm of the fraction of sequences whose p-value was less than or equal to 1 × 10⁻⁶, 2 × 10⁻⁶, 4 × 10⁻⁶, …, 1.0 was plotted against the negative logarithm of the expected fraction (Figure 4). If p-values calculated by our method were exactly correct, we would expect the fraction of sequences having a p-value less than or equal to x to be equal to x. To evaluate the ability of the p-values to separate family members from other sequences, we sorted the database of real, biological sequences by increasing p-value and calculated the ROC50 value (Gribskov and Robinson, 1996) of the sort (Figure 5). (ROC metrics have the virtue that they combine measurements of the sensitivity and selectivity of a search method into a single number. The ROC50 metric considers only the top of the sort down to the fiftieth non-family member. The metric has a value of one if all the true family members come before any non-family members in a sort of the sequences in the database. It has the value zero if 50 nonfamily members appear before the first family member.) Figure 4 shows that the p-values predicted by MAST using the QFAST algorithm are accurate as long as the query contains no strongly correlated pairs of motifs. Each curve in the figure shows the results of calculating the p-values of mul-
Sequence homology searches using p-values
Fig. 5. Classification accuracy of MAST. The curve labeled ‘product of p-values’ shows the average classification accuracy (ROC50) of the MAST algorithm when the scores of various numbers of motifs are combined using the QFAST algorithm. The other curve shows the average accuracy if the scoring function used is the sum of the match scores of the sequence and each motif in the query. Each point represents the average result of 75 distinct queries, one for each of 75 sequence families. For each family, the queries were nested: the motifs in the four-motif query were a subset of the motifs in the five-motif query, etc.
tiple-motif queries characterizing 75 distinct sequence families when compared to pseudo-random sequences, and compares the expected fraction of sequences with p-value less than or equal to x to the observed fraction of sequences with p-value less than or equal to x. One curve shows the average results for the 75 distinct five-motif queries described in the previous paragraph. The other curve is the average result when strongly correlated motifs are removed from the queries. [We measured the correlation between motif pairs using the sum of the Pearson correlation coefficient for pairs of motif columns (Pietrokovski, 1996) divided by the width of the shorter motif. This metric ranges from –1 to 1, with a value of 1 indicating identical motifs. A total of 10 motifs with values of this measure above 0.6 were removed from seven queries, leaving one two-motif query, one three-motif query, five four-motif queries and 67 five-motif queries.] If the QFAST algorithm perfectly estimates the p-value of the product of p-values, we would expect the curves to lie along the line x = y in the figure. Since we allow motifs to overlap, if two motifs in a query are extremely similar (i.e. correlated), they can both match a sequence at essentially the same position. This will cause their match scores to be strongly correlated and lead occasionally to exaggerated p-values. This accounts for the downward trend in the first curve. The second
curve shows that the p-values become much more accurate when strongly correlated motifs are removed. Very few motifs need to be removed on average; the second curve shows the excellent accuracy of the p-value prediction where 365 out of the original 375 motifs are included in the queries. The overall validity of using the product of p-values statistic for measuring the significance of sequence similarity and, thus, homology, is further supported by Figure 5. The curve labeled ‘product of p-values’ shows the average classification accuracy when the sequences are sorted according to the product of the p-values of the match scores of the sequence and each of the motifs in queries comprising 1 to 5 motifs. For comparison, the curve labeled ‘sum of scores’ shows the results when the sequences are sorted by the sum of the match scores for each of the motifs in the query and the sequence. Average classification accuracy is superior using the product of p-values as the scoring function with all multiplemotif queries. With that scoring function, classification accuracy improves consistently with each additional motif, proving that the product of p-values statistic is effectively utilizing the additional information in each of the motifs. This is not the case with the simpler scoring function, where average classification accuracy does not increase for queries with more than two motifs. These data, together with that of Figure 4, demonstrate that our method of combining evidence results in effective classification, with the added benefit that the classification score (the p-value of the product of p-values) is an accurate estimate of the probability of false-positive matches with the same score or better.
Discussion We have shown a simple, fast way to calculate the distribution of the product of independent random variables distributed uniformly on the interval [0, 1]. The algorithm can be efficiently implemented and is directly useful for combining the results of multiple one-sided statistical tests. When the test statistics have independent, continuous distributions, the method gives the exact distribution of the product of their p-values. In practice, the method is also useful for combining tests based on discrete statistics if the distributions of the statistics are ‘continuous enough’. One important application of this method is the calculation of the p-value of the combined match scores of a biological sequence (DNA or protein) and a set of motifs collectively describing a biological sequence family. This is implemented in the MAST sequence homology search algorithm. The match score of the sequence and each motif is calculated, the p-value of a random sequence having that score or better is computed, and the p-value of the product of these p-values is estimated. When the motifs describing a sequence family are used to search a database of biological sequences, the p-value of the combined match of the motifs and a target
53
T.L.Bailey and M.Gribskov
sequence are multiplied by the number of sequences in the database to give an estimate of the expected number of falsepositive matches with that p-value or less. This provides a statistically motivated measure of the significance of the similarity of the sequence and the other members of the family. Having such an objective criterion for deciding whether or not low-scoring sequences may indeed be distantly related to a given biological sequence family greatly enhances the usefulness of sequence comparisons. We have shown that our method for combining match scores gives extremely accurate p-values and excellent selectivity and sensitivity in sequence homology searches. Some care must be taken to ensure that no pairs of motifs in the query are too similar or some p-values may be underestimated. The Pearson correlation coefficient motif-similarity metric suggested by Pietrokovski (1996), divided by the width of the shorter motif, is extremely useful in this regard. Removing motifs with pairwise similarities >0.6 with other motifs in the same query according to this measure ensures that the p-value estimates will be good. MAST calculates and prints the similarities of all pairs of motifs in the query to aid the user in identifying motifs that should be removed from future queries. In the future, it may be possible to extend these results to the combination of additional information using a similar approach. For instance, sequence motifs typically occur in a specific, known order in a sequence family. The ordering and spacing of motifs, therefore, provide powerful additional criteria for classifying sequences into families. If one could calculate a p-value for the observed spacing that was independent of the motif score p-values, this p-value could be combined with the score p-values in the product. This might further improve the selectivity of the classification. Another approach might be to constrain the ordering of the motifs and not allow overlaps. P-values for the observed spacing could be computed and combined with the match score p-values. Not allowing motif occurrences to overlap would solve the problem of exaggerated p-values, but it is not yet known how to compute the match score p-values in this case.
Acknowledgements This work was supported by the National Biomedical Computation Resource, an NIH/NCRR funded research resource
54
(P41 RR-08605), and the NSF through cooperative agreement ASC-02827. We would like to thank Dr Ruth J.Williams of the UCSD mathematics department and Dr Gplenn Sager of the San Diego Supercomputer Center for invaluable assistance.
References Bailey,T.L. and Elkan,C. (1995) Unsupervised learning of multiple motifs in biopolymers using EM. Machine Learn., 21, 51–80. Bailey,T.L. and Gribskov,M. (1996) The megaprior heuristic for discovering protein sequence patterns. In States,D.J., Agarwal,P., Gaasterland,T., Hunter,L. and Smith,R. (eds), Proceedings of the Fourth International Conference on Intelligent Systems for Molecular Biology. AAAI Press, Menlo Park, CA, pp. 15–24. Bailey,T.L. and Gribskov,M. (1997) Score distributions for simultaneous matching to multiple motifs. J. Comput. Biol., 4, 45–59. Bairoch,A. (1994) The SWISS-PROT protein sequence data bank: current status. Nucleic Acids Res., 22, 3578–3580. Bairoch,A. (1995) The PROSITE database, its status in 1995. Nucleic Acids Res., 24, 189–196. Feller,W. (1957) An Introduction to Probability Theory and its Applications, Vol. 2, 2nd edn. John Wiley & Sons, New York. Fisher,R.A. (1970) Statistical Methods for Research Workers, 14th edn. Oliver and Boyd, Edinburgh. Gribskov,M. and Robinson,N.L. (1996) The use of receiver operating characteristic (ROC) analysis to evaluate sequence matching. Comput. Chem., 20, 25–33. Henikoff,S., Henikoff,J.G., Alford,W.J. and Pietrokovski,S. (1995) Automated construction and graphical presentation of protein blocks from unaligned sequences. Gene, 163, GC17–GC26. Neuwald,A.F., Liu,J.S. and Lawrence,C.E. (1995) Gibbs motif sampling: Detection of bacterial outer membrane protein repeats. Protein Sci., 4, 1618–1632. Oosterhoff,J. (1969) Combination of One-Sided Statistical Tests. Mathematisch Centrum, Amsterdam. Pietrokovski,S. (1996) Searching databases of conserved sequence regions by aligning protein multiple-alignments. Nucleic Acids Res., 24, 3836–3845. Press,W.H., Teukolsky,S.A., Flannery,B.P. and Vetterling,W.T. (1995) Numerical Recipes in C. Cambridge University Press, Cambridge. Staden,R. (1990) Methods for calculating the probabilities of finding patterns in sequences. Comput. Applic. Biosci., 5, 89–96. Tatusov,R.L., Altschul,S.F. and Koonin,E.V. (1994) Detection of conserved segments in proteins: iterative scanning of sequence databases with alignment blocks. Proc. Natl Acad. Sci. USA, 91, 12091–12095.