Middle States Geographer, 2003, 36: 106-112
COMBINING SUPERVISED CLASSIFICATION AND AIRPHOTO
INTERPRETATION OF HIGH SPATIAL RESOLUTION SATELLITE
IMAGERY FOR LAND USE ANALYSIS
Tao Tang
Department of Geography and Planning
State U ni versity of New Yark - College at Buffalo
1300 Elmwood Ave., Buffalo, NY, 14222-1095, USA
Phone: 716-878-4138; Email:
[email protected]
ABSTRA C1':
This stu dv combines methods of supervised classification and aerial photo interpretation for land lise analvsis using high spatia! resolution satellite imagery. A multi-spectral !KONOS ill/age with four-meter spatia! resolution ill Beljillg, China was used to conduct the study. Simplified Land-Based Classification Standards (LBCS) bv tlt« American Platuiiu g Association (APA) \l'as applied to formulate the classification scheme. The spatia! distribution of tlie laud lise categories was extracted [rom the imagen> using conventional, fuz:» logic, and single categorv targeted classifications ill the ldrisi remote sensing system. All aerial photo interpretation uictliod was incorporated with tltc supervised classifications to ininimi;« the error identification and uncertainty classes. TILe results suggest that the combined approach call both help ill eliminating the uncertainty classes of imagery classification and culiance the production speed of latul lise mapping ill large areas using higl: spatia! resolution illloges. The results also indicate tliat commercial and residential buildings of both low-rise and high-rise illcrease sporadicallyfrom tltc center to outskirts ill downtown Beijing.
classification exists in both of these two approaches because they largely rely on spectral classifications by computer systems (Congation, 1988; Wang, 1990; Sharma and Sarker, 1(98). Meanwhile, aerial photograph interpretation and photogrammctry have long been applied for extracting thematic data in high spatial resolution aerial photos. Visual aerial photograph interpretation is largely based on human examination of images for the purpose of identifying spatial objects (Philipson, 1997; Jensen, 20(0). This study combines methods of both supervised classi fication and aerial photo interpretation for land use analysis using high-spatial-resolution imagery. This approach can help to eliminate the uncertainty classes in the imagery classification on one hand. On the other hand, it can classify large areas using a large quantity of image data automatically. Vector based GIS mapping and map layer overlay were applied in this study to combine the information extracted. Ad vancement of the sensors of space remote sensing Increased the interpretation capability of satellite images. The IKONOS satellite that was
INTRODUCTION
Thematic information extraction of spatial objects on the Earth's surface in remote sensing can be accomplished by applying either supervised classification (Jensen, 1978; Mather, 1985; Mausel et al., 1990; Wang, 1(90) or unsupervised c Iassi fication (Richards, 1986; Skidmore, 1989; Jahne, 1991; Rigbot, 1(94) of Imagery pixels. Supervised classi tication identifies the spectral signature! s) of the expected land use or land cover classes first. Then, a procedure is used to evaluate the likelihood that each of the image pixels belongs to which of the identified classes. Unsupervised classification, by contrast, classifies the distinctive reflectance patterns on the imagery first. It then correlates each class with real world land use features. The supervised classification is thus a decision making process based upon available information, while, unsupervised classification is actually a process of segmentation of the image (Eastman, 1(99). Uncertainty imagery
106
Supervised Classification and Airphoto Interpretation for Land Use Analysis
schemes are: 1) lack of a comprehensive inventory of land use types, land cover types, and other common land-based information terms; 2) lack of standards for sharing land-based information and data between land use applications (Jeer, 1997). The LBCS is one of the land use classification systems that provides comprehensive schemes and flexibility of sharing information across different disciplines. The LBCS is a multi-dimensional land use classification scheme that comprises five dimensions. These are: activity, function, structure, site development characteristics, and ownership. Land use types are organized with a particular set of characteristics in each of the dimensions. For example, acti vity refers to the actual use of land based on its observable characteristics, such as farming, shopping, vehicular movement, etc. Structure refers to the type of structure or building on the land, such as single-family house, office building, highway, etc. The land use classification scheme of this study was simplified from the structural dimension of the LBCS system (APA, 1999) and it is shown in Table 1. The IKONOS image was first imported into the Idrisi remote sensi ng and image processi ng system. It was then transposed counter-clockwise by 90-degrees to align with standard map orientation where the upper edge is the north. Three visible
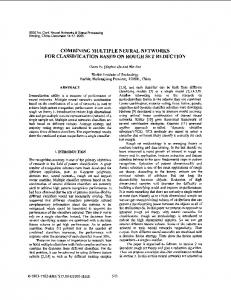
launched in 1999 generates panchromatic images with one-meter spatial resolution, and multi-spectral images with four-meter spatial resolution (Space Imaging, 1999). These spatial resolutions are similar to that of aerial photographs. One multi-spectral IKONOS image in downtown Beijing, China was used to conduct detailed land use classification in this study. It is a true color image with three visible bands namely blue, green, and red. The image was collected in October 20, 1999. It covers one square kilometer on the ground (Figure 1).
METHODS AND APPROACHES The land use classification scheme applied in this study was modified from the Land-Based Classification Standards (LBCS) developed by the American Planning Association (APA, 1999). Land Based Classification Standards provide a consistent model for classifying land use types based on their characteristics. Various land use classification systems have been published for different kinds of applications (Hardy et aI., 1971; Erie County Department of Environment and Planning, 1997; etc.). However, the common difficulty of these ~~~
Figure 1. Sample of Ikonos satellite imagery of downtown Beijing, China
107
Middle States Geographer, 2003, 36: 106-112 Table 1. Land Use Classification Scheme Simplified from LBCS of APA
LBCS Code 1100 1250 1290 2150 2050 4440 5130 5700
Acronym
Land Use Description Single Story Residential Multifamily Low Rise Residential Multifamily High Rise Residential Commercial Office, Bank, Store, or Shop Building Industrial Parks and Historical Highway and Street Railroad Facility
SSR MLRR MHRR OBSSB IDST PH HS RF
reduce inaccurate identifications. Fuzzy logic is a mathematical theory that was proposed in ISlC)) and was developed in the 1980s and 1990s to improve the relationship between humanity and computer systems (Tcrano et al., 1992). The objective of developing fuzzy set theory is to combine human and computer capabi lities together. Fuzzy set theory provides useful concepts and tools in dealing with rmprccisc information in remote sensing data. It was applied to incorporate with supervised classifications recently (Wang, 1990; Eastman, 19(9). Fuzzy signature files were developed for each of the categories. This was accornpl ished usmg the "soft-c lassi Iicr" of HJCLASS. The sofr-classifier is different from the conventional hard-classifier in two ways: (I) each pixel is judged by a degree or probability to a particular category; (2) the classification expresses the degree of membership (between 0 and I) of pixels to the c Iassificd sets accord ing the se leered classification method. Classification accuracy was improved lor some categories using supervised fuzzy logic classification, while that of others was reduced. Inaccurate identifications and uncertainty or multifamily low rise residential (MLRRl, and parks
bands of the multi-spectral image were separated. These are: blue (0.42-0.51 11m), green (0.52-0.60 Jlm), and red (0.63-0.69 11m). Vector themes of training sites were developed for each of the bands according to the classification scheme established and the information from field investigation. The appropriate themes of training sites were then overlayed on each of the three bands of the multi spectral image to develop electromagnetic reflectance signatllres. Supervised classi fication was conducted for the three bands of the multi-spectral image using the hard classifier of Minimum Distance to Means (MINDIST). The hard classifier in Idrisi represents the conventional classification method that yields definite classification of a pixel into a particular category. 13y contrast, the soft classifier only determines the degree to which a pixel belongs to a particular class (Eastman, 1999). The result of supervised classification is shown in Figure 2. The classification, In general, extracted different catcgories of land use across the study area. l lo wcvcr. uncertainty classes and inaccurate identifications exist. An error assessment in Idrisi is shown in Table 2. The errors of commission in this study indicate where locations mapped as a particular category that was found to be truly something else. The values expressed in Table 2 are the proportions of sampled error occurrence on 90 percent confidential interval. Examining the results visually (Figure 2). some public and historical (PH) land uses, such as part of the Tiananmen Square were classified as Single Story Residential (SSR) in this case. Patches of pixels in the residential or commercial areas were classified as highways and streets (HS), although streets in general were very well identified. Some pixels of streets were also identified as parks and historical land use (PH). The supervised fuzzy logic classification III Idrisi was also applied in this study attempting to
Table 2. The Errors of Commission of Supervised Classi fication
=-'-'----------- Land Use Category Error SSR MLRR MHRR OBSSB
108
0.819 0.764 0.682
IDST PH HS
0.377 0.811 0.561 0.632
RF
0.695
Figure 109
SupervisedClassificationandAirphoto Interpretationfor Land UseAnalysis
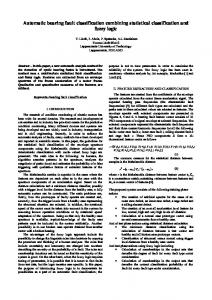
Figure2. Supervisedclassificationof land use in downtownBeijing, China
3. Exampleof single categorytargetedclassificationanalysis
Middle States Geographer, 2003,36: 106-1 12
and historical land use (PH) in the study area were reduced, while, the error identification of pixels of single story residential (SSR) and streets (HS) was increased. Inaccurate classifications still exist using the fuzzy logic ll1eth(.d, in particular when the entire classification scheme was processed. A combined approach of aerial photo interpretation, supervised fuzzy logic classifications, and map layer overlay applying GIS was adopted to reduce the outcome of inaccurate identification and uncertainty classes. First, each category of land use types was classi fied separately against another category that is closely related to it in terms of reflectance signature in the classification regime. The target land use category was attributed as 60 percent in probability of occurrences and that of the uncertainty production category as 40 percent in the classification to identify the error patterns. Secondly, both the land use classification of all the categories using fussy logic (FUZCLASS) and single category targeted classifications were exported into ArcView GIS as reference themes for the land use mapping. The raster images were converted into vector database format. Thirdly, aerial photo interpretation was conducted on the original imagery to identify the land use category where error identification and uncertainty class occurred in the fuzzy logic or single category targeted classifications. Aerial photo interpretation method was only used for quality control of the land use identifications in this process. Finally, the vector layers of single land use category were combined using map overlay to produce the land use classification map.
Table 3. The Errors of Commission of Single Category Targeted Classification
Land Use Category SSR MLRR MHRR OBSSB IDST PH HS
RF
Error 0.241 0.058 0.511 0.537 0.267 0.244 0.269 0.441
across the study area. The MLRRs are mainly distributed in the central areas south of the Tiananmen Square and the Changan Boulevard, while the MHRR tends to occupy the outskirts of the study area. The identification accuracy was drastically increased using supervised fuzzy logic classification to identify each of individual categories (Table 3). Aerial photo interpretation of uncertainty classes and translation of land usc polygons lrorn raster format to vector format in Idrisi and Arc View GIS were conducted for each of the categories. The eight layers of different land use identified were then combined into one theme using map overlay in ArcView GIS. Error identification and uncertainty classes were thus minimized from the original outcomes of supervised classifications. The result of combined approach is shown in Figure 4. The results of land use classification indicated that the commercial land use of office buildings, banks, and shopping centers either cluster along the major streets and avenues or concentrated in the north part of the study area, particularly along the Changan Boulevard. Residential, commercial, and industrial land uses are well mixed in downtown Beijing. Single story traditional houses (SSR) and low-rise multifamily buildings (MLRR) mainly occupy the center of the study area south of the Tiananmen Square. High rise residential buildings (MIIRR) gradually increase from the center outward in the study area in Beijing. The objective of the single category targeted classification is to identify spatial distribution of inaccurate classification and uncertainty of one category by supervised image classifications. The
RESULTS AND DISCUSSION
The single category targeted classifications were performed to visualize the spatial distribution of a particular land use category. The paired-category selected for this approach is the one that makes the most error identifications to the target category. Or in other words, it is the one with closest signature of reflectance to the target category. For example, the target category of Multifamily Low Rise Residential (MLRR) contrasting to Multifamily High Rise Residential (MHRR) is shown in Figure 3. The result shows the distributions of the MLRR and MHRR
110
Supervised Classification and Airplioto Interpretation/or Land Use Analvsis
Legend
ACKNOWLEDGEMENTS
LAND_USE DHS
~IDST
CITi MHRR l.:iJ MLRR t~::~: ":) OBSSB ~J
L~PH RF
L~~
SSR
The author would like thank the Space Imaging, Inc. for providing the IKONOS satellite images for this study. He would also like to thank the two anonymous reviewers for their helpful comments on an earlier draft.
1 :~,882
REFERENCE Figure 4. Land use classification by combined approaches in down town Beijing, China
American Planning Association (APA). 1999. Land Based Classification Standards (LBCS). American Planning Association Research Department. http://www .planni ng.org/l bcs.
mean error of commission in conventional supervised classification of this study is 0.668, and that of the fuzzy logic classification is 0.678. By contrast. the mean error of commission in single category targeted classifications is 0.321. The results indicate that the accuracy of feature identification increased drastically from multi-category classifications to the single category targeted classifications. The results of this study also suggest that the combined approach of computer intelligence based and human intelligence based classifications can enhance both accuracy and production speed of land use mapping in large areas using high spatial resolution satellite images. Studies of land use and urban sprawl in Beijing (Gaubatz, 1995; Chen et al., 2000) indicated that the built-up area was increased by about 39 percent during the period from 1987 through 1994. The green space or recreation areas in Beijing were also increased by 8.6 percent from 1987 to 1994 (Chen et al., 2000). Previous research (Huus, 1994; Guubatz, 1995; USGS EROS Data Center, 1999) identified distinctive spatial patterns of land use between Beijing and typical U.S. cities. Most U.S. cities, such as New York City, are often shaped like a circus tent, with a sharp peak of skyscrapers in the center, sloping off to mid-rise buildings and then low suburbs of single-family houses. By contrast, Beijing is bowl-shaped, with low-rise historical buildings in the center that arc surrounded by commercial skyscrapers and residential towers. The results of this study indicate that commercial and residential buildings of both low-rise and high-rise increases sporadically from downtown out. while the bowl shaped pattern does exist.
Chen, Shupeng, Shan Zeng, and Chuang Xic, 2000. Remote Sensing and GIS for Urban Growth Analysis in China. Photograuunctric Engll/cl'/illg and Remote Sensing 66(5 ):593-598.
Congalton, R.G. 1988. Using Spatial Autocorrelation Analysis to Explore the Errors in Maps Generated from Remotely Sensed Data. Phot ogrannnctrir Engineering and RCII/ote SClising 54(5):587-592.
Eastman, J.R. 1999. ldrisi 32 - Guide to GIS and lniagc Processing. vol. 02. Clark University. 170pp.
Erie County Department of Environment and Planning. 1997. Cazenovia Creek Watershed Management Program - Phase 1 Report: ldcnti]» and Map Laud Use Activities and Potential Non-Point Pollution Sources ill the Cazenovia Creek SII!JI)([sin. 63p.
Gaubatz, P. 1995. Changing Geographical Review 85( J ):79-96.
III
Beijing.
The
Middle States Geographer, 2003, 36: 106-112
Hardy, E.E. Shelton, R.L., Belcher, D.J. and Roach, 1.1'. 1971. New York State Land Use and Natural Resources lnventory Final Report- volume If. 199p
Richards, 1.A J986. Remote Sensing and Digi1a1 III/age Analysis. New York: Springer-Verlag.
Rignot, E.J. 1994. Unsupervised Scguientation of Polarimetric SAR Data. NASA Tech Briefs, 18(7):46-47.
Huus, K. 1994. No Place Like Home - Beijing is Remarking Itself, but for Whose Benefit'? Eastern Economic Review J57(30):72-73.
Far
Sharma, K.M.S. and Sarkar, A 1998. A Modified Context ural Classification Technique for Remote Sensing Data. Photogrannnctrir Engineering and Remote Sensing 64(4):2D-280.
Jahne , B. 1991. Digital III/age Processing. New York: Springer-Verlag, pp. 219-230.
Jeer, S. 1997. LilCS Discussion Issues: Paper fur the LBCS workshop, American Planning Association publication.
Skidmore, AK. 1989. Unsupervised Training Area Selection in Forests Using a Nonparametric Distance Measure and Spatial Information. international Journal of Remote Sell sing 1O( 1): 133- 14(1.
Jensen, 1.R. 1978. Digital Land Cover Mapping Using Layered Classification Logic and Physical Composition Attributes. American Cartographer 5:121-132.
Space Imaging. 1999. Space III/aging Catalog o] the Products and Services, Trornton. CO: Space Imaging. Inc .. Yol.1.
Jensen, J .R. 2000. Remote Sensing of the Environment - An Earth Resource Perspective. Upper Saddle, N.J.: Prentice Hall.
Tcrano. T .. Asai, K .. and Sugcno, M. I()92. hr;;y Svstems Theon' and Its ;\ppIiUItioIlS. San Diego: Academic Press.
Mather. P.M. 1985. A Computationally Efficient Maximum Likelihood Classifier Employing Prior Probabilities for Remotely Sensed Data. lntcnmtional Journal of Gcographica! lnfonnation Svstcms 6:369-:n6.
USGS EROS Data Center. 1999. Eartlrsliots Sth cd.. www.usgs.gov/Earthshots
Wang, F. 1990 Fuzzy Supervised Classification of Remote Sensing Images. IEEE Transactions on Geoscience and Remote Scnsins; 28(2): 194-20 I.
Mausel, P.W., Kamber. W.J. and Lee, 1.K. 1990. Optimum Band Selection for Supervised Classi fication of Mu Itispectral Data. Pliotogrammctric Engineering and Remote Sensing 56(1):55-60
Philipson, W. 1997. Manual uf Photographic 1111 Interpretation. 2 Ed.. Bethesda. MD: American Society for Photogrammetry and Remote Sensing.
112