Atmospheric Chemistry and Physics Discussions
Discussion Paper
Commentary on using equivalent latitude in the upper troposphere and lower stratosphere
|
This discussion paper is/has been under review for the journal Atmospheric Chemistry and Physics (ACP). Please refer to the corresponding final paper in ACP if available.
Discussion Paper
Atmos. Chem. Phys. Discuss., 11, 33095–33126, 2011 www.atmos-chem-phys-discuss.net/11/33095/2011/ doi:10.5194/acpd-11-33095-2011 © Author(s) 2011. CC Attribution 3.0 License.
ACPD 11, 33095–33126, 2011
Commentary on using equivalent latitude L. L. Pan et al.
Title Page Introduction
Conclusions
References
Tables
Figures
J
I
J
I
Back
Close
|
Abstract
1
National Center for Atmospheric Research, Boulder, Colorado, USA Texas A&M University, College Station, Texas, USA * ¨ ¨ now at: Forschungszentrum Julich, Julich, Germany ** now at: Science System Applications, Greenbelt, Maryland, USA 2
Discussion Paper
L. L. Pan1 , A. Kunz1,* , C. R. Homeyer2 , L. A. Munchak1,** , D. E. Kinnison1 , and S. Tilmes1
|
Correspondence to: L. L. Pan (
[email protected]) Published by Copernicus Publications on behalf of the European Geosciences Union.
|
33095
Discussion Paper
Received: 10 October 2011 – Accepted: 28 November 2011 – Published: 15 December 2011
Full Screen / Esc
Printer-friendly Version Interactive Discussion
5
Discussion Paper |
33096
|
25
Potential vorticity (PV) based equivalent latitude (EqLat) and potential temperature (θ) are widely used in the stratospheric chemistry and dynamics community as a set of Lagrangian coordinates (e.g., Butchart and Remsberg, 1986; Lait et al., 1990; Schoeberl et al., 1992; Randel et al., 1998; Manney et al., 1994, 1999; Pan et al., 2002; Kanzawa et al., 2003; Juckes, 2007). Because PV and θ are nearly conserved on the synoptic time scale, the “PV–θ” view is effective in various dynamics and circulation studies (Hoskins, 1991). For example, the EqLat coordinate largely conceals
Discussion Paper
20
ACPD 11, 33095–33126, 2011
Commentary on using equivalent latitude L. L. Pan et al.
Title Page Abstract
Introduction
Conclusions
References
Tables
Figures
J
I
J
I
Back
Close
|
1 Introduction
Discussion Paper
15
|
10
We discuss the use of potential vorticity (PV) based equivalent latitude (EqLat) and potential temperature (θ) coordinates in the upper troposphere and lower stratosphere (UTLS) for chemical transport studies. The main objective is to provide a cautionary note on using EqLat–θ coordinates for aggregating chemical tracers in the UTLS. Several examples are used to show 3-D distributions of EqLat together with chemical constituents for a range of θ. We show that the use of PV–θ coordinates may not be suitable for several reasons when tropospheric processes are an important part of a study. Due to the different static stability structures between the stratosphere and troposphere, the use of θ as a vertical coordinate does not provide equal representations of the UT and LS. Since the θ surfaces are often quasi-vertical in the troposphere, the θ coordinate does not work well distinguishing the UT from the boundary layer. We further discuss the duality of PV/EqLat as a tracer versus as a coordinate variable. Using an example, we show that while PV/EqLat serves well as a transport tracer in the UTLS region, it may misrepresent the effect of transport when used as a coordinate to average chemical tracers. Overall, when choosing these coordinates, considerations need to be made not only based on the time scale of PV being a conservative tracer, but also the specific research questions to be addressed.
Discussion Paper
Abstract
Full Screen / Esc
Printer-friendly Version Interactive Discussion
33097
|
Discussion Paper | Discussion Paper
25
ACPD 11, 33095–33126, 2011
Commentary on using equivalent latitude L. L. Pan et al.
Title Page Abstract
Introduction
Conclusions
References
Tables
Figures
J
I
J
I
Back
Close
|
20
Discussion Paper
15
|
10
Discussion Paper
5
reversible meridional transport caused by planetary and synoptic-scale waves, just as θ-coordinates conceal reversible (adiabatic) vertical motion. Their use eliminates many of the problems with computing zonal averages in conventional Eulerian coordinates. This set of coordinates has been especially effective in studies of polar stratospheric processes, because EqLat based chemical tracer analyses serve to separate dynamical variability from chemical processing, both of which contribute to the ozone budget in and around the polar vortex. The growing interest in the chemistry and dynamics of the upper troposphere and lower stratosphere (UTLS) has fostered the desire for similar Lagrangian coordinates for the tropopause region. PV based EqLat has been used in UTLS transport analyses (e.g., Haynes and Shuckburgh, 2000; Berthet et al., 2007), compiling trace gas climatologies from sparsely sampled data (e.g., Hoor et al., 2004; Hegglin et al., 2006) and to perform comparisons between models and observations (e.g., Strahan et al., 2007). Since PV is known as an effective tracer of stratospheric air mass, the PV based EqLat serves to obtain zonal average behavior of the region with the air mass grouped according to dynamical conditions. Similar to the role of the polar vortex edge in the overworld (where the θ surfaces lie entirely in the stratosphere; Hoskins, 1991), the tropopause is a significant dynamical boundary that separates air masses of distinct chemical compositions in the middleworld (where the θ surfaces intersect the extratropical tropopause; Hoskins, 1991). The tropopause region, however, is significantly different from the polar vortex region in the behavior of both PV and θ. In the polar stratosphere, PV is a quasi-conservative dynamical variable both inside and outside of the polar vortex. This is not the case for the tropopause region when the upper troposphere is of significant interest. From the perspective of time scales involved, the dynamical variability in the polar stratosphere is largely dictated by isentropic processes with a synoptic time scale of a week to 10 days. In the UTLS region, convective process in the time scale of a few hours can play a significant role in redistributing chemical species and diabatically modifying PV. In addition, the PV based Eqlat is derived in an isentropic coordinate system. In the polar stratosphere, isentropes are quasi-lateral and serve well as vertical coordinates.
Full Screen / Esc
Printer-friendly Version Interactive Discussion
33098
|
Discussion Paper | Discussion Paper
25
ACPD 11, 33095–33126, 2011
Commentary on using equivalent latitude L. L. Pan et al.
Title Page Abstract
Introduction
Conclusions
References
Tables
Figures
J
I
J
I
Back
Close
|
20
Discussion Paper
15
|
10
Discussion Paper
5
In the UTLS, however, isentropes can be quasi-vertical. These are perhaps the most significant distinctions between the polar vortex edge and the tropopause. Despite these distinctions, EqLat–θ may still be a preferred coordinate system for many UTLS applications. In this note, we discuss some potential problems of using EqLat in the UTLS for chemical tracer analyses. We examine EqLat as a 3-D variable, together with chemical tracers, and θ as a vertical coordinate variable in the UTLS region in contrast to latitude and pressure/altitude coordinates to make several points. These discussions may help recognize some unintended consequences of using EqLat–θ coordinates in aggregate chemical measurements. It is not the goal of this discussion to address the general applicability of EqLat in the UTLS but rather to note that when considering these coordinates it is important to determine whether the use of these coordinates clarifies or obscures the issues of a particular research question. The discussion should also help to consider EqLat–θ coordinates within a suite of complementary methods for aggregating data in the UTLS, including tropopause relative coordinates (Pan et al., 2004; Tilmes et al., 2010), jet stream based coordinates (Ray et al., 2004; Manney et al., 2011), and tropopause relative latitude coordinates (Kunz et al., 2011b). One specific example is the use of PV/Eqlat as a tracer versus a boundary/coordinate for zonal averaging. This is a frequently encountered issue in stratosphere-troposphere exchange (STE) studies. On the one hand, we identify stratospheric contribution to the troposphere using high PV as a signature. On the other hand, we use PV-based EqLat to aggregate trace gas species, which in effect removes the contribution of exchanged air mass from the tropospheric average because of their high PV signature. Similar situations may occur in the other direction of STE where tropospheric intrusions are observed to be associated with low PV therefore low EqLat (Pan et al., 2009). We use an example to show that an EqLat based zonal average conceals these events. The example raises a general question that how well EqLat climatologically separates reversible (wave) from the presence of irreversible (wave breaking) transport.
Full Screen / Esc
Printer-friendly Version Interactive Discussion
| Discussion Paper |
33099
Discussion Paper
25
ACPD 11, 33095–33126, 2011
Commentary on using equivalent latitude L. L. Pan et al.
Title Page Abstract
Introduction
Conclusions
References
Tables
Figures
J
I
J
I
Back
Close
|
20
Discussion Paper
15
|
10
Discussion Paper
5
This question is particularly relevant to the on going studies of double tropopause phenomena. Increasing number of case studies have shown that double tropopause events in mid to high latitudes are often signatures of poleward Rossby wave breaking and are accompanied by chemical signatures of tropospheric air mass intruding into lower stratosphere above the subtropical jet and midlatitude tropopause (Randel et al., 2007; Pan et al., 2009, 2010, Homeyer et al., 2011). Statistics based on GPS satellite observations indicate that the maximum occurrence is in late winter and early spring (Randel et al., 2007; Peevey et al., 2011). In contrast, in a Lagrangian view of the tropopause using trajectory based statistical analyses, a ventilation layer, a layer similar to the secondary tropopause in the Eulerian view, is found to be more prevalent in summer in the EqLat–θ space (Berthet et al., 2007). Many factors may contribute to the apparent controversy in this case. We raise the question here whether and how much the use of EqLat versus the geographical latitude may have contributed to the differences. We begin with a brief summary of the EqLat calculation, followed by a comparison of EqLat–θ between the overworld polar stratosphere and the UTLS region. Then, the morphology of EqLat and chemical tracers at the middleworld isentropes, and the compactness of tracers in EqLat versus geographical latitude for the UTLS region are shown. Finally, we use an example to contrast the use of EqLat as a tracer versus as a coordinate variable. Two trace gas species, ozone (O3 ) and carbon monoxide (CO), are used to demonstrate the relationship between chemical trace gas and EqLat. These two chemical species are the most commonly used transport tracers in the UTLS region and one has its primary source in the stratosphere and the other in the troposphere. The chemical tracers are from the NCAR Whole Atmosphere Community Climate Model (WACCM).
Full Screen / Esc
Printer-friendly Version Interactive Discussion
2.1 WACCM model and the specified dynamics run
5
Discussion Paper
2.2 Calculation of EqLat
|
Equivalent latitude maps PV to latitude based on the area enclosed by the specific isopleth of PV. For each PV value, Pi , on a given isentrope, θj , there is a corresponding geographical latitude, φ, the area (of the polar cap) enclosed by which equals the area A(Pi ,θj ) covered by P > Pi . This corresponding latitude is defined as the equivalent latitude for Pi on isentrope θj , φe (Pi ,θj ). The above description can be written as:
Discussion Paper
33100
|
25
ACPD 11, 33095–33126, 2011
Commentary on using equivalent latitude L. L. Pan et al.
Title Page Abstract
Introduction
Conclusions
References
Tables
Figures
J
I
J
I
Back
Close
|
20
Discussion Paper
15
|
10
For analysis of EqLat and trace gas distributions, we use global output from version 4 of the NCAR Whole Atmosphere Community Climate Model with Specified Dynamics (SD-WACCM4). WACCM uses a free-running dynamical core that is adopted from the NCAR Community Atmosphere Model (CAM) and a chemistry module that is an extension of version 3 of the Model of OZone and Related Tracers (MOZART3) (e.g., Neale et al., 2011; Kinnison et al., 2007). In a recent validation effort, WACCM was shown to perform very well in comparisons with many other chemistry-climate models (SPARC CCMVal, 2010). For the specified dynamics (SD) run, wind and temperature fields are nudged, at each model time step, using the Goddard Earth Observing System 5 (GEOS-5) analysis. The nudging in effect allows SD-WACCM4 to perform as a chemical transport model and facilitates the comparisons with observations. A description of the SD approach is described in Lamarque et al. (2011). In this study, SD-WACCM4 is nudged with 1 % of the GEOS-5 meteorological fields (e.g., temperature, zonal and meridional winds, and surface pressure) every 30 min. Analyses are available daily at a horizontal resolution of 1.9◦ × 2.5◦ (lat × lon), 72 pressure levels in the vertical from the surface to ∼ 80 km, and a time resolution of 6 h. The vertical resolution in the model decreases with height and is ∼ 1–2 km in the UTLS.
Discussion Paper
2 Data, model and EqLat calculation
Full Screen / Esc
Printer-friendly Version Interactive Discussion
(1)
3 EqLat in the polar stratosphere
Discussion Paper
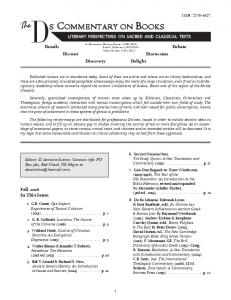
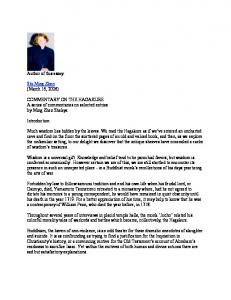
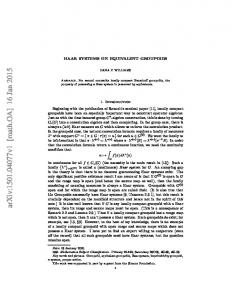
where R is the radius of Earth. In our calculation, the area enclosed by a given PV isopleth is calculated by summing the equivalent areas of each grid cell that has P ≥ Pi . To give an example of EqLat as an alternative representation of PV and how it compares to geographic latitude, we show in Fig. 1 areas enclosed by two selected PV contours on the 380 K θ surface on 15 February 2006. They are approximately 2 and ◦ ◦ ◦ ◦ 10 pvu, and correspond to 30 and 60 EqLat, respectively. In contrast to 30 and 60 geographic latitude circles, the EqLat field embodies the instantaneous PV field and provides a snapshot of the underlying conservative dynamics. Figure 2 shows the one-to-one relationship between PV and EqLat at three middleworld θ-levels (320, 350 and 380 K). This figure highlights that the re-mapping of PV to EqLat is non-linear. On the two lowest middleworld isentropes, large gradients of PV as a function of EqLat are concentrated in the mid-equivalent latitudes, i.e. near the strongest jet stream. These regions of strong gradient are in fact the locations of the tropopause (Kunz et al., 2011a). Away from these regions, both equatorward and poleward, PV is nearly homogenous and is a weak function of EqLat. The implication of this behavior to chemical tracer averaging will be discussed in later examples.
|
25
|
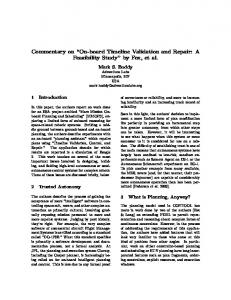
Trace gas distributions in the winter stratosphere are strongly influenced by vortex dynamics, and consideration of the vortex is essential when aggregating trace gas data. Figures 3 and 4 demonstrate how EqLat can be used to produce dynamically consistent averages of trace gas distributions. Figure 3 shows EqLat and CO mixing ratio from the WACCM model in the Northern Hemisphere (NH) on the 600 K θ surface on 15 February 2006. In this case, following a major stratosphere sudden warming (Coy et al., 2009) the air mass associated with the polar vortex is fragmented into three 33101
Discussion Paper
20
ACPD 11, 33095–33126, 2011
Commentary on using equivalent latitude L. L. Pan et al.
Title Page Abstract
Introduction
Conclusions
References
Tables
Figures
J
I
J
I
Back
Close
|
15
,
Discussion Paper
10
2πR 2
!
|
5
1−
A(Pi ,θj )
Discussion Paper
φe (Pi ,θj ) = sin
−1
Full Screen / Esc
Printer-friendly Version Interactive Discussion
| Discussion Paper
10
Discussion Paper
5
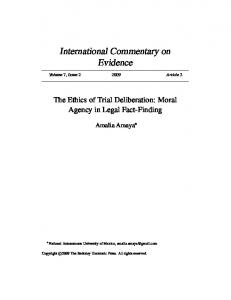
pieces (green shading). The piece containing highest EqLat is located near 45◦ N and 90◦ –120◦ E. There are corresponding signatures in the CO field. This well known correlation is produced by the descent of polar vortex air that brings higher CO produced by CO2 photolysis in the mesosphere and lower thermosphere into the stratosphere (Allen et al., 1999). Figure 4 compares scatterplots and averages of CO mixing ratio using the geographical latitude with that using EqLat. In geographical latitude coordinates, the vortex frag◦ ment with high CO near 45 N is averaged with low-CO air from outside the vortex to ◦ produce a small peak in zonal-mean CO near 45 N. The zonal-mean CO across all latitudes is nearly flat at around 20 ppbv. Averaging in EqLat-coordinates produces a very different picture, with CO enhanced by up to 50 ppbv in the vortex (poleward of 75◦ N in EqLat). This example demonstrates the utility of EqLat-coordinates in the polar stratosphere: these coordinates highlight the association of large CO abundance with polar vortex air, which is lost when viewed as function of geographical latitude.
ACPD 11, 33095–33126, 2011
Commentary on using equivalent latitude L. L. Pan et al.
Title Page Introduction
Conclusions
References
Tables
Figures
J
I
J
I
Back
Close
|
Abstract
|
33102
Discussion Paper
25
In contrast to the overworld, the representation of UTLS in the EqLat–θ coordinates requires some additional considerations. While isentropes are quasi-horizontal in the stratosphere, they are often quasi-vertical in the troposphere. From a slightly different perspective, the stratosphere is stable and stratified because of the large vertical gradient in θ, i.e., high static stability. The troposphere is relatively unstable and has near constant θ. These simple facts reflect the nature of these two atmospheric layers so named. As a consequence, in comparison to geometric or pressure coordinates, θ-coordinates expand the LS and compress the UT. This feature is illustrated in Figs. 5 and 6. Figure 5 shows a vertical cross section of static stability for 15 February 2006 along 120◦ W longitude. Also shown are the lapse-rate tropopause, the jet positions and selected PV isopleths. The two panels contrast the representation of vertical range from
|
20
4 EqLat and θ in the UTLS
Discussion Paper
15
Full Screen / Esc
Printer-friendly Version Interactive Discussion
| Discussion Paper |
33103
Discussion Paper
25
ACPD 11, 33095–33126, 2011
Commentary on using equivalent latitude L. L. Pan et al.
Title Page Abstract
Introduction
Conclusions
References
Tables
Figures
J
I
J
I
Back
Close
|
20
Discussion Paper
15
|
10
Discussion Paper
5
the ground to 20 km or 450 K in log-pressure altitude (left) and potential temperature (right) vertical coordinates. The two scales represent a similar vertical range. The main message of the figure is that in altitude space, the tropopause divides the lower stratosphere and troposphere roughly equally in terms of the area in the cross section. In θ space, on the other hand, the asymmetry is quite obvious with the entire troposphere reduced to a narrow layer. The relevance of this information to UTLS studies is that often times when potential temperature is used as the vertical coordinate, a layer of 20– 30 K above the tropopause is contrasted to a layer of 20–30 K below the tropopause. We want to point out here that, in the geophysical space, the former is a narrow layer of 1–2 km while the latter is often the entire troposphere. The asymmetry makes it less meaningful to compare the STE influence in these two layers. Figure 6 shows a cross section of EqLat as a 3-D variable, together with the tropopause and the jet locations, in both Log-pressure altitude and potential temperature vertical coordinates. In addition to showing the asymmetry of representing UT versus LS, the comparison of the wind and EqLat distribution highlights the role of the jet streams in the UTLS EqLat distribution. In the subtropics, the quasi-vertical isolines of EqLat are approximately perpendicular to and increase with latitudes across the strong subtropical jet, an indication that EqLat here serves well as a latitudinal coordinate variable. It is evident in this example how the jet structure is dominating the latitudinal PV variation. The high PV and associated high EqLat around the jets is accompanied by lower EqLat away from the jets, where the PV isolines are quasi-lateral and largely parallel to the isentropes. This structure raises the question whether the behavior is consistent with the UTLS chemical distribution and what implications are when using the coordinates for averaging chemical tracers. This is the focus of the next section.
Full Screen / Esc
Printer-friendly Version Interactive Discussion
5
| Discussion Paper |
33104
Discussion Paper
25
ACPD 11, 33095–33126, 2011
Commentary on using equivalent latitude L. L. Pan et al.
Title Page Abstract
Introduction
Conclusions
References
Tables
Figures
J
I
J
I
Back
Close
|
20
Discussion Paper
15
|
10
Although it is well known that PV is not a conservative tracer in the troposphere, PV based EqLat is often used to create zonal averages for aircraft data including both stratosphere and troposphere where the studies are mainly focused on stratospheric processes (e.g., Hoor et al., 2004, Hegglin et al., 2006, Engel et al., 2006). With an on going community effort of enhancing the representation of stratosphere and troposphere chemistry in the new generation of chemistry climate models (CCMs), there is a need to identify an optimal method of aggregating research aircraft data, which often include both troposphere and lower stratosphere, for process oriented model evaluations. One question we consider here is to what extent EqLat–θ coordinates could serve the need and what would be unintended effects when both the stratosphere and the troposphere are all included. To provide a perspective, we show O3 and CO from the WACCM model for selected isentropes and in vertical cross sections. Note that these two species are the most commonly used stratospheric and tropospheric tracers, respectively, for transport studies in the UTLS region. They have very different relationships with EqLat. O3 , similar to PV, has strong stratospheric sources and is known to correlate with PV in the tropopause region (e.g., Danielsen, 1968; Browell et al., 1987; Pittman et al., 2009). CO on the other hand, has large anthropogenic origin and the surface value of CO has a strong relationship with geographical latitude (e.g., Novelli et al., 2003). Low CO air mass near the tropopause is often correlated with stratospheric influence. High CO air mass in the UT, on the other hand, may be an indication of convective transport or biomass burning, processes that are PV non-conservative. Figures 7–9 in this section aim to illustrate the behaviors of EqLat and tracers on several UTLS isentropes to shed light on the use of EqLat for aggregating tracer data in this region. Figure 7 shows a Northern hemispheric view of EqLat and O3 distributions on two selected isentropes (380 and 330 K). On the 380 K surface, the spatial patterns of EqLat and O3 are largely consistent. This is especially true for high EqLat and high O3 and
Discussion Paper
5 Eqlat and chemical tracers in the UTLS
Full Screen / Esc
Printer-friendly Version Interactive Discussion
33105
|
Discussion Paper | Discussion Paper
25
ACPD 11, 33095–33126, 2011
Commentary on using equivalent latitude L. L. Pan et al.
Title Page Abstract
Introduction
Conclusions
References
Tables
Figures
J
I
J
I
Back
Close
|
20
Discussion Paper
15
|
10
Discussion Paper
5
the gradient change in the region of the jet stream. The 380 K level is largely stratospheric, as indicated by Figs. 5–6. This is no longer the case at 330 K, a level that spans the middle troposphere in the tropics, the tropopause region in the midlatitudes and the lower stratosphere in the high latitudes. At this level, the high (polar) EqLats are shown to be strongly associated with the jet streams. The gradients of tracer distribution in the subtropics show a good consistency with the gradient of EqLat but lose correlation at high latitudes. If the O3 field is re-sampled using EqLat, the dynamical variability in the subtropics and mid-latitudes will be mapped consistently with the dynamical field. However, the air mass immediately poleward of the subtropical jet will be mapped to the polar region in EqLat. On the other hand, O3 in the polar region will be mapped into mid-equivalent latitudes. What produced this large difference between the EqLat and O3 in the polar latitudes is not entirely understood. We speculate that this relationship may be dependent on the seasonality of static stability in the polar UTLS, which reaches a minimum that is less than that in midlatitudes during winter in each hemisphere (e.g., Tomikawa et al, 2009; Grise et al, 2010). The displacements introduced here by the behavior, however, would create misrepresentation of transport. Figure 8 provides a cross section view of EqLat and chemical tracers in the UTLS region to complement the view on q-surfaces in the previous figure. Overall, the figure highlights the strong vertical gradients in the tracer cross-section, and the role of the tropopause in dictating the change in the tracer fields. In this particular cross section, three upper tropospheric jet streams, the subtropical, the polar and the Arctic jets, are clearly identifiable in the wind fields. In the region of the subtropical jet between 5– 15 km, the horizontal gradients of the tracers are consistent with the gradients of EqLat. Away from the subtropical jet, the variable EqLat shows weakened latitudinal gradient, which is consistent with the PV-EqLat relationship shown in Fig. 2. This figure suggests that while EqLat maybe effective regionally, away from the subtropical jet tropopause relative coordinates are more effective in representing the variability of the tracers. Note in the tropics (equatorward of the subtropical jet), there is a region of strong enhancement of CO, likely representing the influence of convective transport coupled
Full Screen / Esc
Printer-friendly Version Interactive Discussion
Discussion Paper |
33106
|
25
Discussion Paper
20
An important issue to consider when using EqLat is what scientific question we intend to address. Two scenarios we contrast in this section are using EqLat as a tracer to identify the transport origins versus as a coordinate for achieving a zonal average. Similar to the polar stratospheric studies, EqLat has been shown as an effective transport tracer in the UTLS. For example, several recent studies have shown that PV based EqLat is effective at identifying poleward intrusions of tropospheric air mass into lower stratosphere above the subtropical jet core (Pan et al., 2009; Homeyer et al., 2011). We use an example here to illustrate what happens in a tropospheric intrusion case if EqLat is used as a coordinate variable. This example is an event of irreversible
ACPD 11, 33095–33126, 2011
Commentary on using equivalent latitude L. L. Pan et al.
Title Page Abstract
Introduction
Conclusions
References
Tables
Figures
J
I
J
I
Back
Close
|
6 EqLat as a tracer versus as a coordinate variable
Discussion Paper
15
|
10
Discussion Paper
5
with local emission sources. This region is associated with negative EqLat, and will be mapped to the Southern Hemisphere undesirably in EqLat based zonal average. Figure 9 shows scatterplots of O3 as a function of latitude and EqLat and their respective zonal averages for the 330 and 290 K levels. The two levels are chosen to contrast LS and UT for mid to high latitudes. At the 330 K level, the compactness and zonal averages using the two latitude coordinates are significantly different. The large scatter of O3 in latitude reflects the latitudinal variation of the tropopause. The distribution in the EqLat coordinate is much more compact especially in the tropopause region ◦ (∼ 30 N EqLat and 100–200 ppbv of ozone). In the polar latitudes, the correlation is no longer as compact, which is consistent with the discussion of the plane view shown in Fig. 7. Nevertheless the figure indicates that the EqLat based average provides a better consistency with the dynamical background. In contrast, at the 290 K level (largely in the troposphere) both tropospheric chemistry and STE influence the O3 distribution. The low O3 scatters in the tropics (the points below 50 ppbv for example) are mapped into high EqLat, likely due to the non-conservative nature of PV at this level. This figure suggests that if tropospheric source, sink and chemistry is an important part of a study, the EqLat is no longer a physically meaningful coordinates.
Full Screen / Esc
Printer-friendly Version Interactive Discussion
33107
|
Discussion Paper | Discussion Paper
25
ACPD 11, 33095–33126, 2011
Commentary on using equivalent latitude L. L. Pan et al.
Title Page Abstract
Introduction
Conclusions
References
Tables
Figures
J
I
J
I
Back
Close
|
20
Discussion Paper
15
|
10
Discussion Paper
5
transport of tropospheric air into the lower stratosphere due to Rossby wave breaking, on 16 April 2008. A later stage of the event was sampled in situ by research aircraft during the START08 experiment (Pan et al., 2010). This wave breaking event and associated transport has been analyzed in detail (Homeyer et al., 2011). We illustrate the issues here using the SD-WACCM simulation of this time period. Figure 10 shows 380 K NH EqLat and O3 fields on 16 April 2008 from the SDWACCM run. The 6 pvu PV contours are superimposed on each map. There are multiple contours but only the greater one of which (the one that encloses the pole) represents the dynamic tropopause for this isentrope, determined using the PV gradient based definition described in Kunz et al. (2011a). The tropospheric intrusion air mass is seen as a “blob” of low EqLat (∼ 20◦ –30◦ ) and low O3 (∼ 100–200 ppbv) air ◦ ◦ separated from the tropical reservoir near 60 N and 140 W. This air mass, enclosed by the smaller one of the 6 pvu contours, highlights the fact that this is a bulk of tropospheric air, both dynamically and chemically, irreversibly embedded in the stratospheric background. The high consistency of EqLat and O3 indicates that the low O3 is not produced chemically but a result of transport. The figure, therefore, speaks for the effective role of EqLat as a transport tracer. Since the low O3 is in a cut-off air mass, despite the fact the correlation of O3 and EqLat is still intact, the transport is irreversible. In this case the irreversibility is also confirmed by the in situ tracer measurement (Homeyer et al., 2011). Figures 11–12 contrast the use of latitude and EqLat as the coordinate variable to do zonal average in this case, using data from the meridional section over the longitude ◦ ◦ range 110 –150 W. Figure 11 shows the O3 distribution in an isentropic dynamical tropopause relative coordinate, both in latitude and EqLat, for the 380 K level. In both cases, the zero represents the latitude or EqLat location of the isentropic tropopause (the greater contour of 6 pvu in this case). In each case, the colored points are those to be mapped to the opposite side of the tropopause depending on using the relative latitude or EqLat.
Full Screen / Esc
Printer-friendly Version Interactive Discussion
Discussion Paper |
We have identified three areas of concerns for using EqLat–θ coordinates in the UTLS region. The first one concerns the representation of troposphere in the EqLat–θ space. The EqLat–θ coordinates are fundamentally stratosphere focused (Fig. 5) and do not represent UT and LS equally. This point is relevant when tropospheric sources, sinks, 33108
|
25
Discussion Paper
7 Summary
ACPD 11, 33095–33126, 2011
Commentary on using equivalent latitude L. L. Pan et al.
Title Page Abstract
Introduction
Conclusions
References
Tables
Figures
J
I
J
I
Back
Close
|
20
Discussion Paper
15
|
10
Discussion Paper
5
As shown in Fig. 11a,b, the O3 –EqLat relationship is much more compact than O3 latitude, which reflects the strong correlation of O3 and PV in this region and speaks to the role of transport in the ozone distribution at this θ level. The large scatter of blue points on the positive side of the O3 -relative latitude relationship, however, highlights the fact that significant transport of low ozone air mass from troposphere to stratosphere are wrongly classified back to their transport origin if EqLat is used for zonal averaging. This issue is further highlighted in Fig. 12, where the sectional zonal mean for the region shows the low ozone air mass due to the transport when zonal average is done in latitude coordinate. On the other hand, this low ozone air mass is mapped back to the troposphere when EqLat is used to calculate the zonal mean. This example makes the point that compactness may not be the best argument for an effective coordinate variable. It really depends on the scientific question of interest. In polar vortex studies, more often the interest is to identify the chemical loss of ozone. In that case, removing the transport influence by using EqLat serves the right purpose. For UTLS tracer studies, very often the goal is to quantify the transport due to STE. Using EqLat in this case will map the transported air mass away from the region of interest and defeat the purpose of quantifying the influence of transport, as shown in this example. This example also shows that, although the use of EqLat is often intended to filter out the reversible part of the transport, it may not always been able to do so under the wave breaking scenarios. This example also has a specific implication in regard to the double tropopause statistics. As shown in the example, the wave breaking and associated double tropopause occurrence in this case will be concealed in the EqLat coordinate.
Full Screen / Esc
Printer-friendly Version Interactive Discussion
33109
|
Discussion Paper | Discussion Paper
25
ACPD 11, 33095–33126, 2011
Commentary on using equivalent latitude L. L. Pan et al.
Title Page Abstract
Introduction
Conclusions
References
Tables
Figures
J
I
J
I
Back
Close
|
20
Discussion Paper
15
|
10
Discussion Paper
5
and processes are important to a particular study. In the subtropics, the quasi-vertical behavior of the isentropes makes it difficult to use θ as a vertical coordinate globally with a clear distinction between the upper troposphere and the boundary layer. While the chemical composition in the UT is strongly coupled dynamically to the LS, the vertical transport of tracers is also important. The tropospheric tracer distribution is therefore often strongly coupled to the surface source, which makes geographical latitude a more relevant coordinate variable. The second area concerns the use of EqLat to aggregate chemical tracers in the region away from the jet stream. Using modeled tracers of O3 and CO, we show examples of the polar region being mapped to middle EqLats (Fig. 6) and the possibility of convectively influenced tropical upper troposphere being mapped to the south of the Equator (Fig. 8). Most importantly, in the third area, EqLat based zonal averages may conceal, in the presence of wave breaking, irreversible transport effect in the trace gas zonal mean, as shown in the last example (Figs. 10–12). Since PV (and EqLat) itself behaves as a tracer and is controlled by the dynamics and transport, using it as a coordinate, for the questions outlined in Sect. 6, will in effect obscure the transport and the dynamical variability of the trace gas. Whether the latitude or EqLat representation of wave breaking events has contributed to the differences in double tropopause studies should be examined in future work. An important message that comes out of these examples is that the choice of coordinate for averaging data in this region depends on the specific scientific question. Different from the stratospheric polar vortex studies, where quantifying chemical processing in the polar vortex air is usually the goal, the focus of the UTLS region is most often to quantify transport and exchange. Using a tracer that itself is influenced by the transport as a coordinate often convolutes the problem. A general interest of aggregating UTLS observations is also to identify transport boundaries and pathways associated with the meteorological patterns. It is often more effective to examine the chemical and dynamical tracers in parallel (Kunz et al., 2011b).
Full Screen / Esc
Printer-friendly Version Interactive Discussion
Discussion Paper
References
|
´ Allen, D. R., Stanford, J. L., Lopez-Valverde, M. A., Nakamura, N., Lary, D. J., Douglass, A. R., Cerniglia, M. C., Remedios, J. J., and Taylor, F. W.:, Observations of middle atmosphere CO from the UARS ISMAS during the early northern winter 1991/92, J. Atmos. Sci., 56(4), 563–583, 1999. Berthet, G., Esler, J. G., and Haynes, P. H.: A Lagrangian perspective of the tropopause and the ventilation of the lowermost stratosphere, J. Geophys. Res., 112, D18102, doi:10.1029/2006JD008295, 2007.
Discussion Paper
33110
|
25
ACPD 11, 33095–33126, 2011
Commentary on using equivalent latitude L. L. Pan et al.
Title Page Abstract
Introduction
Conclusions
References
Tables
Figures
J
I
J
I
Back
Close
|
20
Acknowledgements. The National Center for Atmospheric Research is sponsored by the National Science Foundation. The authors thank Kenneth Bowman, Eric Jensen and John Bergman for helpful suggestions.
Discussion Paper
15
|
10
Discussion Paper
5
More investigations are desirable to identify the most effective coordinates for characterizing UTLS transport. Studies have shown that tropopause relative coordinates work well to bring out the sharp chemical discontinuity across the tropopause (Pan et al., 2004; Tilmes et al., 2010). This method, however, is a one-dimensional averaging in the vertical, i.e. altitudinal, space. A similar approach for the horizontal dimension uses jet core relative wind speed as a coordinate for averaging in situ measurements (Ray et al., 2004), and it has shown to be effective for data analyses around the jet stream. This method, however, is limited to the regional scale. An extension of this method to the global scale, as recently proposed by Manney et al. (2011), combines the jet core relative latitudes in the horizontal dimension and the tropopause relative altitude in the vertical dimension. In a recent study, isentropic chemical gradient and PV gradients are examined together. The results show that the PV gradient based tropopause captures the chemical change well in general, and a relative latitude coordinate, similar to the relative altitude coordinate in the vertical dimension, can be used for aggregating data and making zonal averages (Kunz et al., 2011b). Well designed case studies comparing these different approaches with the EqLat–θ based zonal averages may help to identify the strengths and weaknesses of these different methods.
Full Screen / Esc
Printer-friendly Version Interactive Discussion
33111
|
| Discussion Paper
30
Discussion Paper
25
ACPD 11, 33095–33126, 2011
Commentary on using equivalent latitude L. L. Pan et al.
Title Page Abstract
Introduction
Conclusions
References
Tables
Figures
J
I
J
I
Back
Close
|
20
Discussion Paper
15
|
10
Discussion Paper
5
Browell, E. V., Danielsen, E. F., Ismail, S., Gregory, G. L., and Beck, S. M.: Tropopause fold structure determined from airborne lidar and in situ measurements, J. Geophys. Res., 92, 2112– 2120, 1987. Butchart, N. and Remsberg, E. E.: The area of the stratospheric polar vortex as a diagnostic for tracer transport on an isentropic surface, J. Atmos. Sci., 43 (13), 1319–1339, 1986. Coy, L., Eckermann, S., and Hoppel, K.: Planetary wave breaking and tropospheric forcing as seen in the stratospheric sudden warming of 2006, J. Atmos. Sci., 66, 495–507, 2009. Danielsen, E. F.: Stratospheric/tropospheric exchange based on radioactivity, ozone and potential vorticity, J. Atmos. Sci., 25, 502–518, 1968. ¨ ¨ Engel, A., Bonisch, H., Brunner, D., Fischer, H., Franke, H., Gunther, G., Gurk, C., Hegglin, M., ¨ Hoor, P., Konigstedt, R., Krebsbach, M., Maser, R., Parchatka, U., Peter, T., Schell, D., Schiller, C., Schmidt, U., Spelten, N., Szabo, T., Weers, U., Wernli, H., Wetter, T., and Wirth, V.: Highly resolved observations of trace gases in the lowermost stratosphere and upper troposphere from the Spurt project: an overview, Atmos. Chem. Phys., 6, 283–301, doi:10.5194/acp-6-283-2006, 2006. Grise, K. M., Thompson, D. W. J., and Birner, T.: A global survey of static stability in the stratosphere and upper troposphere, J. Clim., 23, 2275–2292, doi:10.1175/2009JCLI3369.1, 2010 Haynes, P. and Shuckburgh, E.: Effective diffusivity as a diagnostic of atmospheric transport 2. troposphere and lower stratosphere, J. Geophys. Res., 105(D18), 22795–22810, 2000. Hegglin, M. I., Brunner, D., Peter, T., Hoor, P., Fischer, H., Staehelin, J., Krebsbach, M., Schiller, C., Parchatka, U., and Weers, U.: Measurements of NO, NOy , N2 O, and O3 during SPURT: implications for transport and chemistry in the lowermost stratosphere, Atmos. Chem. Phys., 6, 1331–1350, doi:10.5194/acp-6-1331-2006, 2006. Homeyer, C. R., Bowman, K. P., Pan, L. L., Atlas, E. L., Gao, R.-S., and Campos, T. L.: Dynamical and chemical characteristics of tropospheric intrusions observed during START08, J. Geophys. Res., 116, D06111, doi:10.1029/2010JD015098, 2011. Hoor, P., Gurk, C., Brunner, D., Hegglin, M. I., Wernli, H., and Fischer, H.: Seasonality and extent of extratropical TST derived from in-situ CO measurements during SPURT, Atmos. Chem. Phys., 4, 1427–1442, doi:10.5194/acp-4-1427-2004, 2004. Hoskins, B. J.: Towards a PV – θ view of the general circulation, Tellus B, 43, 27–35, 1991. Juckes, M. N.: An annual cycle of long lived stratospheric gases from MIPAS, Atmos. Chem. Phys., 7, 1879–1897, doi:10.5194/acp-7-1879-2007, 2007.
Full Screen / Esc
Printer-friendly Version Interactive Discussion
33112
|
| Discussion Paper
30
Discussion Paper
25
ACPD 11, 33095–33126, 2011
Commentary on using equivalent latitude L. L. Pan et al.
Title Page Abstract
Introduction
Conclusions
References
Tables
Figures
J
I
J
I
Back
Close
|
20
Discussion Paper
15
|
10
Discussion Paper
5
Kanzawa, H., Sugita, T., Nakajima, H., Bodeker, G. E., Oelhaf, H., Stowasser, M., Wetzel, G., Engel, A., Schmidt, U., Levin, I., Toon, G. C., Sen, B., Blavier, J.-F. , Aoki, S., Nakazawa, T., Jucks, K. W., Johnson, D. G., Traub, W. A., Camy-Peyret, C., Payan, S., Jeseck, P., Murata, I., Fukunishi, H., von Koenig, M., Bremer, H., Kuellmann, H., Park, J. H. , Pan, L. L., Yokota, T., Suzuki, M., Shiotani, M., and Sasano, Y.: J. Geophys. Res., 108, 8003, doi:10.1029/2002JD002458, 2003. Kinnison, D. E., Brasseur, G. P., Walters, S., Garcia, R. R., Marsh, D. A., Sassi, F., Boville, B. A., Harvey, V. L., Randall, C. E., Emmons, L., Lamarque, J. F., Hess, P., Orlando, J. J., Tie, X. X., Randel, W., Pan, L. L., Gettelman, A., Granier, C., Diehl, T., Niemeier, U., and Simmons, A. J.: Sensitivity of chemical tracers to meteorological parameters in the MOZART-3 chemical transport model, J. Geophys. Res., 112, D20302, doi:10.1029/2006JD007879, 2007. ¨ Kunz, A., Konopka, P., Muller, R., and Pan, L. L.: Dynamical tropopause based on isentropic potential vorticity gradients, J. Geophys. Res., 116, D01110, doi:10.1029/2010JD014343, 2011a. Kunz, A., Pan, L. L., Konopka, P., Kinnison, D. E., Tilmes, S.: Chemical and dynamical discontinuity at the extratropical tropopause based on START08 and WACCM analyses, in review, J. Geophys. Res., , doi:10.1029/2011JD016686, in press, 2011b. Lait, L. R., Schoeberl, M. R., Newman, P. A., Proffitt, M. H., Loewenstein, M., Podolske, J. R., Strahan, S. E., Chan, K. R., Gary, B., Margitan, J. J., Browell, E., McCormick, M. P., and Torres, A.: Reconstruction of O3 and N2 O fields from ER-2, DC-8, and balloon observations, Geophys. Res. Lett., 17(4), 521–524, 1990. Lamarque, J.-F., Emmons, L. K., Hess, P. G., Kinnison, D. E., Tilmes, S., Vitt, F., Heald, C. L., Holland, E. A., Lauritzen, P. H., Neu, J., Orlando, J. J., Rasch, P., and Tyndall, G.: CAMchem: description and evaluation of interactive atmospheric chemistry in CESM, Geosci. Model Dev. Discuss., 4, 2199–2278, doi:10.5194/gmdd-4-2199-2011, 2011. Manney, G. L., Zurek, R. W., Gelman, M. E., Miller, A. J., and Nagatani, R.: The anomalous arctic lower stratospheric polar vortex of 1992–1993, Geophys. Res. Lett., 21(22), 2405– 2408, 1994. Manney, G. L., Michelsen, H. A., Santee, M. L., Gunson, M. R., Irion, F. W., Roche, A. E., and Livesey, N. J.: Polar vortex dynamics during spring and fall diagnosed using trace gas observations from the atmospheric trace molecule spectroscopy instrument, J. Geophys. Res., 104 (D15), 18841–18866, 1999. Manney, G. L., Hegglin, M. I., Daffer, W. H., Santee, M. L., Ray, E. A., Pawson, S., Schwartz,
Full Screen / Esc
Printer-friendly Version Interactive Discussion
33113
|
| Discussion Paper
30
Discussion Paper
25
ACPD 11, 33095–33126, 2011
Commentary on using equivalent latitude L. L. Pan et al.
Title Page Abstract
Introduction
Conclusions
References
Tables
Figures
J
I
J
I
Back
Close
|
20
Discussion Paper
15
|
10
Discussion Paper
5
M. J., Boone, C. D., Froidevaux, L., Livesey, N. J., Read, W. G., and Walker, K. A.: Jet characterization in the upper troposphere/lower stratosphere (UTLS): applications to climatology and transport studies, Atmos. Chem. Phys., 11, 6115–6137, doi:10.5194/acp-11-6115-2011, 2011. Neale, R. B., Richter, J., Park, S., Lauritzen, P H., Vavrus, S. J., Rasch, P. J. and Zhang, M.: The Mean Climate of the Community Atmosphere Model (CAM4) in Forced SST and fully coupled experiments, to be submitted to J. Clim., 2011. Novelli, P. C., Masarie, K. A., Lang, P. M., Hall, B. D., Myers, R. C., and Elkins, J. W.: Reanalysis of tropospheric CO trends: Effects of the 1997–1998 wildfires, J. Geophys. Res., 108(D15), 4464, doi:10.1029/2002JD003031, 2003. Pan, L. L., Randel, W. J., Massie, S. T., Kanzawa, H., Sasano, Y., Nakajima, H., Yokota, T., and Sugita, T.:Variability of polar stratospheric water vapor observed by ILAS, J. Geophys. Res., 107(D24), 8214, doi:10.1029/2001JD001164, 2002. Pan, L. L., Randel, W. J., Gary, B. L., Mahoney, M. J., and Hintsa, E. J.: Definitions and sharpness of the extratropical tropopause: a trace gas perspective, J. Geophys. Res., 109, D23103, doi:10.1029/2004JD004982, 2004. Pan, L. L., Randel, W. J., Gille, J. C., Hall, W. D., Nardi, B., Massie, S., Yudin, V., Khosravi, R., Konopka, P., and Tarasick, D.: Tropospheric intrusions associated with the secondary tropopause, J. Geophys. Res., 114, D10302, doi:10.1029/2008JD011374, 2009. Pan, L. L., Bowman, K. P., Atlas, E. L., Wofsy, S. C., Zhang, F., Bresch, J. F., Ridley, B. A., Pittman, J. V., Homeyer, C. R., Romashkin, P., and Cooper, W. A.: The stratospheretroposphere analyses of regional transport 2008 experiment, Bull. Am. Meteorol. Soc., 91, 327–342, 2010. Peevey, T., Gille, J. C., Randell, C. E., and Kunz, A.: Investigation of double tropopause spatial and temporal global variability utilizing HIRDLS temperature observations, J. Geophys. Res., doi:10.1029/2011JD016443, in press, 2011. Pittman, J. V., Pan, L. L., Wei, J. C., Irion, F. W., Liu, X., Maddy, E. S., Barnet, C. D., Chance, K., and Gao, R.: Evaluation of AIRS, IASI, and OMI ozone profile retrievals in the extratropical tropopause region using in situ aircraft measurements, J. Geophys. Res., 114, D24109, doi:10.1029/2009JD012493, 2009. Randel, W. J., Wu, F., Russell, J. M., Roche, A., and Waters, J. W.: Seasonal cycles and QBO variations in stratospheric CH4 and H2 O observed in UARS HALOE data, J. Atmos. Sci., 55(2), 163–185, 1998.
Full Screen / Esc
Printer-friendly Version Interactive Discussion
Discussion Paper | Discussion Paper |
33114
ACPD 11, 33095–33126, 2011
Commentary on using equivalent latitude L. L. Pan et al.
Title Page Abstract
Introduction
Conclusions
References
Tables
Figures
J
I
J
I
Back
Close
|
20
Discussion Paper
15
|
10
Discussion Paper
5
Randel, W. J., Seidel, D. J., and Pan, L. L.: Observational characteristics of double tropopauses, J. Geophys. Res., 112, D07309, doi:10.1029/2006JD007904, 2007. Ray, E. A., Rosenlof, K. H., Richard, E., Parrish, D., and Jakoubek, R.: Distributions of ozone in the region of the subtropical jet: An analysis of in situ aircraft measurements, J. Geophys. Res., 109, D08106, doi:10.1029/2003JD004143, 2004. Schoeberl, M. R., Lait, L. R., Newman, P. A., and Rosenfield, J. E.: The structure of the polar vortex, J. Geophys. Res., 97(D8), 7859–7882, 1992. SPARC CCMVal: Report on the Evaluation of Chemistry-Climate Models, edited by: Eyring, V., Shepherd, T. G., and Waugh, D. W., SPARC Report No. 5, WCRP-132, WMO/TD-No.1526, 2010. Strahan, S. E., Duncan, B. N., and Hoor, P.: Observationally derived transport diagnostics for the lowermost stratosphere and their application to the GMI chemistry and transport model, Atmos. Chem. Phys., 7, 2435–2445, doi:10.5194/acp-7-2435-2007, 2007. Tilmes, S., Pan, L., Hoor, P., Sachse, G. W., Loewenstein, M., Lopez, J., Webster, C., Cristensen, L. E., Proffitt, M., Gao, R.-S., Diskin, G. S., Avery, M. A., Podolske, J. R., Herman, R. L., Spelten, N., Weinheimer, A., Campus, T., Hintsa, E. J.,Weinstock, E. M., Pittman, J., Zondl, M. A., Paige, M. E., and Atlas, E.: An aircraft-based upper troposphere and lower stratosphere O3 , CO, and H2 O climatology for the Northern Hemisphere, J. Geophys. Res., 115, D14303, doi:10.1029/2009JD012731, 2010. Tomikawa, Y., Nishimura, Y., and Yamanouchi, T.: Characteristics of tropopause and tropopause inversion layer in the polar region, SOLA, 5, 141–144, doi:10.2151/sola.2009036, 2009.
Full Screen / Esc
Printer-friendly Version Interactive Discussion
Discussion Paper
ACPD 11, 33095–33126, 2011
| Discussion Paper
Commentary on using equivalent latitude L. L. Pan et al.
Title Page Introduction
Conclusions
References
Tables
Figures
J
I
J
I
Back
Close
|
Abstract
Discussion Paper |
4
potential temperature surface for the 15 February 33115 2006 00Z WACCM analysis. These
|
3
Fig. 1. In this example, contours of 30◦ and 60◦ EqLat are shown on the 380 K potential temperature surface for the 15 February 2006 00Z WACCM analysis. These two contours correspond to PV of 2 pvu and 10 pvu, respectively. For contrast, the geographical latitudes of ◦ Figure In◦ (dashed this example, contours 30° and 60° EqLat are shown on the 380 K 30 and1.60 circles) are alsoofgiven.
2
Discussion Paper
1
Full Screen / Esc
Printer-friendly Version Interactive Discussion
Discussion Paper
ACPD 11, 33095–33126, 2011
| Discussion Paper
Commentary on using equivalent latitude L. L. Pan et al.
Title Page Introduction
Conclusions
References
Tables
Figures
J
I
J
I
Back
Close
|
Abstract
Discussion Paper |
1 2 3
Full Screen / Esc
Figure 2. The relationship of PV and EqLat for three middleworld isentropes on February 15, 2006. 33116
|
4
Discussion Paper
Fig. 2. The relationship of PV and EqLat for three middleworld isentropes on 15 February 2006.
Printer-friendly Version Interactive Discussion
Discussion Paper
1
ACPD 11, 33095–33126, 2011
| Discussion Paper
Commentary on using equivalent latitude L. L. Pan et al.
Title Page Introduction
Conclusions
References
Tables
Figures
J
I
J
I
Back
Close
|
Abstract
Discussion Paper |
2
5
40 m/s wind speeds.
|
33117
Discussion Paper
Fig.3 3. Figure Distribution of EqLat (left)(left) andand COCO (right) 3. 3.Distribution ofEqLat EqLat (left) and CO 3. Distribution of EqLat (right)on onFig. Figure Distribution of −1 (right) on the 600 K isentropic surface. The white contours represent 30 and 40 m s wind 4 (left) and CO (right) on the 600 K isentropic surface. The white contours represent 30 and speeds.
Full Screen / Esc
Printer-friendly Version Interactive Discussion
Discussion Paper
ACPD 11, 33095–33126, 2011
| Discussion Paper
Commentary on using equivalent latitude L. L. Pan et al.
Title Page Introduction
Conclusions
References
Tables
Figures
J
I
J
I
Back
Close
|
Abstract
equivalent latitude (right). The black dashed lines represent the zonal means (calculated
4
in 1.9° intervals) in latitude or EqLat coordinates, respectively.
5
|
33118
Discussion Paper
3
|
Fig. 4. Scatterplots of WACCM CO at 600 K as functions of latitude (left) and equivalent latitude ◦ (right). The4.black dashed lines represent means (calculated 2 Figure Scatterplots of WACCM CO at 600 the K aszonal functions of latitude (left) and in 1.9 intervals) in latitude or EqLat coordinates, respectively.
Discussion Paper
1
Full Screen / Esc
Printer-friendly Version Interactive Discussion
Discussion Paper
ACPD 11, 33095–33126, 2011
| Discussion Paper
Commentary on using equivalent latitude L. L. Pan et al.
Title Page Introduction
Conclusions
References
Tables
Figures
J
I
J
I
Back
Close
|
Abstract
6
W Longitude. In the -coordinate the troposphere is a narrow layer, especially around the
7
subtropical jet.
33119
|
8
Discussion Paper
PV (red lines) and the thermal tropopause (black dots). The cross sections are along 120°
|
5
Discussion Paper
1 Fig. 5. An example of a latitude-height cross section in Log-pressure altitude (left) versus 2 Figure 5. An example ofcoordinates. a latitude-height cross section in Log-pressure altitude(potential (left) potential temperature (right) Color images represent static stability temperature lapse rate. Also shown are zonal wind speed (m s−1 , white lines), PV (red lines) and 3 thermal versus potential temperature (right)The coordinates. Color images represent stability In the the tropopause (black dots). cross sections are along 120◦static W longitude. θ-coordinate the troposphere is a narrow layer, especially around the subtropical jet. 4 (potential temperature lapse rate. Also shown are zonal wind speed (m/s, white lines),
Full Screen / Esc
Printer-friendly Version Interactive Discussion
Discussion Paper
ACPD 11, 33095–33126, 2011
| Discussion Paper
Commentary on using equivalent latitude L. L. Pan et al.
Title Page Introduction
Conclusions
References
Tables
Figures
J
I
J
I
Back
Close
|
Abstract
Discussion Paper
1 Fig. 2 6. As in Fig. 5 but for EqLat.
|
Figure 6. As in Figure 5 but for EqLat.
Discussion Paper
3
|
33120
Full Screen / Esc
Printer-friendly Version Interactive Discussion
Discussion Paper
ACPD 11, 33095–33126, 2011
| Discussion Paper
Commentary on using equivalent latitude L. L. Pan et al.
Title Page Introduction
Conclusions
References
Tables
Figures
J
I
J
I
Back
Close
|
Abstract
Discussion Paper | Fig.27. WACCM EqLat and O3 and on O the 380 K (left column) and 330 K (right column) θ-surfaces Figure 7. WACCM EqLat 3 on the 380 K (left column) and 330 K (right column) θfor 15 February 2006. The position of the jet is represented by white contours (wind speeds of 30 and m s−1for ). Feb 15, 2006. The position of the jet is represented by white contours (wind 3 40 surfaces 4
speeds of 30 and 40 m/s).
|
33121
Discussion Paper
1
Full Screen / Esc
Printer-friendly Version Interactive Discussion
Discussion Paper
ACPD 11, 33095–33126, 2011
| Discussion Paper
Commentary on using equivalent latitude L. L. Pan et al.
Title Page Introduction
Conclusions
References
Tables
Figures
J
I
J
I
Back
Close
|
Abstract
Discussion Paper |
1
Fig. 8. WACCM NH meridional cross sections of EqLat (top), Ozone (middle) and CO (bottom) ◦ for 15 February 2006 along 0 longitude. In each panel, selected meteorological variables are 32 (red lines), also shown, including isentropes (black dash lines), wind speed (white lines), PV and the thermal tropopause (black dots). White color-filled areas of EqLat represent negative values.
Discussion Paper
33122
|
Full Screen / Esc
Printer-friendly Version Interactive Discussion
Discussion Paper
1
ACPD 11, 33095–33126, 2011
| Discussion Paper
Commentary on using equivalent latitude L. L. Pan et al.
Title Page Introduction
Conclusions
References
Tables
Figures
J
I
J
I
Back
Close
|
Abstract
Discussion Paper | Fig. 3 9. WACCM NH ozone as a function of latitude (left) and EqLat (right) for the 330 K and 290 K potential temperature surfaces on 15 February 2006. The dashed line in each plot represents the zonal average in their respective coordinates. 4 Figure 9. WACCM NH ozone as a function of latitude (left) and EqLat (right) for the 330
6
K and 290 K potential temperature surfaces on February 15, 2006. The dashed line in
33123
|
5
Discussion Paper
2
Full Screen / Esc
Printer-friendly Version Interactive Discussion
Discussion Paper
ACPD 11, 33095–33126, 2011
| Discussion Paper
Commentary on using equivalent latitude L. L. Pan et al.
Title Page Introduction
Conclusions
References
Tables
Figures
J
I
J
I
Back
Close
|
Abstract
Discussion Paper
1
at the 380 K potential temperature surface. The 6 pvu PV contours are shown by the
5
yellow lines. The dynamical tropopause is defined as the greater 6 pvu contour.
6
|
33124
Discussion Paper
4
|
2Fig. 10. Maps of (a) EqLat and (b) ozone from the SD-WACCM run for 16 April 2008 at the 380 K potential temperature surface. The 6 pvu PV contours are shown by the yellow lines. The tropopause is EqLat defined greater pvu contour. run for April 16, 2008 3dynamical Figure 10. Maps of (a) andas (b)the ozone from 6the SD-WACCM
Full Screen / Esc
Printer-friendly Version Interactive Discussion
Discussion Paper |
1
ACPD 11, 33095–33126, 2011
Discussion Paper
Commentary on using equivalent latitude L. L. Pan et al.
Title Page Introduction
Conclusions
References
Tables
Figures
J
I
J
I
Back
Close
|
Abstract
Discussion Paper
2 Fig. 11. Ozone at 380 K and from 110◦ –150◦ W in longitude on 16 April 2008, (a) as a function of3 relative to the 380KKand dynamical tropopause pvu in Fig. 10), 16, and2008, (b) as Figurelatitude 11. Ozone at 380 from 110°-150° W in(6 longitude on April (a)aasfunction a of relative EqLat to the dynamical tropopause. The blue points highlight the parcels that are on different sidesofofrelative the tropopause using relative latitude versus relative EqLat. 4 function latitude towhen the 380 K dynamical tropopause (6 pvu in Figure 10), and 5
(b) as a function of relative EqLat to the dynamical tropopause. The blue points highlight
|
6
the parcels that are on different sides of the tropopause when using relative latitude
7
versus relative EqLat.
Discussion Paper
8
|
33125
Full Screen / Esc
Printer-friendly Version Interactive Discussion
Discussion Paper
ACPD 11, 33095–33126, 2011
| Discussion Paper
Commentary on using equivalent latitude L. L. Pan et al.
Title Page Introduction
Conclusions
References
Tables
Figures
J
I
J
I
Back
Close
|
Abstract
◦
◦
wind in m/s (white contours).
6
|
33126
Discussion Paper
5
|
Fig. 12. Sectional zonal means of ozone for 110 –150 W in (a) latitude and (b) EqLat. Yel2 Figure 12. Sectional zonal means of ozone for 110°-150° W in (a) latitude and (b) EqLat. low squares represent the dynamical tropopause at each isentrope. Black dots represent the −1 thermal tropopause. Also shown are PV intropopause pvu (red contours) and zonal wind 3 Yellow squares represent the dynamical at each isentrope. Black dotsin m s (white contours). 4 represent the thermal tropopause. Also shown are PV in pvu (red contours) and zonal
Discussion Paper
1
Full Screen / Esc
Printer-friendly Version Interactive Discussion