2012 9th International Conference on Fuzzy Systems and Knowledge Discovery (FSKD2012)
Comparative Evaluation of Multi-label Classification Methods Gulisong Nasierding
Abbas Z. Kouzani
Department of Computer Science and Technology Xinjiang Normal University
School of Engineering Deakin University Geelong, VIC 3217, Australia
No.102 Xinyi Road, Urumqi 830054, China
[email protected]
Abstract—This paper presents a comparative evaluation of popular multi-label classification methods on several multi-label problems from different domains. The methods include multilabel k-nearest neighbor, binary relevance, label power set, random k-label set ensemble learning, calibrated label ranking, hierarchy of multi-label classifiers and triple random ensemble multi-label classification algorithms. These multi-label learning algorithms are evaluated using several widely used MLC evaluation metrics. The evaluation results show that for each multi-label classification problem a particular MLC method can be recommended. The multi-label evaluation datasets used in this study are related to scene images, multimedia video frames, diagnostic medical report, email messages, emotional music data, biological genes and multi-structural proteins categorization. Keywords-multi-label data, multi-label classification, algorithm, comparative evaluation, evaluation metrics
I. INTRODUCTION Single-label classification is concerned with learning from a set of examples that are associated with a single label l from a set of disjointed labels L, |L| > 1. In multi-label classification (MLC), the examples are associated with a set of labels Y L. Multi-label classification problems can be found in various domains [1] including classifications of text document [1-5], bioinformatics data yeast [1, 6] and genbase [7], emotions related musical data [8], scene images [9, 10], textual email messages enron [3, 5,12], image and video annotation [1, 3,11-12]. A number of other approaches have been explored elsewhere for tackling the MLC problems [14-18]. These approaches can be categorized into problem transformation (PT) and algorithm adaptation (AA) methods [1]. The problem transformation methods are algorithm independent. They transform the multi-label classification task into one or more single-label classifications, regression or ranking tasks. The existing methods that fall into this category include binary relevance (BR), label powerset (LP), random klabel set ensemble learning (RAkEL) [1, 3], a triple random ensemble multi-label classification (TREMLC) [12], multi-label classification via calibrated label ranking (CLR) [4], constructing ensembles of pruned sets for MLC [5], and a hierarchy of multi-label classifiers (HOMER) [13]. Moreover, ranking based multi-label learning methods are also categorized into the PT group. Ranking by pairewise
[email protected] comparison [15] and pairwise learning of MLC with perceptrons [16] are two examples in this category. The algorithm adaptation methods extend specific learning algorithms to handle multi-label problems directly [1]. For examples, multi-label k-nearest neighbor (ML-KNN) [6] employs the maximum a posteriori principle to adapt MLC problem. Multi-instance, multi-label boosting and support vector machine (SVM) based ensemble learning framework was proposed for scene image classification, i.e. MIMLBOOST and MIMLSVM [10]. Furthermore, the SVM based Discriminative Methods was proposed for Multi-Label data classifications [17], Clare et al. [18] developed a decision tree C4.5 [19] based MLC method by using re-sampling strategies and modified entropy function. II. MLC METHODS The problem transformation based multi-label BR method learns M binary classifiers for each different label in the whole label set L. That is, BR transforms the original training data into M subsets D , j=1, 2,…, M, so that each subset contains lj
all the examples as in the original dataset. The examples in the subset are labeled positive if the label set of the original data contains the labels of the examples in the subset, and labeled as negative otherwise. When a new instance arrives for classification, BR outputs the labels that are positively predicted by the M classifiers [1]. The LP method [1, 3, 9] is a simple but effective problem transformation approach. It considers each unique set of labels that exists in a multi-label training set as one of the classes of a new single-label classification task. Thus, LP learns one single-label classifier H: X P(L), where X denotes the instance set, and P(L) denotes the power set of a label set L. Given a new instance, the single-label classifier of LP outputs the most probable class. The RAkEL) method [3] constructs an ensemble of LP classifiers. Each LP classifier is trained using a different small random subset of the set of labels. RAkEL manages to take label correlations into account. A ranking of the labels is produced by averaging the zero-one predictions of each model per considered label.
This paper is supported by Xinjiang Higher Education Scientific Research Grant: XJEDU2011I41, Xinjiang Normal University Grant: XJNUBS1104
978-1-4673-0024-7/10/$26.00 ©2012 IEEE
696
The TREMLC method builds ensemble classifiers by using randomly selected feature subsets, label subsets and instance subsets under one iteration, where the random subsets selections are without replacement. This method was proposed based on the idea of combining and extending the random subspace [22], bagging [21] and RAkEL [3]. Additionally, the parameter selection plays an important role for achieving high performance in predictions. The multi-label classification via CLR method [4] learns a mapping from instances of rankings over a finite number of predefined set of class labels. An artificial calibration label is introduced to each example in this method. Note that, multilabel ranking refines a multi-label classification by splitting a predefined label set into relevant and irrelevant labels. The HOMER uses a tree-shaped hierarchy of simple multilabel classifiers to tackle MLC problems that involve large number of labels [13]. Each classifier handles a smaller set of labels and is compared with the entire large label set L. As a result, a better balanced example distribution and divide-andconquer strategy is adopted for designing HOMER. The CLR[4] is used as multi-label base learner for the HOMER. The ML-KNN method [6] determines the label set of a new instance by employing the maximum a posteriori principle, which is based on prior and posterior probabilities among the k-nearest neighbors for the frequency of each label’s presence. III. EVALUATION METHODOLOGY The evaluation measures for multi-label classification are different from those for single-label classification. These evaluation methods can be divided into example based, labelbased, and ranking based measures [1, 6]. A.
Example-Based Evaluation Measures Example-based measures evaluate bipartitions based on the average difference of the actual and predicted sets of labels over all examples of the evaluation dataset. Hamming-loss is selected from this measurement category for our evaluation. Hamming-loss refers to an average binary classification error. Assume that the multi-label evaluation dataset D contains multi-label examples ( x i , Y i ), i=1, 2… N, Y i L is a set of true labels, L= {lj: j=1…M} is the set of all labels, and xi is a new instance. The predicted set of labels for the instance xi to be Zi and ranking based prediction for a label l is assumed to be r i (l). Hence, Hamming-loss can be calculated as: Hamming-loss =
1 N | Yi Z i | N i 1 M
(1)
where M refers to maximum number of labels, N refers to the maximum number of examples, and Z i h ( x i ) is a set of labels predicted by a multi-label classifier h for an example x i . B.
Label-Based Evaluation Measures The precision, recall and F1-measure are widely used in single-label classification evaluation, which also are applicable for multi-label classification by using two averaging methods named micro and macro [1]. The label based F1-measure refers
to the harmonic mean between precision and recall, where the recall refers to the percentage of relevant labels that are predicted, and the precision refers to the percentage of predicted labels that are relevant. Among the above, micro F1measure is used for the MLC evaluation measure. The F1measure and the micro averaging can be calculated as follows: F1-measure =
1 N
N
2 | Yi Z i | Z i | | Yi |
i 1 |
(2)
M M M M M micro M tp l , fp l , tn l , fn l l 1 l 1 l 1 l 1
(3)
where tp l , fp l .tn l , fn l denote the number of true positives, false positives, true negatives and false negatives for l labels after a binary evaluation. C. Ranking-Based Evaluation Measures Label ranking methods predict a rank for a label. The most relevant label is ranked to receive the highest score, while the most irrelevant one is ranked to receive lowest score. One-error is a popular ranking based evaluation metrics used for measuring the MLC performance. It equals to normal single-label classification error measurement. One-error evaluates how many times the top-ranked label is not in the set of proper labels of the instance [1]. One error
1 N
N
( arg min ri (l )) i 1
(4)
l L
1 if l Yi 0 otherwise Average precision evaluates the average fraction of labels ranked above a particular label l Yi , which actually is in Yi:
where (l) = {
Average precision 1 N
N
1
| Y | i 1
IV.
i
l Yi
| l ' Yi : ri ( l ' ) ri (l )} | ri ( l )
(5)
EXPERIMENTAL S ETUP
A.
Datasets In order to test the applicability of the evaluated MLC algorithms to different problems, two multi-label image datasets scene [9] and Corel16k001 [22], a multimedia video dataset mediamill, musical dataset emotions, text dataset medical, an email messages dataset enron, biological datasets yeast and genbase dataset [1, 3, 5, 6, 12] are used. The Corel16k001 is produced from the first (001) subset of the data jmlr2003, which is derived from a popular benchmark dataset eccv2002 [11, 22] by eliminating less frequently appeared keyword classes. That is, 374 keyword classes in eccv2002 were reduced to 153 in Corel16k001. This data is created based on 13766 images. 500 blob clusters are used as nominal features in this dataset.
697
The scene dataset contains 2407 images where each image is annotated with up to 6 concepts such as beach, mountain and field. Each image is described with 294 visual numeric features and these features are represented with spatial color moments in Luv color space. Prior to this stage, each image is segmented into 49 blocks using a 7 rows by 7 columns grid, thus the features of each image are 2 × 3 × 7 × 7 = 294 [9, 10]. The mediamill dataset is based on the mediamill challenge data set. It contains pre-computed low-level multimedia features from 85 hours of international broadcast news video of the TRECVID 2005/2006. This dataset contains Arabic, Chinese, and US news broadcasts that were recorded during November 2004. The contents of the news are annotated with multiple labels. The annotation of the mediamill data are extended to current 101 concepts from a manual annotation of 39 labels by the TRECVID 2005 [1, 3, 12].
distributes the labels evenly and randomly into 3 subsets, and CLR is chosen to be the multi-label base learner for HOMER. The default parameters for TREMLC are set as follow: each subset covers 70% of the original training set in the feature space and instance space, while the number of models is set to be twice the size of the label set size of a multi-label dataset, and label subset size is set to be 3 in order to comparable to RAkEL. Additionally, the minimum size of models is set to be 200 if m=2L < 200. The LP is used as multi-label base learner in TREMLC, and C4.5 is used as base classifier in LP. TABLE I. Domains image
Instances 2407
Attributes 294 num.
Labels 6
Corel16k001
image
13766
500 nom.
153
mediamill
video
43907
120 num.
101
emotions
music
593
72 num.
6
The emotions dataset can be used for evaluating the predictive power of several audio features in a new multi-label feature selection method. The emotion dataset contains a set of 593 songs with 6 clusters of music emotions, which is constructed based on the Tellegen-Watson-Clark model [1, 12]. The yeast dataset can be used for biological gene function classification evaluation. This dataset contains 2417 gene examples and each of which is related up to a set of 14 functional gene classes from the comprehensive Yeast Genome Database of the Munich Information Center for protein Sequences. Each gene is expressed with 103 numeric features [1, 6]. The genbase data is generated based on protein data, and can be used for evaluating the performance of structural protein function detection [1, 7]. The medical dataset was constructed from the available data in Computational Medicine Center’s 2007 Medical Natural Language Processing Challenge. This dataset contains 978 clinical free text reports and each diagnostic report is related to one or more disease code from the 45 classes. The Enron dataset is a subset of the Enron email Corpus which contains 1702 email messages that are associated with a set of 53 topics, such as humor, company strategy and legal advice. The Enron dataset is developed by the UC Berkeley Enron Email Analysis Project [3, 5, 12]. Table I shows general characteristics of the datasets. The number of labels and examples, the characteristics of these datasets vary. B.
Experimental Setting Several MLC algorithms are selected from the open source MULAN library, which is built on top of the open source Weka library [1], including ML-KNN, BR, LP, RAkEL, HOWER, CLR. Additionally, the TREMLC [12] is included in this comparative study of MLC methods. Furthermore, decision tree C4.5 [19] is used as a base classifier for all the transformation based MLC methods in the experimental setting for the consistency. The performances are evaluated using the 10-fold cross-validation. The parameters used for the MLC algorithms are those reported in the literature. For example, ML-kNN is run with 10 nearest neighbors and the smoothing factor of 1. RAkEL uses LP as the multi-label learner base, and set the size of label subset (k) to 3, number of models m to 2k, and threshold to 0.5, for all evaluations. HOMER
MULTI - LABEL D ATASETS
Dataset Names scene
yeast
biology
2417
103 num.
14
genbase
biology
662
1186 nom.
27
medical
text
978
1449 nom.
45
enron
text
1702
1001nom.
53
Note: “num” refers to numeric attributes; “nom” refers to nominal attributes
V. A.
EXVALUATION RESULTS AND DISCUSSIONS
Exvaluation Results
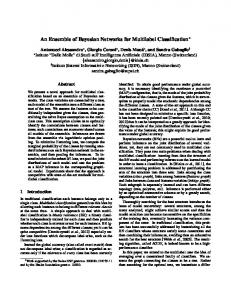
Fig. 1 shows the predictive performances of the examined MLC methods measured with the example-based Hammingloss. Since the smaller value of Hamming-loss is indicative of the better performance of the MLC method. Among the seven examined MLC algorithms, TREMLC performed relatively better on six out of eight datasets when measured with this metrics. It was ranked as the second performer on the remaining two datasets Corel16k001 and genbase. ML-KNN performed the best on Corel16k001, and BR and RAkEL performed the best on genbase by reaching the same performance level. Fig. 2 displays the performance of the examined MLC methods evaluated with micro F1-measure. TREMLC achieved better on 3 out of eight datasets including mediamill, emotions, and yeast, and it demonstrated the second high performance on scene, Corel16k001, genbase and Enron datasets, while BR shows the best on genbase and medical, and RAkEL achieved the highest performance on genbase and Enron. Interestingly, BR and RAKEL reached the same high level on genbase based on micro F1-measure. Fig. 3 shows TREMLC and CLR reached equal number of the highest scores when measured with one-error. TREMLC achieved the best performance on scene, emotions, yeast and medical, while CLR reached highest the rank of performance on the rest of datasets including Corel16k001, mediamill, genbase and Enron. Fig. 4 shows TREMLC achieved the best performance on five out of eight datasets when measured with the average precision metric. On the other hand, ML-KNN did the best on
698
mediamill, BR won the best position on Corel16k001, and CLR achieved the best on genbase. In the next level of high performance ranking under the average precision measure, TREMLC stood out when ranking on genbase and nearly achieved the top place on mediamill by just minor difference to CLR. As well as, ML-KNN achieved the second position on scene, Corel16k001, yeast and Enron, while CLR performed nicely on Corel16k001, mediamill, medical and Enron. RAkEL approached the second best level on the datasets. The evaluation times during the cross-validation of the examined MLC algorithms are given in Table II. The table indicates that ML-KNN was the most efficient algorithm among when evaluated on the selected datasets. In the next level, LP showed efficiency when tested on Corel16k001 and genbase, both of these datasets have relatively large size of nominal feature set. However, LP was inefficient on the large sized dataset mediamill, while TREMLC showed efficiency on these two larger sized datasets. However, TREMLC appeared to be time consuming when tested on relatively smaller datasets. B.
Discussions The predictive performances of the examined MLC algorithms given in Fig.1-4 showed that MLC algorithms performed differently on different dataset. Thus, a specific MLC algorithm can be tailored to different multi-label problem. The figures indicate that TREMLC performed the best on scene, emotions and yeast when measured with nearly all the selected evaluation metrics, and performed nicely on
Figure 1: Predictive Performances of Examined MLC Algorithms Measured with Hamming-loss (The smaller value of Hamming-loss, the better the performance of the MLCs).
Figure 2: Predictive Performances of Examined MLC Algorithms Measured with Micro F1measure (The greater value of micro F1-measure, the better the performance of the MLCs)
genbase, medical, and enron datasets using some of selected evaluation measures, except it did not show effectiveness on Corel16k001. Moreover, TREMLC demonstrated better adaptability to the multi-label problems derived from various domains compare to its counterparts. If one is seeking an effective MLC method for applying to various multi-label problems at hand, but the efficiency is not critical for them in the evaluation, then the TREMLC can be the right choice. ML-KNN performed well on scene and yeast, but with just behind the performance level of TREMLC. However, ML-KNN performed well on Corel16k001 and mediamill, and more importantly, it showed efficiency when measured with almost all the selected evaluation datasets thanks to its functionality. If the efficiency is more important for someone when handling MLC problem, then ML-KNN algorithm is the best choice. In the next level of performance, the power of the CLR is its effectiveness on large sized mediamill dataset with the larger number of labels. Lastly, the achievement of BR on Corel16k001 and genbase cannot be ignored, while RAkEL reached the second best performance level when measured with all the selected measures on emotions, and obtained positive results in some evaluation measures on genbase. Actually, these predictive performances of the evaluated MLC algorithms suggesting ones to select suitable method for the MLC problem at hand derived from different domains.
Figure 3: Predictive Performances of Examined MLC Algorithms Measured with One-erro (The smaller value of One-erro, the better the performance of the MLCs)
Figure 4: Predictive Performances of Examined MLC Algorithms Measured with averageprecision (The greater value of average-precision, the better the performance of the MLCs)
699
VI. CONCLUSION This paper presented a comparative evaluation of seven popular multi-label classification algorithms on eight multilabel datasets which representing multi-label categorization problems from different domains. The intensively studied MLC methods include multi-label k-nearest neighbor (ML-KNN), binary relevance (BR), label power set (LP), random k-label set ensemble learning (RAkEL), a triple random ensemble multilabel classification (TREMLC), calibrated label ranking (CLR) and hierarchy of multi-label classifiers (HOMER). The results show that TREMLC achieved relatively higher predictive performance compared to the tested counterparts when measured with four MLC evaluation metrics on eight multilabel datasets. It also showed general applicability for various multi-label data categorization problems. The ML-KNN also achieved nice predictive performance among the counterparts on relatively smaller sized datasets scene and yeast, especially it is efficient algorithm in solving various multi-label classification problem. Moreover, BR showed its effectiveness in MLC when tested on relatively smaller sized nominal data. ACKNOWLEDGMENT This paper was supported by Xinjiang Uyghur Autonomous Region Higher Education Department Scientific Research Grant (No. XJEDU2011I41), and Xinjiang Normal University Post-Doctorial Initiative Research Grant (No. XJNUBS1104), China. REFERENCES [1]
[2]
[3]
[4]
[5]
[6] [7]
G. Tsoumakas, I. Katakis, I. Vlahavas, “Mining Multi-label Data”, Data Mining and Knowledge Discovery Handbook, O. Maimon, L. Rokach (Ed.), Springer, 2nd edition, pp. 667-685, 2010. I. Katakis, G. Tsoumakas, I. Vlahavas, “Multi-label text classification for automated tag suggestion”, Proceedings of the ECML/PKDD 2008 Discovery Challenge, Antwerp, Belgium, 2008. G. Tsoumakas, I. Katakis, I. Vlahavas, “Random k-Labelsets for MultiLabel Classification”, IEEE Transactions on Knowledge and Data Engineering, IEEE, 23(7), pp. 1079-1089, 2011. J. Fu”rnkranz, E. H”ullermeier, E. L. Mencia and K. Brinker, “Multilabel classification via calibrated label ranking”, Machine Learning. vol. 73, 2008, pp. 133-153. J. Read, B. Pfahringer, G. Holmes, “Multi-label Classification Using Ensembles of Pruned Sets”, Eighth IEEE International Conference on Data Mining 2008, ICDM '08, 15-19 Dec. 2008, Page(s):995 – 1000. M. L. Zhang, Z. H. Zhou, “ML – KNN: A Lazy Learning Approach to Multi-Label Learning”, Pattern Recognition 40(7):2038–2048. 2007. S. Diplaris, G. Tsoumakas, P. A. Mitkas and I. Vlahavas, “Protein Clasification with Multiple Algorithms”, Proceedings of the 10th TABLE II. MLC Algorithms TREMLC ML-KNN BR LP
scene
Panhellenic Conference on Informatics (PCI 2005), Volos, Greece, November 2005. [8] K. Trohidis, G. Tsoumakas, G. Kalliris, I. Vlahavas. “Multilabel Classification of Music into Emotions”, Proceedings of 9th International Conference on Music Information Retrieval (ISMIR 2008), pp. 325-330, Philadelphia, PA, USA, 2008. [9] M. R. Boutell, J. Luo, X. Shen, and C. M. Brown, “Learning Multilabel scene classification”, Pattern Recognition 37 (2004), pp.1757 – 1771. [10] Z. H. Zhou, M. L. Zhang, “Multi-instance multi-label learning with application to scene classification”, Scho”lkopf. B., Platt. J. C., Hoffman. T., eds. NIPS 2006, MIT Press, pp. 1609 – 1616. [11] G. Nasierding, G. Tsoumakas and A. Z. Kouzani, “Clustering Based Multi-Label Classification for Image Annotation and Retrieval”, Proceedings of IEEE SMC 2009 International Conference, October 2009, Texas, USA, pp. 4627-4632. [12] G. Nasierding and A. Z. Kouzani, G. Tsoumakas, “A Triple-Random Ensemble Classification Method for Mining Multi-label Data”, 2010 IEEE International Conference on Data Mining Workshops, December 2010, Sydney, pp.49-56. [13] G. Tsoumakas, I. Katakis, I. Vlahavas, “Effective and Efficient Multilabel Classification in Domains with Large Number of Labels”, Proc. ECML/PKDD 2008 Workshop on Mining Multidimensional Data (MMD'08), Antwerp, Belgium, 2008. [14] T. Li, C. Zhang and S. Zhu, “Empirical Studies on Multi-label Classification”, the 18th IEEE International Conference on Tools with Artificial Intelligence, NOV. 13 – 15, 2006 (ICTAI’06), Washington D.C. (2006). [15] E. H¨ullermeier, J. F¨urnkranz, W. Cheng, K. Brinker, “Label ranking by learning pairwise Preferences”, Artificial Intelligence vol. 172, 2008, pp. 1897–1916. [16] Men08] E. Loza Mencia, J. F¨urnkranz, “Pairwise learning of multilabel classifications with perceptrons”, 2008 IEEE International Joint Conference on Neural Networks (IJCNN-08), Hong Kong (2008) 2900–2907. [17] S. Godbole and S. Sarawagi, “Discriminative Methods for MultiLabelled Classification”, proceedings of the 8th Pacific-Asia Conference on Knowledge Discovery and Data Mining (PAKDD 2004), pp. 22-30. [18] A. Clare and R. D. King, “Knowledge Discovery in Multi-label Phenotype Data”, Proceeedings of the 5th European Conference on Principles of Data Mining and Knowledge Discovery (PKDD) 2001, Freiburg, Germany, pp. 42-53. [19] J. R. Quinlan, “C4.5: Programs for Machine Learning”, San Mateo, CA; Morgan Kaufmann, 1993. [20] T. K. Ho, “The Random Subspace Method for Constructing Decision Forests”, IEEE Transactions on Pattern Analysis and Machine Intelligence 20(8), 1998, pp.832-844. [21] L. Breiman, (1996a), “Bagging Predictors”, Machine Learning, Vol. 24, No. 2, pp. 123-140. [22] K. Barnard, P. Duygulu et al, “Matching Words and Pictures”, Journal of Machine Learning Research, p1107-1135, no. 3, 2003.
E VALUATION T IMES OF THE EXAMINED MLC
Corel16k001
mediamill
emotions
yeast
genbase
medical
172.8003
1231.66
2020.85
8.769833
117.0322
5.196167
51.2055
357.275
2.757667
223.8587
181.238
0.049833
1.2015
1.568333
0.1185
1.180833
3.281833
486.023
727.2203
0.153833
3.330667
0.269167
3.496833
49.22017
2.487
58.90133
3207.094
0.140167
5.336
0.090833
0.7685
3.7425
RAKEL
16.16567
2371.159
3081.987
0.770333
26.50683
1.418833
21.08367
280.7615
CLR
5.075333
1576.314
2577.75
0.285
9.6385
0.620833
6.285
106.0373
HOMER
4.356
1088.286
533.3867
0.225667
4.744833
0.486833
3.688833
32.22417
700
Enron