ed in the mid-1950s by the U.S. Army Map Service [23]. A similar venture ..... Simmons [31] of the ...... Saidna military airport- both more than 2 km long, showed ...
ITC Journal 1994-2
Comparative testing of space images for small -scale topographic mapping of Sudan Gordon Petrie 1 and Abdelazim E H EI Niweiri 2
ABSTRACT
from most of these disadvantages and problems. It has huge areas of desert and semi desert in the north a nd cen tral parts of the country and dense tropical rainforest in the south. It also has some high, rugged mountain areas of considerable extent, such as the Red Sea Hill s, the Imatong mountains lying along the Ugandan border, the Jebel Mara massif in the far west of the country and the mountain and plateau areas running along the border with Ethiopia. Settlement away from the White and Blue Nile rivers is sparse and very widely distributed, while distances between settlements are often huge and transport and communication networks are poorly devel oped. Indeed many areas are not readily accessible. The Sudan Survey Department (SSD) was set up in 1899, soon after the establishment of the Anglo Egyptian government of Sudan, and was charged initial ly with two main tasks. One wa s the compilation and production of a 1:250,000 scale series covering the whole of this vast country to satisfy the urgent demands of administrative and military activities. It is almost unbelievable that by 1908 this series, comprising 172 sheets, had been produced and published for the whole country. The data had been gathered via the medium of route surveys, however, so th at the maps (which were purely planimetric) showed very little detail away from the routes between settlements . Since the maps had to be produced quickly, little attention was paid to control networks . The maps contained no contours; instead the topography was shown mainly by rough form lines [11]. The second main task of the SSD was to carry out demarcation and boundary survey s and to prepare the associated large-scale property maps for the cultivated areas lying along the Nile, required for both taxation and land registration purposes. Between the two world wars, further mapping of limited areas was carried out for spe cific development projects, such as the large Gezira, Gash and Toker irrigation schemes. During the second world war, Trimetrogon photographs of the whole coun try north of 8°N latitude (amounting to 80 percent of Sudan's land area) were taken by the U.S . Air Force. Some of these photographs were used by SSD to com pile 1: 100,000 scale planimetric maps of 208,000 km 2 in the Sudd area of the upper Nile, while a further 52,000 km 2 of the Kosti area were mapped by the USGS [36, 37]. Much effort also went into the establishment of con trol networks by both the SSD and foreign survey and mapping agencies via aid programmes. These included the Sudanese section of the arc of the 30th meridian which runs from the Cape of Good Hope in South Africa to the Mediterranean coast of Egypt. This was started in 1935, interrupted by the second world war, and complet
Spaceborne and airborne remote sen s ing system s are making a consid e r able contribution to th e topographic mapping of rem ot e and inaccessible areas. However, not all sy stems are egua1ly use ful for mapping specific features. A comparative a naly sis was conducted of Land sat MSS, TM a nd RBV data, in addition to MOMS, in two areas of Sudan to test their utility in topographic mapping in terms of both geometric accuracy and the natural and man-made objec ts that could be detected or identified o n these image s. Appropriate Spot data of Sudan were not available at the time, but collateral information was obtained from tests of Spot ima ge s of Yemen an d Djibouti. Further tests were carried out with large-format camera and metric camera products to evaluate their interpretability . In general, th e physical characteristics of the territory to be mapped and specific financial and technical con straints will probably determine which source s of topographic data are most ap propriate for a ny given country, but it is unlikely that many developing co untries will be able to fuJIy utilize this techno logy without the assista nce of spec ialized donor agencie s.
Given ITC's well-known mi ss ion to assist countries 10 the developing world through the provision of training, research and consulting with a view to generating maps and other geo-referenced data to assist economic devel opment, manage national resources, conserve the envi ronment and improve the well-being of large numbers of human beings, there is no need to labour the point that in most of these countries there is a very serious defi ciency in their topographic map coverage at almost all scales. Even where there is substantial coverage, it is often of poor quality or considerably out-of-date. Despite great efforts, the situation seems to change only slowly and not always for the better becau se of political conflicts, civil wars, economic mismanagement and nat ural dis as ters. The lack of funds to buy and maintain modern photogrammetric equipment and the very limited number of skilled personnel who can use and manage this equipment are other commonly encountered disad vantages. In many African countries, a certain amount of topo graphic mapping to a good standard has been undertak en based on photogrammetric methods, but the coverage is both limited and patchy, often being associated with specific development projects. Not only is systematic topographic map coverage often limited, but, in rece nt years, its availability has often been severely restricted because of internal and external conflicts and the restric tion s arising from the military and security operations associated with these conflicts. Sudan is the largest country in Africa and suffers I Department of geography and topo grap hi c sc ience, Univers ity of Glasgow, Glasgow GI2 8QQ, United Kingdom
Sudan Res ou rce s Assessment and Deve lopment Project (SRAAD), Forests National Commission. PO Box 658, Kharto um, Sudan 2
95
Space images for mapping
lTe Journal 1994-2
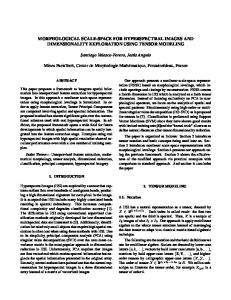
ed in the mid-1950s by the U.S. Army Map Service [23]. A similar venture of geodetic importance was the arc of the 12th parallel, the Sudanese part of which was again carried out by U .S. agencies assisted by the SSD [40]. Further secondary chains were established mainly in the northeastern, eastern and central parts of the country in the 1950s and 1960s (see Figure I). In particular, American aid during the period from 1961 to 1967 resulted in first- and second-order chains being provided in the Red Sea Hills and in central and western Sudan. M ore recently, further den sification of the control net work was carried out by the British Directorate of O verseas Survey and Directorate of Military Survey using satellite Doppler methods.
20°1
1So1
I
1
Il:::::::esdkb;;;;:h .'
:I
.r.
"
the early Anglo-Egyptian period was revised. Although this took advantage of the es tablished control network s and the data acquired from wartime mapping and devel opment projects, it was not a new series. In many of the more remote parts of the country, the revision was quite minimal and in large part consisted of adding changes to administrative boundaries and the positions and names of new settlements. Since the I :250,000 scale series was too small in scale to give the detail required for development projects, it was decided that a new 1: 100,000 scale series with con tours should also be produced. Indeed this was the main objective of the UNDP-supported programme. Since 920 sheets would be required to cover the country at that scale, it was apparent that those areas which were most important from the development point of view would be tackled first. In fact, despite all the considerable invest ment and a substantial effort on the part of the UNDP and SSD personnel, only a very limited map coverage at I: 100,000 scale resulted from this project. Only a few sheets were published for the area around Khartoum and the Sinkat-Haiya area in the Red Sea H ills. In fact, quite a lot of resources and effort were diverted into the production of a 1:25,000 scale series of the area around Khartoum for military and security reasons. In addition to the U NDP-supported mapping project, a joint survey and mapping programme was agreed with the British D irectorate of Overseas Surveys (DOS) in 1974. As a result, during the late 1970s and early 1980s, DOS , in collaboration with the S SD , undertook the production of a large block of more than 50 sheets at 1: 100,000 scale covering much of the Red Sea Hills and the area running southwards to the Ethiopian border, including the areas around Port Sudan, Suakin and Kassala (see Figure 2). Based on the existing survey networks in the area, further control points for mapping were estabJ ished under this joint programme using Tellurometer traverses. Based on these new ground con trol points, aerial triangulation was carried out, followed by photogrammetric plotting and the cartographic opera tions needed to produce the final printed maps . In
1
~
100r---r--r---------t-~==::~~------I .
I I
I
'-"
I
/'
\
\
\
sON I
ETHIOPIA
~',- ... ,
L~
'-\ ' . . . ,---'r- _,
J ~--
400 km
J 2~E
3~
3~
40 0
FIGURE 1 Extent of control networks in Sudan
After independence in 1956, little new topographic mapping was carried out for some years, but by the late 1960s it had become apparent to the Sudanese govern ment that there was an urgent need for a new map series covering the whole country to provide information need ed for feasibility studies and for the planning and imple mentation of the projects to be undertaken under its series of five-year plans. In 1970, an agreement was signed between the Sudanese government and the UN Development Programme (U NDP), by which the UNDP would directly assist in the establishment of the improved infrastructure needed to extend the country's field control networks, and to cany out the photogram metric and cartographic operations required for the com pilation and publication of the new map series. As a result, a small team of foreign experts was established in Khartoum, and the SSD was equipped with Wild A 7 and AlO Autographs for aerial triangulation and Wild A8 Autographs and B8 Aviographs for stereo-plotting work. A Twin Otter aircraft equipped with Wild RC8 and RC lO cameras for aerial photography and with Decca Doppler radar for navigation was also acquired, and comprehensive cartographic, reprographic and printing facilities were installed in the SSD headquarters in Khartoum. A large number of personnel were sent abroad for training, quite a number of them to lTe. D uring the period 1970-1976, the 1 :250,000 series of
SUDAN
,, \
~ --
25 0 E
30 0
350
40 0
FIGU RE 2 Map coverage at 1:100,000 scale resulting from joint DOS/SOD mapping project
96
Space images for mapping
ITC Journal 1994-2
recent years , this cooperative mapping programme has been extended still farther to cover the area along the Ethiopian border west of K assala, including the areas around Wad Medani and Damaz in along the Blue Nile. Additional control point s for this area were established using satellite Doppler translocation techniques. The joint mapping programme has now been completed , hav ing produced 136 sheets at 1: 100,000 scale. Even with thi s enormous advance in coverage, however, there is still a very lon g way to go before the total of 920 sheets required to cover the whole country at this scale is reached. The difficulties encountered by the SSD in the 1970s and 1980s have included the lac k of forei gn currency to purchase materials, spare parts, instrument servicing, etc, and a shortage of skilled , trained personnel, many of whom have gone to work in neighbouring oil-producing states. These difficulties have arisen principally from the country's poor economic situation, compounded by the long period s of civil war in the south of the country. These have resulted in severe budgetary restriction s, with the curtailment of SSD's field survey control oper ations , limitations in flying time, the lack of materials of all types, etc. With this background in mind, it is obvious that Sudan is an example of a developing country whose large area and poor economic circumstances pose severe problems for the production of topographic map s using conventional aerial photogrammetri c methods. In this situation, almost ine vita bly, some attention has to be fo cused on the possibilities offered by space images. Since Sudan has a hu ge land area , much of which is flat or has a limited range of relief and contains little cultur al detail, small-scale line maps or the photo- or image based maps as advocated by Jerie [18] 2S years ago might well be quite appropriate and acce ptable product s. Furthermore, since much of Sudan comprises des e rt and semiarid land, the weather is often cloud-free so that the problem s of acquiring images from space are far less likely to occur than in the cloudy areas of the tropic s or those areas such as the UK with a temperate maritime climate. S ince the desired scale of mapping is I: 100,000, it would be pos sible to produce se veral image maps, photo maps or line maps from a single space image or stereo model. This would res ult in a drastic reduction in the photogrammetric operations that would be necessary, which is operationally a major advantage. Al so, it would lead to a reduction in the provision of control needed for the mapping, which is a major consideration in the context of the large areas with very poor accessi bility. On the other hand, based on experience else where, it is almost certain that a considerable deficiency would result in the cultural detail (roads, tracks, settle ments, etc) which can be extracted from satellite images, especially given the poor contrast that s uch feature s often exhibit in arid and semiarid areas [20]. On bal ance, however, it seemed timely and appropriate to in ves tigate the capabilities of as many space imaging systems as possible in the context of producing 1: 100,000 scale topographic maps of Sud an [8]. It may occur to readers that, since much testing of space images for small-scale topographic mapping has been undertaken el sewhere, an assessment of their po ss i ble application in Sudan could be made on the basi s of
these tests . In fact, most of these prior tests were inevitably carried out over landscapes in highly devel oped countries with quite different environmental condi tions (climate, vegetation , landforms, etc); large expan s es of highly-developed land with many well defined man-made (cultural ) feature s; extensive and accurate survey networks and existi ng large- or medium-scale topographic maps to provide accurate control and test data, etc-none of whi ch a pplies to Sudan. So there was a clear need for a comprehen sive series of tests to be carried out. Furthermore, the re sults of such tes ts would be far more likely to gain credibility with Sudanese users and decision makers tha n the results of tests car ried out el sew here. Indeed , the res ults of the present project show quite significant departures from those car ried out over parts of western Europe and North America. A further important point is that whenever a new type of space image has become available, the s ub sequent tests have almost invariably been carried out over different test areas-resulting in difficulties in rec onciling re sults and experience. We resolved to address this particular point when carrying out tests over Sudan in order to give a more coherent set of res ults.
TEST AREAS AND MATERIALS As a first step, it was necessary to find s uitable images and to match them to suitable test areas. The matter of images was not so difficult since luckily Sudan has large areas of desert and semiarid land which are usually cloud-free or nearly so, while at the same time these areas fall within the orbits of those sate llites (prin cipally the manned space missions) launched into a low orbital inclination relative to the equator. Thus it was pos sible to find specific areas that had been covered by several different types of image. The matter of finding suitable test areas was more difficult and, in the end, two main sites were selected. The main criterion for their selection was that, at the time the tes t began , they were the only areas in the country covered by the mod ern series of 1: 100,000 scale topographic maps. The fir st area (A in Figure 3), the R ed Sea Hills, is predominantly hilly or mountainous and quite rugged, with few settlements. The topogra phy takes the form of steep hill s, ridges, valleys and ba si ns with hardly any permanent water courses but with numerou s stee p- sid ed wadis (dry valleys). The main area of hills is fringed to the eas t by a low-lyin g coastal plain along and parallel to the Red Sea coast, with the two towns of Port Sudan and Suakin located on the coast itself. A single-track railw ay line cros ses the test area, running from the inte rior down to Port Sudan, while a two-lane hard-surfaced road runs from Port Sudan southwards to K assala before turning north to W ad Medani and then on to Khartoum. There are a few other unsurfaced roads and tracks betwee n the few scattered settlements. It is a dry, semi arid area with little population or econom ic activity and a corresponding lack of cultural detail. In contrast, the Nile test area (B) included the three large cities- Khartoum , Khartoum North and Omdurman-si tuated at the con fluence of the White and Blu e Niles, together with the densely populated rural areas of the Gezira irrigation scheme a nd the narrow fer tile strips on either side of the Nile itself. Away from these areas , there are some scattered villages. The 97
Space images for mapping
ITC Journal 1994-2
whole area is very flat, with only a few isolated hill s. A great variety of well-defined cultural detail is present in the area, including that associated with a large, densely populated urban conurbation, some very large cultivated tracts, a few planted forests and a great variety of com munication features (roads, railways , tracks, bridges, ferry terminals, etc).
of the contours where a 20 m interval was used was esti mated to be me = ± 4.25 m. For the purpo se of accuracy testing, a large number of well defined points were identified on the relevant topo graphic map sheets, and their UTM coordinates were carefully scaled off relative to the map grid using an accurate engineering scale equipped with a magnifying glass, allowing measurements to be made to 0.1 mm. The corresponding image points were then measured monocularly (for the scanner and RBV images) or stereoscopically (for the photographic images) on a Zeiss lena Stecometer cn stereocomparator equipped with a Cromenco microcomputer which was used as a recording uni t. In all cases, stable hard-copy film trans parencies were used as the media on which the measure ments were made.
EGYPT
200 1
I~ ~