how urgent it is from a business perspective that the bug gets fixed. A malfunctioning ... 1A software project like Eclipse received over 2.764 bug reports over a period of 3 months (between ...... in Artificial Intelligence, ser. Lecture Notes in ...
Comparing Mining Algorithms for Predicting the Severity of a Reported Bug Ahmed Lamkanfi∗ , Serge Demeyer∗ , Quinten David Soetens∗ , Tim Verdonck‡ ∗ LORE - Lab On Reengineering — University of Antwerp, Belgium ‡ Department of Mathematics - Katholieke Universiteit Leuven, Belgium
Abstract—A critical item of a bug report is the so-called “severity”, i.e. the impact the bug has on the successful execution of the software system. Consequently, tool support for the person reporting the bug in the form of a recommender or verification system is desirable. In previous work we made a first step towards such a tool: we demonstrated that text mining can predict the severity of a given bug report with a reasonable accuracy given a training set of sufficient size. In this paper we report on a follow-up study where we compare four well-known text mining algorithms (namely, Na¨ıve Bayes, Na¨ıve Bayes Multinomial, K-Nearest Neighbor and Support Vector Machines) with respect to accuracy and training set size. We discovered that for the cases under investigation (two open source systems: Eclipse and GNOME) Na¨ıve Bayes Multinomial performs superior compared to the other proposed algorithms.
I. I NTRODUCTION During bug triaging, a software development team must decide how soon bugs needs to be fixed, using categories like (P1) as soon as possible; (P2) before the next product release; (P3) may be postponed; (P4) bugs never to be fixed. This so-called priority assigned to a reported bug represents how urgent it is from a business perspective that the bug gets fixed. A malfunctioning feature used by many users for instance might be more urgent to fix than a system crash on an obscure platform only used by a tiny fraction of the user base. In addition to the priority, a software development team also keeps track of the so-called severity: the impact the bug has on the successful execution of the software system. While the priority of a bug is a relative assessment depending on the other reported bugs and the time until the next release, severity is an absolute classification. Ideally, different persons reporting the same bug should assign it the same severity. Consequently, software projects typically have clear guidelines on how to assign a severity to a bug. High severity typically represent fatal errors and crashes whereas low severity mostly represent cosmetic issues. Depending on the project, several intermediate categories exist as well. Despite their differing objectives, the severity is a critical factor in deciding the priority of a bug. And because the number of reported bugs is usually quite high1 , tool support to aid a development team in verifying the severity of a bug is desirable. Since bug reports typically come with textual 1 A software project like Eclipse received over 2.764 bug reports over a period of 3 months (between 01/10/2009-01/01/2010); GNOME received 3.263 reports over the same period.
descriptions, text mining algorithms are likely candidates for providing such support. Text mining techniques have been previously applied on these descriptions of bug reports to automate the bug triaging process [1, 2, 3] and to detect duplicate bug reports [4, 5]. Our hypothesis is that frequently used terms to describe bugs like “crash” or “failure” serve as good indicators for the severity of a bug. Using a text mining approach, we envision a tool that — after a certain “training period” — provides a second opinion to be used by the development team for verification purposes. In previous work, we demonstrated that given sufficient bug reports to train a classifier, we are able to predict the severity of unseen bug reports with a reasonable accuracy [6]. In this paper, we go one step further by investigating three additional research questions. 1) RQ1: What classification algorithm should we use when predicting bug report severity? We aim to compare the accuracy of the predictions made by the different algorithms. Here, the algorithm with the best prediction capabilities is best fit. We also compare the time needed to make the predictions, although in this stage this is less important as the tools we used were not tuned for optimal performance. 2) RQ2: How many bug reports are necessary when training a classifier in order to have reliable predictions? Before a classifier can make predictions, it is necessary to sufficiently train a classifier so that it learns the underlying properties of bug reports. 3) RQ3: What can we deduce from the resulting classification algorithms? Once the different classification algorithms have been trained on the given data sets, we inspect the resulting parameters to see whether there are some generic properties that hold for different algorithms. The paper itself is structured as follows. First, Section II provides the necessary background on the bug triaging process and an introduction to text mining. The experimentalsetup of our study is then proposed in Section III followed by the evaluation method in Section IV. Subsequently, we evaluate the experimental-setup in Section V. After that, Section VI lists those issues that may pose a risk to the validity of our results, followed by Section VII discussing the related work of other researchers. Finally, Section VIII summarizes the results and points out future work.
II. BACKGROUND In this section, we provide an insight of how bugs are reported and managed within a software project. Then, we provide an introduction of data mining in general and how we can use text mining in the context of bug reports. A. Bug reporting and triaging A software bug is what software engineers commonly use to describe the occurrence of a fault in a software system. A fault is then defined as a mistake which causes the software to behave differently from its specifications [7]. Nowadays, users of software systems are encouraged to report the bugs they encounter, using bug tracking systems such as Jira [www.atlassian.com/software/jira] or Bugzilla [www. bugzilla.org]. Subsequently, the development is able to make an effort to resolve these issues in future releases of their applications. Bug reports exchange information between the users of a software project experiencing bugs and the developers correcting these faults. Such a report includes a one-line summary of the observed malfunction and a longer more profound description, which may for instance include a stack trace. Typically the reporter also adds information about the particular product and component of the faulty software system: e.g., in the GNOME project, “Mailer” and “Calendar” are components of the product “Evolution” which is an application integrating mail, address-book and calendaring functionality to the users of GNOME. Researchers examined bug reports closely looking for the typical characteristics of “good” reports, i.e., the ones providing sufficient information for the developers to be considered useful. This would in turn lead to an earlier fix of the reported bugs [8]. In this study, they concluded that developers consider information like “stack traces” and “steps to reproduce” most useful. Since this is fairly technical information to provide, there is unfortunately little knowledge on whether users submitting bug reports are capable to do so. Nevertheless, we can make some educated assumptions. Users of technical software such as Eclipse and GNOME typically have more knowledge about software development, hence they are more likely to provide the necessary technical detail. Also, a user base which is heavily attached to the software system is more likely to help the developers by writing detailed bug reports. B. Data mining and classification Developers are overwhelmed with bug reports. Tool support to aid the development team with verifying the severity of a bug is desired. Data mining refers to extracting or “mining” knowledge from large amounts of data [9]. Through an analysis of a large amount of data — which can be both automatic or semi-automatic — data mining intends to assist humans in their decisions when solving a particular question. In this study, we use data mining techniques to assist both
users and developers in respectively assigning and assessing the severity of reported bugs. Document classification is widely studied in the data mining field. Classification or categorization is the process of automatically assigning a predefined category to a previously unseen document according to its topic [10]. For example, the popular news site Google News [news.google.com] uses a classification based approach to order online news reports according to topics like entertainment, sports and others. Formally, a classifier is a function f : Document 7→ {c1 , ..., cq } mapping a document (e.g., a bug report) to a certain category in {c1 , ..., cq } (e.g., {non–severe, severe}). Many classification algorithms are studied in the data mining field, each of which behaves differently in the same situation according to their specific characteristics. In this study, we compare four well-known classification algorithms (namely, Na¨ıve Bayes, Na¨ıve Bayes Multinomial, K-Nearest Neighbor, Support Vector Machines) on our problem to find out which particular algorithm is best suited for classifying bug reports in either a severe or a non-severe category. C. Preprocessing of bug reports Since each term occurring in the documents is considered a additional dimension, textual data can be of a very high dimensionality. Introducing preprocessing steps partly overcomes this problem by reducing the number of considered terms. An example of the effects of these preprocessing steps as shown in Table I. Table I E FFECTS OF THE PREPROCESSING STEPS Original description After stop-words removal After stemming
Evolution crashes trying to open calendar Evolution crashes open calendar evolut crash open calendar
The typical preprocessing steps are the following: • Tokenization: The process of tokenization consists of dividing a large textual string into a set of tokens where a single token corresponds to a single term. This step also includes filtering out all meaningless symbols like punctuations and commas, because these symbols do not contribute to the classification task. Also, all capitalized characters are replaced by their lower-cased ones. • Stop-words removal: Human languages commonly make use of constructive terms like conjunctions, adverbs, prepositions and other language structures to build up sentences. Terms like “the”, “in” and “that” also known as stop-words do not carry much specific information in the context of a bug report. Moreover, these terms appear frequently in the descriptions of
•
the bug reports and thus increase the dimensionality of the data which in turn could decrease the accuracy of classification algorithms. This is sometimes also referred as the curse of dimensionality. Therefore, all stop-words are removed from the set of tokens based on a list of known stop-words. Stemming: The stemming step aims at reducing each term appearing in the descriptions into its basic form. Each single term can be expressed in different forms but still carry the same specific information. For example, the terms “computerized”, “computerize” and “computation” all share the same morphological base: “computer”. A stemming algorithm like the porter stemmer [11] transforms each term to its basic form. III. E XPERIMENTAL SETUP
In this section, we first provide a step-by-step in depth clarification of the setup necessary to investigate the research questions. Then, we present the classification algorithms we will be using throughout this study. Since each of these algorithms requires different information to work on, we also discuss the various document indexing mechanisms necessary for each algorithm. Afterwards, we propose and motivate the cases we selected for the purpose of this study. A. General approach In this study, we rely on the assumption that reporters use potentially significant terms in their descriptions of bugs distinguishing non-severe from severe bugs. For example, when a reporter explicitly states that the application crashes all the time or that there is a typo in the application, then we assume that we are dealing with respectively a severe and a non-severe bug. The bug reports we studied originated from Bugzilla bug tracking systems where the severity varies between trivial, minor, normal, major, critical and blocker. There exist clear guidelines on how to assign the severity of a bug. Bugzilla also allows users to request features using the reporting mechanism in the form of a report with “severity” enhancement which are requests for new features. These reports are not considered in this study since they technically do not represent real bug reports. In our approach, we treat the severities trivial and minor as non-severe, while reports with severity major, critical, blocker are considered severe bugs. Herraiz et al. proposed a similar grouping of severities [12]. In our case, the normal severity is deliberately not taken into account. First of all because they represent the grey zone, hence might “confuse” the classifier. But more importantly, because in the cases we investigated this normal severity was the default option for selecting the severity when reporting a bug and we suspected that many reporters just did not bother to consciously asses the bug severity. Manual sampling of bug reports confirmed this suspicion.
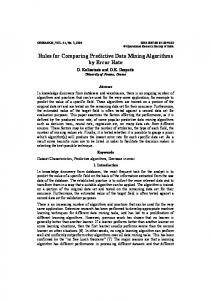
Figure 1.
Various steps of our approach
Bug Database New report --------------(1) & (2) Extract and preprocess bug reports
----------------------------------------------------------------------------------------------------
(3) Training
(4) Predict the severity
predict
prediction
NonSevere
Severe
Of course, a prediction must be based on problem-domain specific assumptions. In this case, the predicted severity of a new report is based on properties observed in previous ones. Therefore, we use a classifier which learns the specific properties of bug reports from a history of reports where the severity of each report is known in advance. The classifier can then be deployed to predict the severity of a previously unseen bug report. The provided history of bug reports is also known as the training set. A separate evaluation set of reports is used to evaluate the accuracy of the classifier. In Figure 1, we see the various steps in our approach. Each of these steps are further discussed in what follows. (1) Extract and organize bug reports: The terms used to describe bugs are most likely to be specific for the part of the system they are reporting about. Bug reports are typically organized according to the affected component and the corresponding product. In our previous work, we showed that classifiers trained with bug reports of one single component have generally more accurate predictions compared to ones without this distinction [6]. Therefore, the first step of our approach selects bug reports of a certain component from the collection of all available bug reports. From these bug reports, we extract the severity and the short description of the problem. (2) Preprocessing the bug reports: To assure the optimal accuracy of the text mining algorithm, we apply the standard preprocessing steps for textual data (tokenization, stop-words removal and stemming) on the short descriptions. (3) Training of the predictor: As is common in a classification experiment, we train our classifier using a set of bug reports, of which the severity is known in advance (a training set). It is in this particular step that our classifier learns the specific properties of the bug reports. (4) Predicting the severity: The classifier calculates estimates of the probability that a bug belongs to a certain class. Using these estimates, it then selects the class with the highest probability as its prediction. In this study, we performed our experiments using the
popular WEKA [http://www.cs.waikato.ac.nz/ml/weka/] tool which is an open-source tool implementing many mining algorithms. B. Classifiers In the data mining community, a variety of classification algorithms have been proposed. In this study, we apply a series of these algorithms on our problem with the intention of finding out which one is best suited for classifying bug reports in either a severe or a non-severe category. Next, we briefly discuss the underlying principles of each algorithm we use throughout this study. (1) Na¨ıve Bayes: The Na¨ıve Bayes classifier found its way into many applications nowadays due to its simple principle but yet powerful accuracy [13]. Bayesian classifiers are based on a statistical principle. Here, the presence or absence of a word in a textual document determines the outcome of the prediction. In other words, each processed term is assigned a probability that it belongs to a certain category. This probability is calculated from the occurrences of the term in the training documents where the categories are already known. When all these probabilities are calculated, a new document can be classified according to the sum of the probabilities for each category of each term occurring within the document. However, this classifier does not take the number of occurrences into account, which is a potentially useful additional source of information. They are called “na¨ıve” because the algorithm assumes that all terms occur independent from each other which is often obviously false [10]. (2) Na¨ıve Bayes Multinomial: This classifier is similar to the previous one. But now, the category is not solely determined from the presence or absence of a term, but also on the number of occurrences of the terms. In general, this classifier performs better than the original one, especially when the total number of distinct terms is large. (3) 1-Nearest Neighbor: A K-Nearest Neighbor compares a new document to all other documents in the training set. The outcome of the prediction is then based on the prominent category within the K most similar documents from the training set (the so-called neighbors). However, the question remains: how do we compare documents and rate their similarities? Suppose, the total number of distinct terms occurring in all documents is n. Then, each document can be represented as a vector of n terms. Mathematically, each document is represented as a single vector in a n dimensional space. In this space, we are able to calculate a distance measure (e.g., the Euclidian distance) between two vectors. This distance is then subsequently regarded as a similarity measure between two documents. In this study, we use a 1-Nearest Neighbor classifier where a newly reported bug is categorized according to the severity of the most similar report from the training set.
(4) Support Vector Machines: This classifier represents the document in a higher dimensionality space, similar to the K-Nearest Neighbor classifier. Within this space, the algorithm tries to separate the documents according to their category. In other words, the algorithm searches for hyperplanes between the document vectors separating the different categories in an optimally way. Based on the subspaces separated through the hyperplanes, a new bug report is assigned a severity according to the subspace it belongs to. Both theoretical and empirical evidence show that Support Vector Machines are very well suited for text categorization [14]. Many variations exist when using Support Vector Machines. In this study, we use a Radial Basis Function (RBF) based kernel with parameters cost and gamma respectively 100.0 and 0.001. C. Document representation As mentioned previously, each text document is represented using a vector of n terms. This means that when we have for example m documents in our collection, we actually have m vectors of length n. In other words, a m × n matrix representing all documents. This is also known as the VectorSpace model. Now, the value of each term in a document vector remains to be determined. This can be done in several ways, as we demonstrate below: (1) Binary representation: In this representation, the value of a term within a document varies between {0,1}. The value 0 simply denotes the fact that a particular term is absent in the current document while the value 1 denotes its presence. This representation especially fits the Na¨ıve Bayes classifier since it only depends on the absence or presence of a term. (2) Term Count representation: Similarly to the binary representation, but now we count the number of occurrences as a value for a term within the document. We use this representation in the combination of the Na¨ıve Bayes Multinomial classifier. (3) Term Frequency - Inverse Document Frequency representation: The Term Frequency denotes the number of occurrences which we also normalize to prevent a bias towards longer documents. Suppose we have a set of documents D = {d1 , ..., dm } where document dj is a set of terms dj = {t1 , ..., tk }. We can then define the Term Frequency for term ti in document dj as follows: ni,j tfi,j = P k nk,j where ni,j refers to thePnumber of occurrences of the term ti in document dj and k nk,j denotes the total number of terms in that particular document. Besides the Term Frequency, we also have the Inverse Document Frequency that represents the “scaling” factor, or the importance, of a particular term. If a term appears in many documents, its importance will subsequently decrease.
Table II BASIC NUMBERS ABOUT THE SELECTED COMPONENTS FOR RESPECTIVELY E CLIPSE AND GNOME
The Inverse Document Frequency for term ti is defined as follows: |D| idfi = log |{d ∈ D : ti ∈ d}|
Product
Name
Non-severe bugs
Severe bugs
where |D| refers to the total number of documents and |{d ∈ D : ti ∈ d}| denotes the number of documents containing term ti . The so called tf -idf value for each term ti in document dj is now calculated as follows:
Eclipse Eclipse JDT Eclipse CDT GEF
SWT User Interface User Interface Debug Debug Draw2D
696 1485 1470 327 60 36
3218 3351 1554 485 205 83
tf -idfi,j = tfi,j × idfi
Evolution Evolution GNOME Metacity GStreamer Nautilus
Mailer Calendar Panel General Core CD-Burner
2537 619 332 331 93 73
7291 2661 1297 293 352 355
We use this representation in combination with the 1-Nearest Neighbor and Support Vector Machines classifiers. D. Case selection Throughout this study, we will be using bug reports from two major open-source projects to evaluate our experiment: Eclipse and GNOME. Both projects use Bugzilla as their bug tracking system. Eclipse: [http://bugs.eclipse.org/bugs] Eclipse is an open-source integrated development environment widely used in both open-source and industrial settings. The bug database contains over 200.000 bug reports submitted in the period of 2001-2010. Eclipse is a technical application used by developers themselves, so we expect the bug reports to be quite detailed and “good” (as defined by Bettenburg et al. [8]). GNOME: [http://bugzilla.gnome.org] GNOME is an open-source desktop-environment developed for Unix-based operating systems. In this case we have over 450.000 reported bugs available submitted in the period of 19982009. GNOME was selected primarily because it was part of the MSR 2010 mining challenge [http://msr.uwaterloo. ca/msr2010/challenge/]. As such the community agreed that this is a worthwhile case to investigate. Moreover results we obtained here might be compared against results obtained by other researchers. The components we selected for both cases in this study are presented in Table II, along with the total number of non-severe and severe reported bugs. IV. E VALUATION After we have trained a classifier, we would like to estimate how accurately the classifier will predict future bug reports. In this section, we discuss the different steps necessary to properly evaluate the classifiers.
the name K-Fold Cross-validation. For example in the case of 10-fold cross validation, the complete set of available bug reports is first split randomly into 10 subsets. These subsets are split in a stratified manner, meaning that the distribution of the severities in the subsets respect the distribution of the severities in the complete set of the bug reports. Then, the classifier is trained using only 9 of the subsets and the classifier is executed on the remaining subset. Here, accuracy metrics are calculated. This process is repeated until each subset has been used for evaluation purposes. Finally, the accuracy metrics of each step are averaged to obtain the final evaluation. B. Accuracy metrics When considering a prediction of our classifier, we can have four possible outcomes. For instance, a severe bug is predicted correctly as a severe or incorrectly as a non-severe bug. For the prediction of a non-severe bug, it is the other way around. We summarize these correct and faulty predictions using a single matrix, also known as the confusion matrix, as presented in table III. This matrix provides a basis for the calculation of many accuracy metrics. Table III C ONFUSION MATRIX USED TO MANY ACCURACY METRICS Correct severity Predicted severity
non-severe
severe
non-severe
tp: true positives
fp: false positives
severe
fn: false negatives
tn: true negatives
A. Training and testing In this study, we apply the widely used K-Fold Crossvalidation approach. This approach first splits up the collection of bug reports into disjoint training and testing sets, then trains the classifier using the training set. Finally, the classifier is executed on the evaluation set and accuracy results are gathered. These steps are executed K times, hence
The general way of calculating the accuracy is by calculating the percentage of bug reports from the evaluation set that are correctly classified. Similarly, precision and recall are widely used as evaluation measures. However, these measures are not fit when dealing with data that has an unbalanced category distribution because of
the dominating effect of the major category [15]. Furthermore, most classifiers also produce probability estimations of their classifications. These estimations also contain interesting evaluation information but unfortunately are ignored when using the standard accuracy, precision and recall approaches [15]. We opted to use the Receiver Operating Characteristic, or simply ROC, graph as an evaluation method as this is a better way for not only evaluating classifier accuracy, but also allows for an easier comparison of different classification algorithms [16]. Additionally, this approach does take probability estimations into account. In this graph, the rate of true positives (TPR) is compared against the rate of false positives (FPR) in a two dimensional coordinate system where: tp tp = TPR = total number of positives tp + f n fp fp FPR = = total number of negatives f p + tn A ROC curve close to the diagonal of the graph indicates random guesses made by the classifier. In order to optimize the accuracy of a classifier, we aim for classifiers with a ROC curve as close as possible to the coordinate (1,0) in the graph. For example, in Figure 2 we see the ROC curves of three different classifiers. We can observe that Classifier 1 demonstrates a random behavior. We also notice that Classifier 2 performs better than random predictions but not as good as Classifier 3. Figure 2.
1
Example of ROC curves Classifier 1 Classifier 2 Classifier 3
V. R ESULTS AND D ISCUSSIONS We explore different classification algorithms and compare the resulting accuracies with each other. This gives us the opportunity to select the most accurate classifier. Furthermore, we investigate what underlying properties the most accurate classifier has learned from the bug reports. This will give us a better understanding of the key indicators of both non-severe and severe ranked bug reports. Finally, we examine how many bug reports we actually need for training in order to obtain a classifier with a reasonable accuracy. A. What classification algorithm should we use? In this study, we investigated different classification algorithms: Na¨ıve Bayes, Na¨ıve Bayes Multinomial, Support Vector Machines and Nearest-Neighbor classification. Each classifier is based on different principles which then results in varying accuracies. Therefore, we compare the levels of accuracy of the algorithms. In Figure 3 (a) and (b) we see the ROC curves of each algorithm denoting its accuracy for respectively an Eclipse and a GNOME case. Remember, the nearer a curve is to the left-upper side of the graph, the more accurately the predictions are. From Figure 3, we notice a winner in both cases: the Na¨ıve Bayes Multinomial classifier. At the same time, we also observe that the Support Vector Machines classifier is nearly as accurate as the Na¨ıve Bayes Multinomial classifier. Furthermore, we notice that the accuracy decreases in the case of the standard Na¨ıve Bayes classifier. Lastly, we see the 1-Nearest Neighbor based approach tends to be the less accurate classifier. Table IV A REA U NDER C URVE RESULTS FROM THE DIFFERENT COMPONENTS
0.8
True positive rate
Product / Component
NB
NB Mult.
1-NN
SVM
0.6
0.4
0.2
0
0
0.1
0.2
0.3
0.4 0.5 0.6 False positive rate
0.7
0.8
0.9
1
Comparing curves visually can be a cumbersome activity, especially when the curves are close together. Therefore, the area beneath the ROC curve is calculated which serves as a single number expressing the accuracy. If the Area Under Curve (AUC) is close to 0.5 then the classifier is practically random, whereas a number close to 1.0 means that the classifier makes practically perfect predictions. This number allows more rational discussions when comparing the accuracy of different classifiers.
Eclipse / SWT
0.74
0.83
0.62
0.76
JDT / UI
0.69
0.75
0.63
0.71
Eclipe / UI
0.70
0.80
0.61
0.79
Eclipse / Debug
0.72
0.76
0.67
0.73
GEF / Draw2D
0.59
0.55
0.51
0.48
CDT / Debug
0.68
0.70
0.52
0.69
Evolution / Mailer
0.84
0.89
0.73
0.87
Evolution / Calendar
0.86
0.90
0.78
0.86
GNOME / Panel
0.89
0.90
0.78
0.86
Metacity / General
0.72
0.76
0.69
0.71
GStreamer / Core
0.74
0.76
0.65
0.73
Nautilus / CDBurner
0.93
0.93
0.81
0.91
The same conclusions can also be drawn from the other selected cases based on an analysis of the Area Under Curve measures in Table IV. In this table here, we highlighted the best results in bold. From these results, we indeed notice that
Figure 3. 1
ROC curves of predictors based on different algorithms 1
NB NB Multinomial 1-NN SVM
NB NB Multinomial 1-NN SVM
0.9
0.8
0.8
True positive rate
True positive rate
0.7 0.6
0.4
0.6 0.5 0.4 0.3
0.2
0.2 0.1
0
0 0
0.1
0.2
0.3
0.4 0.5 0.6 False positive rate
0.7
0.8
0.9
1
(a) Eclipse/SWT
0.1
0.2
0.3
0.4 0.5 0.6 False positive rate
0.7
0.8
0.9
1
(b) Evolution/Mailer
Table V S ECONDS NEEDED TO EXECUTE WHOLE EXPERIMENT. Product / Component
0
NB
NB Mult.
1-NN
SVM
Eclipse / UI
73
1
10
47
GNOME / Mailer
161
2
27
232
the Na¨ıve Bayes Multinomial classifier is the most accurate in all but one single case: the GEF / Draw2D case. In this case, the number of available bug reports for training is rather low and thus we are dealing with an insufficiently trained classifier resulting naturally in a poor accuracy. In this table we can see that the classifier based on Support Vector Machines has an accuracy nearly as good as the Na¨ıve Bayes Multinomial classifier. Furthermore, we see that the standard Na¨ıve Bayes and 1-Nearest Neighbor classifiers are a less accurate approach. Table V shows some rough numbers about the execution times of the whole 10-Fold Cross Validation experiment. Here, we see that Na¨ıve Bayes Multinomial outperforms the other classifiers in terms of speed. The standard Na¨ıve Bayes and Support Vector Machines tend to take the most time. The Na¨ıve Bayes Multinomial classifier has the best accuracy (as measured by ROC) and is also the fastest when classifying the severity of reported bugs. B. How many bug reports do we need for training? Besides the accuracy of the different classifiers, the number of bug reports in the training set also plays an important role in our evaluation. Since the number of bug reports available across the components in a project can be rather low, we aim for the minimal amount of bug reports for training without losing too much on accuracy. Therefore, we
investigate the effect of the size of the training set on the overall accuracy of the classifiers using a so-called learningcurve. A learning-curve is a graphical representation where the x-axis represents the number of training instances and the y-axis denotes the accuracy of the classifier expressed using the Area Under Curve measure. The learning curves of the classifiers are partly shown in Figure 4, the right part of each graph is omitted since the curve remains rather stable here. Furthermore, we are especially interested in the left part of the curves. In the case of the JDT - User Interface component, we observe that for all classifiers the AUC measure stabilizes when the training set contains approximately 400 bug reports (this means about 200 reports of each severity) except in the case of the classifier based on Support Vector Machines. The same holds for the Evolution - Mailer component, besides the fact that we need more bug reports here: approximately 700 reports. This higher number can be explained by the fact that the distribution of the severities in the training sets respects the distribution of the global set of bug reports. To clarify, this component contains almost three times more severe bugs than non-severe and thus when we have 700 bug reports, approximately 250 are non-severe while 450 are severe. Therefore, we assume that we need a minimal number of around 250 bug reports of each severity when we aim to have a reliable stable classifier though we will need to investigate this for more cases to investigate whether this assumption holds. This is particularly the case with the the Na¨ıve Bayes and Na¨ıve Bayes Multinomial classifier. Furthermore, we notice that more available bug reports for training results in more accurate classifiers. The Na¨ıve Bayes and Na¨ıve Bayes Multinomial classifiers are able to achieve stable accuracy the fastest. Also, we need about 250 bug reports of each severity when we train our classifier.
Figure 4.
Learning curves
1 1
NB NB mult. 1-NN SVM
NB NB mult. 1-NN SVM
0.9
0.9
0.8
0.8
0.7
0.7
0.6
0.6
0.5
0.5
0
200
400
600
800
1000
1200
1400
(a) learning curve of JDT/UI
C. What can we learn from the classification algorithm? A classifier extracts properties from the bug reports in the training phase. These properties are usually in the form of probability values for each term estimating the probability that the term appears in a non-severe or severe reported bug. These estimations can give us more understanding about the specific choice of words reporters use when expressing severe or non-severe problems. In Table VI, we reveal these terms which we extracted from the resulting Na¨ıve Bayes Multinomial classifier of two cases. Table VI T OP MOST SIGNIFICANT TERMS OF EACH SEVERITY Case
Non-severe
Severe
Eclipse JDT UI
quick, fix, dialog, type, gener, code, set, javadoc, wizard, mnemon, messag, prefer, import, method, manipul, button, warn, page, miss, wrong, extract, label, add, quickfix, pref, constant, enabl, icon, paramet, constructor
npe, java, file, package, open, junit, eclips, editor, folder, problem, project, cannot, delete, rename, error, view, search, fail, intern, broken, run, explore, cause, perspect, jdt, classpath, hang, resourc, save, crash
Evolution message, not, button, change, Mailer dialog, display, doesnt, header, list, search, select, show, signature, text, unread, view, window, load, pad, ad, content, startup, subscribe, another, encrypt, import, press, print, sometimes
crash, evolut, mail, email, imap, click, evo, inbox, mailer, open, read, server, start, hang, bodi, cancel, onli, appli, junk, make, prefer, tree, user, automat, mode, sourc, sigsegv, warn, segment
When we have a look at Table VI, we notice that some terms conform to our expectations: “crash”, “hang”, “npe” (null pointer exception), “fail” and the like are good indicators of severe bugs. This is less obvious when we investigate
0
500
1000
1500
2000
2500
3000
(b) learning curve of Evolution/Mailer
the typical non-severe terms. This can be explained by the origins of severe bugs which are typically easier to describe using specific terms. For example, the application crashes or there is a memory issue. These situations are easily described using specific powerful terms like “crash” or “npe”. This is less obvious in the case of non-severe indicators since they typically describe cosmetic issues. In this case, reporters use less common terms to describe the nature of the problem. Furthermore, we also notice from Table VI that the terms tend to vary for each component and thus are componentspecific indicators of the severity. This suggests that our approach where we train classifiers on a component base is sound. Each component tends to have its own particular way of describing severe and non-severe bugs. Thus, terms which are good indicators of the severity are usually component-specific. VI. T HREATS TO VALIDITY In this section we identify factors that may jeopardize the validity of our results and the actions we took to reduce or alleviate the risk. Consistent with the guidelines for case studies research (see [17, 18]) we organize them in four categories. Construct Validity: We have trained our classifier per component, assuming that special terminology used per component will result in a better prediction. However, bug reporters have confirmed that providing the “component” field in a bug report is notoriously difficult [8], hence we risk that the users interpreted these categories in different ways than intended. We alleviated the risk by selecting those components with a significant number of bug reports. Internal Validity: Our approach relies heavily on the presence of a causal relationship between the contents of the fields in the bug report and the severity of the bug. There is empirical evidence that this causal relationship indeed holds (see for instance [19]). Nevertheless software developers and
bug reporters confirmed that other fields in the bug report are more important, which may be a confounding factor [8]. External Validity: In this study, we focused on the bug reports of two software projects: Eclipse and GNOME. Like in any other empirical studies, the results obtained from our presented approach are therefore not guaranteed to hold with other software projects. However, we selected the cases to represent worthwhile points in the universe of software projects, representing sufficiently different characteristics to warrant comparison. For instance, Eclipse was selected because its user base exists mostly of developers hence it is likely to have “good” bug reports. The bug reports used in our approach are extracted from cases that use Bugzilla as their bug tracking system. Other bug tracking systems like Jira and CollabNet also exist. However since they potentially use other representations for bug reports, it may be possible that the approach must be adapted to the context of other bug tracking systems. Reliability: Since we use bug reports submitted by the community both as training and evaluation purposes, it is not guaranteed that the severities of these reports are entered correctly. Users fill in the reports and the severity according to their understanding and experience, which does not necessarily correspond with the guidelines. We explicitly omitted the bugs with severity “normal” since this category corresponds to the default severity when submitting a bug and thus likely to be unreliable. The tools we used to process the data might contain errors. We implemented our approach using the widely used opensource data mining tool WEKA [http://www.cs.waikato.ac. nz/ml/weka/]. Hence we believe this risk to be acceptable. VII. R ELATED WORK At the moment, we are only aware of one other study on the automatic prediction of the severity of reported bugs. Menzies et al. predict the severity based on a rule learning technique which also uses the textual descriptions of reported bugs [20]. The approach was applied on five projects supplied by the NASA’s Independent Verification and Validation Facility. In this case-study, the authors have shown that it is feasible to predict the severity of bug reports using a text mining technique even for a more fine-grained categorization than we do (the paper distinguishes between 5 severity levels of which 4 were included in the paper). Since they were forced to use smaller training sets than us (the data sets sizes ranged from 1 to 617 bug reports per severity), they also reported on precision and recall values that varied a lot (precision between 0.08 and 0.91; recall between 0.59 and 1.00). This suggests that the training sets indeed must be sufficiently large to arrive at stable results. Antoniol et al. also used text mining techniques on the descriptions of reported bugs to predict whether a report is either a real bug or a feature request [21]. They used techniques like decision trees, logistic regression and also a
Na¨ıve Bayesian classifier for this purpose. The performance of this approach on three cases (Mozilla, Eclipse and JBoss) indicated that reports can be predicted to be a bug or an enhancement with between 77% and 82% correct decisions. Other current research concerning bug characterization and prediction mainly apply text mining techniques on the descriptions of bug reports. This work can be divided in two groups: automatically assigning newly reported bugs to an appropriate developer based on his or her expertise and detecting duplicate bug reports. A. Automatic bug assignment Machine learning techniques are used to predict the most appropriate developer for resolving a new incoming bug report. This way, bug triagers are assisted in their task. Cubranic et al. trained a Na¨ıve Bayes classifier with the history of the developers who solved the bugs as the category and the corresponding descriptions of the bug reports as the data [3]. This classifier is subsequently used to predict the most appropriate developer for a newly reported bug. Over 30 % of the incoming bug reports of the Eclipse project are assigned to a correct developer using this approach. Anvik et al. continued investigating the topic of the previous work and performed new experiments in the context of automatic bug assignment. The new experiment introduced more extensive preprocessing on the data, introducing more classification algorithms like Support Vector Machines. In this study, they obtained an overall classification accuracy of 57 % and 64 % for the Eclipse and Firefox projects respectively [1]. B. Duplicate bug report detection Since the community behind a project is in some cases very large, it is possible for multiple users to report the same bug into the bug tracking system. This leads to multiple bug reports describing the same bug. These “duplicate” bug reports result in more triaging work. Runeson et al. used text similarity techniques to help automate the detection of duplicate bug reports by comparing the similarities between bug reports [4]. In this instance, the description was used to calculate the similarity between bug reports. Using this approach, over 40 % of the duplicate bug reports are correctly detected. Wang et al. consider not only the actual bug reports, but also include “execution information” of a program which is for example the execution traces [5]. This additional information reflects the situation that lead to the bug and therefore reveal buggy runs. Adding structured and unambiguous information to the bug reports and comparing it to others, improves the overall performance of the duplicate bug report detection technique. VIII. C ONCLUSIONS AND FUTURE WORK A critical item of a bug report is the so-called “severity”, and consequently tool support for the person reporting the
bug in the form of a recommender or verification system is desirable. This paper compares four well-known document classification algorithms (namely, Na¨ıve Bayes, Na¨ıve Bayes Multinomial, K-Nearest Neighbor, Support Vector Machines) to find out which particular algorithm is best suited for classifying bug reports in either a “severe” or a “non-severe” category. We found out that for the cases under investigation (two open source systems: Eclipse and GNOME), Na¨ıve Bayes Multinomial is the classifier with the best accuracy as measured by the Receiver Operating Characteristic. Moreover, Na¨ıve Bayes Multinomial is also the fastest of the four and it requires the smallest training set. Therefore we conclude that Na¨ıve Bayes Multinomial is best suited for the purpose of classifying bug reports. We could also deduce from the resulting classifiers, that the terms indicating the severity of a bug report are component dependent. This supports our approach to train classifiers on a component base. This study is relevant because it enables us to implement a more automated and more efficient bug triaging process. It also can contribute to the current research regarding bug triaging. We see trends concentrating on automating the triaging process where this current research can be combined with our approach with the intention to improve the overall reliability of a more automated triaging process. Future work is aimed at including additional sources of data to support our predictions. Information from the (longer) description will be more thoroughly preprocessed so that it can be used for the predictions. Also, we will investigate other cases, where fewer bug reports get submitted but where the bug reports get reviewed consciously. ACKNOWLEDGMENTS This work has been carried out in the context of a Ph.D grant of the Institute for the Promotion of Innovation through Science and Technology in Flanders (IWT-Vlaanderen). Additional sponsoring by (i) the Interuniversity Attraction Poles Programme - Belgian State – Belgian Science Policy, project MoVES; (ii) the Research Foundation – Flanders (FWO) sponsoring a sabbatical leave of Prof. Serge Demeyer.
R EFERENCES [1] J. Anvik, L. Hiew, and G. C. Murphy, “Who should fix this bug?” in Proceedings of the 28th international conference on Software engineering, 2006. [2] J. Gaeul, K. Sunghun, and T. Zimmermann, “Improving bug triage with bug tossing graphs,” in Proceedings of the European Software Engineering Conference 2009. ACM, 2009, pp. 111–120. [3] D. Cubranic and G. C. Murphy, “Automatic bug triage using text categorization,” in Proceedings of the Sixteenth International Conference on Software Engineering & Knowledge Engineering, June 2004, pp. 92–97. [4] P. Runeson, M. Alexandersson, and O. Nyholm, “Detection of duplicate defect reports using natural language processing,” in Proceedings of the 29th international conference on Software Engineering, 2007.
[5] X. Wang, L. Zhang, T. Xie, J. Anvik, and J. Sun, “An approach to detecting duplicate bug reports using natural language and execution information,” in Proceedings of the 30th international conference on Software engineering, 2008. [6] A. Lamkanfi, S. Demeyer, E. Giger, and B. Goethals, “Predicting the severity of a reported bug,” in Mining Software Repositories, 2010, pp. 1–10. [7] R. Patton, Software Testing (2nd Edition). Sams, 2005. [8] N. Bettenburg, S. Just, A. Schr¨oter, C. Weiss, R. Premraj, and T. Zimmermann, “What makes a good bug report?” in Proceedings of the 16th ACM SIGSOFT International Symposium on Foundations of software engineering. ACM, 2008, pp. 308–318. [9] J. Han, Data Mining: Concepts and Techniques. San Francisco, CA, USA: Morgan Kaufmann Publishers Inc., 2005. [10] R. Feldman and J. Sanger, The Text Mining Handbook: Advanced Approaches in Analyzing Unstructured Data. Cambridge University Press, December 2006. [11] M. Porter, “An algorithm for suffix stripping,” Program, vol. 14, no. 3, pp. 130–137, 1980. [12] I. Herraiz, D. German, J. Gonzalez-Barahona, and G. Robles, “Towards a Simplification of the Bug Report Form in Eclipse,” in 5th International Working Conference on Mining Software Repositories, May 2008. [13] I. Rish, “An empirical study of the na¨ıve bayes classifier,” in Workshop on Empirical Methods in AI, 2001. [14] T. Joachims, “Text categorization with support vector machines: Learning with many relevant features,” Universit¨at Dortmund, LS VIII-Report, Tech. Rep. 23, 1997. [15] C. G. Weng and J. Poon, “A new evaluation measure for imbalanced datasets,” in Seventh Australasian Data Mining Conference (AusDM 2008), ser. CRPIT, J. F. Roddick, J. Li, P. Christen, and P. J. Kennedy, Eds., vol. 87. Glenelg, South Australia: ACS, 2008, pp. 27–32. [16] C. Ling, J. Huang, and H. Zhang, “Auc: A better measure than accuracy in comparing learning algorithms,” in Advances in Artificial Intelligence, ser. Lecture Notes in Computer Science, Y. Xiang and B. Chaib-draa, Eds. Springer Berlin / Heidelberg, 2003, vol. 2671, pp. 991–991. [17] R. K. Yin, Case Study Research: Design and Methods, 3 edition. Sage Publications, 2002. [18] P. Runeson and M. H¨ost, “Guidelines for conducting and reporting case study research in software engineering,” Empirical Software Engineering, 2009. [19] A. J. Ko, B. A. Myers, and D. H. Chau, “A linguistic analysis of how people describe software problems,” in VLHCC ’06: Proceedings of the Visual Languages and Human-Centric Computing, 2006, pp. 127–134. [20] T. Menzies and A. Marcus, “Automated severity assessment of software defect reports,” in IEEE International Conference on Software Maintenance, 28 2008-Oct. 4 2008, pp. 346–355. [21] G. Antoniol, K. Ayari, M. Di Penta, F. Khomh, and Y.G. Gu´eh´eneuc, “Is it a bug or an enhancement?: a textbased approach to classify change requests,” in CASCON ’08: Proceedings of the conference of the center for advanced studies on collaborative research. ACM, 2008, pp. 304– 318.