Downloaded from SAE International by Dereck Dasrath, Wednesday, February 15, 2017
Comparison and Optimization of Fourier Transform Infrared Spectroscopy and Gas Chromatography-Mass Spectroscopy for Speciating Unburned Hydrocarbons from Diesel Low Temperature Combustion
2017-01-0992 Published 03/28/2017
Dereck Dasrath
University of Minnesota
Richard Frazee
AVL Test Systems Inc.
Jeffrey Hwang and William Northrop University of Minnesota
CITATION: Dasrath, D., Frazee, R., Hwang, J., and Northrop, W., "Comparison and Optimization of Fourier Transform Infrared Spectroscopy and Gas Chromatography-Mass Spectroscopy for Speciating Unburned Hydrocarbons from Diesel Low Temperature Combustion," SAE Technical Paper 2017-01-0992, 2017, doi:10.4271/2017-01-0992. Copyright © 2017 SAE International
Abstract
Introduction
Partially premixed low temperature combustion (LTC) in diesel engines is a strategy for reducing soot and NOX formation, though it is accompanied by higher unburned hydrocarbon (UHC) emissions compared to conventional mixing-controlled diesel combustion. In this work, two independent methods of quantifying light UHC species from a diesel engine operating in early LTC (ELTC) modes were compared: Fourier transform infrared (FT-IR) spectroscopy and gas chromatography-mass spectroscopy (GC-MS). A sampling system was designed to capture and transfer exhaust samples for off-line GC-MS analysis, while the FT-IR sampled and quantified engine exhaust in real time. Three different ELTC modes with varying levels of exhaust gas recirculation (EGR) were implemented on a modern light-duty diesel engine. GC-MS and FT-IR concentrations were within 10 % for C2H2, C2H4, C2H6, and C2H4O. While C3H8 was identified and quantified by the FT-IR, it was not detected by the GCMS. Analysis of the spectral fitting residuals revealed features spanning 2700 cm-1 - 3100 cm-1, a region where propane, heavier hydrocarbons, and aldehydes absorb and in some cases are evaluated in the standard Diesel-SCR method. The list of components identified via GC-MS was used to help identify species fitting the spectral residual. Although GC-MS informed FT-IR analysis of low and mid UHC emitting LTC modes, it was not a factor in analysis of the LTC high UHC emitting mode. Results show that different species likely comprise the identified spectral residual for these different LTC modes. Although GC-MS can aid in FT-IR spectral analysis to further refine FT-IR methods for real time measurement of unconventional combustion mode exhaust species, its utility is dependent upon the chemical properties of the GC stationary phase responsible for speciation ahead of MS analysis.
Low temperature combustion (LTC) is a well-known approach for preventing in-cylinder soot and NOX formation in diesel engines. It is achieved by extending ignition delay through increasing injection pressure to augment mixing and by adding high levels of exhaust gas recirculation (EGR) [1, 2, 3, 4, 5]. Extended ignition delay results in primarily premixed combustion and increased dilution lowers combustion temperatures. LTC can be attained with either early or late injection strategies. Early LTC (ELTC) injects fuel 20 to 30 crank angle degrees before top dead center (DBTDC) during the compression stroke while late LTC (LLTC) injects fuel 0.5 to 9 DBTDC. Both methods allow for high levels of mixing and smokeless combustion [6], [7]. While soot and NOX are essentially eliminated during LTC modes, unburned hydrocarbon (UHC) emissions increase. Intermediate hydrocarbon species from combustion such as methane, ethane, propylene, formaldehyde, acetaldehyde, and others cannot be fully oxidized due to low combustion temperatures, resulting in increased UHC emissions [8, 9, 10]. Other sources of UHC emissions include fuel impinging on the piston bowl and incomplete combustion in over-lean regions of the cylinder. In practice, UHCs from conventional diesel combustion (CDC) are oxidized in a diesel oxidation catalyst (DOC) that typically requires exhaust temperatures to be greater than 250 °C for complete conversion. In LTC, exhaust temperatures are often lower than the required limits for conversion efficiencies found during CDC, preventing their oxidation in a DOC. Further, CO and unsaturated hydrocarbons are known to reversibly poison DOCs at the high concentrations found in LTC exhaust [11].
Downloaded from SAE International by Dereck Dasrath, Wednesday, February 15, 2017
Since certain species are more likely to deactivate DOCs than others, it is advantageous to understand the individual species that make up the overall UHC in diesel LTC. Fourier Transform Infrared (FT-IR) is a valuable technique for analyzing UHC species from engine exhaust in real time. Unlike other emissions analyzers, FT-IR is able to simultaneously speciate a predetermined set of calibrated compounds. FT-IR analysis methods identify and quantify compounds by fitting specific absorption bands in a particular wavenumber region for a given compound. However, selecting interference free bands when measuring complex gas mixtures at low resolution can lead to significant inaccuracies [12]. Today’s modern FT-IR analyzers can operate at high resolution (0.5 cm-1) and modern computing power has made FT-IR spectral fitting and data reporting reasonably fast at up to 5 Hz. Absorption band interference can be difficult to account for. However, a key issue remains in accounting for “unexpected” compounds when using FT-IR, which may arise in exhaust from unconventional combustion strategies and/or alternative fuels [13]. Total hydrocarbons (THC) in engine exhaust are traditionally measured with an on-line flame ionization detector (FID), which measures total hydrocarbons on a C1 basis by measuring ions produced when organic compounds pass through a hydrogen flame. Previous work by the corresponding author has shown that FT-IR underreported total THC concentration at light-load LTC conditions as compared to a FID, showing that THC and FT-IR measurements may not be comparable for engine conditions containing high THC emissions [14]. Indeed, it is well known that these two methods do not directly compare when measuring THC from conventional combustion exhaust. Although the FT-IR measurement does not suffer from differential hydrocarbon response as the FID does, it can only quantify the hydrocarbons included in the method evaluation for a given fuel and combustion strategy. FID is the industry standard method for measuring THC; however, it may also not be the most accurate method, especially for oxygenated hydrocarbons where oxygen obscures the ionization detection. Previous work has sought to use both FID and FT-IR to better understand UHC emissions from advanced combustion modes. For example, Koci et al. conducted a detailed investigation of UHCs in a highly-dilute LTC regime using a flow-through emissions bench capable of measuring CO, CO2, O2, THC, NOX, as well as particulate matter [15]. In addition, a wide spectrum FT-IR was used to identify several hydrocarbons in the C1 - C12 range. A comparison between THC as measured by FID and FT-IR showed a correlation, except at extremely early and late injection times where HC species (< C6) had a decreased FTIR response compared to FID. UHC speciation can also be accomplished by analyzing collected samples using gas chromatography (GC). For example, Han et al. used GC with FID to perform a thorough investigation of the species formed under several different LTC conditions [16]. Tedlar® bags were used to collect hydrocarbons (C1 - C8) and Tenax® traps for semi-volatile hydrocarbons (SVHC) (> C8). Two GC instruments with FID and thermal conductivity detectors were used: one for HCs and the other for the SVHCs. In total, over 210 exhaust hydrocarbon species were detected, and 70% of total carbon mass was identified. Known concentrations of propane were added to each Tedlar® bag as an internal standard before GC-FID analysis. With the absence of a
mass spectrum, use of the propane as an internal standard helped with peak identification and quantification. The GC-FID results were validated by comparing overall UHC concentration with the THC measurement from a FID as part of a conventional emissions bench. With the capability to identify any compound based on its mass spectrum, GC coupled with mass spectroscopy (GC-MS) is a powerful tool when the identity of exhaust species is ambiguous. More broadly, it is also one of the most accurate techniques used for quantitative concentration measurements for gases. Because GC is an off-line analysis method, transferring a gas sample from the point of extraction to the point of injection increases the chances for loss, chemical instability/reactivity, and contamination, thereby compromising repeatability, accurate identification, and quantification. Examples of losses include, but are not limited to, condensation in unheated sample lines, chemical instability/reactivity, and dilution with partially evacuated or unpurged storage reservoirs and lines. Careful gas sample system design is crucial to mitigate such sources of potential loss, identify sources of dilution, and increase measurement repeatability for this type of gas analysis. Though many studies have used a single method for speciating UHCs, few have combined methods to qualitatively and quantitatively compare their accuracy [17]. In one study, Dagaut et al. combined FT-IR and GC-TCD/FID to analyze combustion processes in a jet-stirred reactor [18]. Low pressure samples were collected by sonic quartz probe sampling into 1 liter Pyrex bulbs initially at ~ 40 mbar. The results showed that the independent methods were in very good agreement for methane, CO, and CO2. The work presented here combines off-line GC-MS and on-line FT-IR methods to quantify light UHCs from diesel ELTC modes. A novel sampling system was designed to collect a known quantity of exhaust gas and transfer it to a GC-MS while reducing the risk of transfer losses and unexpected dilution. GC-MS was used to identify potential compounds whose IR spectra were used together with FT-IR spectral reprocessing. GC-MS analysis is used to provide the necessary foundation for developing a more representative FT-IR method for the online quantification of light (< C8) UHC species from diesel LTC operation.
Experimental and Analytical Methods Engine Setup and Test Procedure This study was performed using exhaust from a 4-cylinder GM A20DTH 2.0 liter turbocharged direct-injection compression ignition engine [19]. The engine was equipped with a variable geometry turbocharger (VGT), variable swirl actuation (VSA), and high pressure common rail fuel injection. It was controlled with National Instruments hardware coupled with a fully configurable Drivven engine control unit. A modified EGR system was used for greater control of EGR temperature, while an aftermarket PID controlled water/air after-cooler provided improved control of intake manifold temperatures. Non-oxygenated, ultra-low sulfur #2 diesel (ULSD) fuel was used in this study. In order to achieve LTC, the engine was first motored, and then operated at the designated engine operation settings (VGT, VSA, fuel pressure) with dual injection CDC until steady state operating
Downloaded from SAE International by Dereck Dasrath, Wednesday, February 15, 2017
conditions were reached. The EGR valve was then opened, pilot injection turned off, and main injection timing advanced slowly until an ELTC mode was achieved. The engine was then allowed to reach steady state.
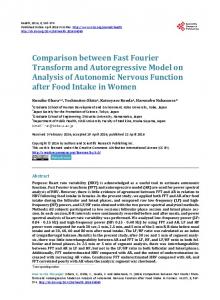
Figure 1. Engine testing schematic
Engine exhaust was sampled from the outlet of the turbocharger prior to entering a DOC and diesel particulate filter (DPF). Heated lines at 191 °C were used to route exhaust gas to both the FTIR and GC-MS sampling system. The engine schematic is shown in Figure 1. Table 1 shows the engine operating conditions investigated during this study. In addition to CDC, three LTC combustion modes, produced by varying EGR rates to increase UHC concentrations ranging from low (LTC 1) to high (LTC 3), were studied. FT-IR spectra were collected at a frequency of 1 Hz for off-line analysis of each testing condition. Table 1. Testing Conditions
Fourier Transform Infrared Spectroscopy (FT-IR) An AVL SESAM i60 FT bench was used in this study to measure light hydrocarbons (LHC) (C4 and below) and limited heavy hydrocarbons (HHC) including octane and aromatic hydrocarbons (AHC) through a method designed for CDC. All measurements were made with a scanning frequency of 1 Hz. As seen in Figure 1, heated sample lines maintained at 191 °C were used to route exhaust from
the test engine to a heated filter equipped with a glass/PTFE filter supplied by Unique Heated Products to remove soot prior to entering the spectrometer. Prior to engine startup, the FT-IR spectrometer detector was cooled with liquid nitrogen to 65-77 K. A system leak check followed by an auto-calibration (background) were successfully performed. During testing, background values for H2O and CO2 were maintained at less than 1% difference from the gas cell reference. The manufacturer supplied diesel recipe/method (DieselSCR) was used for quantification of UHC species. The recipe/method is designed to account for and quantify compounds commonly observed in diesel combustion exhaust. The FT-IR measures the amount of infrared light absorbed via numerous compounds in the mid-IR range (400-4000 cm-1). Individual gaseous exhaust species absorb different wavelengths of infrared light, and the amount of light absorbed at specific wavelengths produces a spectrum that is iteratively fit relative to known concentrations of these same species. Spectra collected during testing were reprocessed and analyzed using MKS Instruments MG2000 (v7.2) software. In order to evaluate fitting residuals, “calculate residuals/errors” was enabled in the “Setup” window with the Diesel-SCR method loaded. During the “Reprocess” function, the “Spectral Resids” display mode was chosen. After loading the Diesel-SCR method into the Spectrum Utility, “Method Analyzer”, a spectrum representative of the interfering species was loaded. A spectrum of the residual feature is revealed by successive subtraction of each expected (Diesel-SCR method) component. Care was taken only to remove intensities associated with a given component. In an effort to reduce the residual feature intensity to zero, additional spectral methods were added to the Diesel-SCR method and the entire process was repeated.
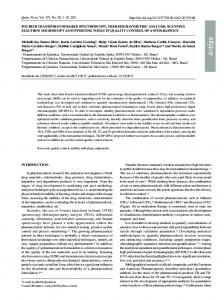
Gas Sampling System A gas sampling system was developed for extracting, storing and transferring engine exhaust to a GC-MS for off-line analysis. A series of four dry impingers were arranged in series and submerged in an ice bath between the sampling unit and the heated exhaust line in order to condense otherwise column damaging HCs (> C10) (Figure 2). The sample reservoir section of the system was initially evacuated to a pressure of ~ 5 psi absolute. Once the engine reached a steady state, the vacuum pump pulled exhaust through the heated sample line into the impingers at ~ 2 LPM while bypassing the sample reservoir. This allowed all lines leading to the sample reservoir to be filled with exhaust and for condensate to be collected for later GC analysis. In this study, only select light UHC species were quantified with the GC due to column restrictions. Once approximately 6 mL of condensate was collected in the impingers (enough for 6 GC injections), the exhaust flow was directed into the sample reservoir through a throttling valve set at ~ 1 LPM. After exhaust filled the sample reservoir to atmospheric pressure, flow to the reservoir was stopped and the sampling system was moved to another laboratory room for analysis. The sampling reservoir and lines were then pressurized with helium creating a 2:1 dilution for LTC modes and 1.5:1 for CDC modes. Applying Dalton’s Law, relative mole fractions for air, exhaust, and helium remaining in the system can be estimated by measuring the pressures under each condition using a pressure transducer and assuming that N2 is the predominant gas in the exhaust after the
Downloaded from SAE International by Dereck Dasrath, Wednesday, February 15, 2017
condensation trap. The total number of moles of exhaust gas, nexh was determined using the Ideal Gas Law. This value was used in the partial pressure equation where:
simultaneously shifts the inlet and outlet to flow carrier gas into the sample loop and then on to the column. The details of the GC-MS and its parameterization are listed in Table 2. Table 2. GC-MS parameters
(Eq. 1)
Because PT V, nair and nexh are known, nHe is easily determined. Applying the Van Der Waals non-ideal gas correction for volume and pressure was found to have negligible effects on species concentrations (< 1%).
Figure 2. Gas sampling schematic
When the vent valve was open to atmosphere, sample gases under pressure flowed out and through the GC sample loop. The use of pumps or any other mechanical devices, which can promote HC losses, were eliminated in this sampling method. With the sampling system heated to 100 °C, leftover analyte was removed by pressurizing and flowing nitrogen through for quick turnaround. When the sampling system was connected to the GC gas sampling line and loop (Figure 2), it was purged then evacuated before injection to minimize wasted analyte. This minimized the risk of diluting analyte with ambient room air or any other gases. Once the sample line was filled with analyte, the vent was opened to allow flow through the sample loop as previously mentioned. A constant pressure of analyte was passed through a low-pressure regulator (1 psi gauge) for increased repeatability of GC injection conditions.
Gas Chromatography with Mass Spectroscopy (GC-MS) The GC used in this study was an Agilent 7890B coupled to an Agilent 5977A Mass Spectrometry Detector (MSD). The GC was fitted with a 6-port 2-way pneumatic gas switching valve. A test run was performed using dry shop air before each engine mode case to ensure there were no residuals trapped within the GC column from previous runs. When in the load position and while the carrier gas was being introduced to the column, test gases entered the sample valve, through a 0.25 mL sample loop, and vented to atmosphere. Sample gas was injected into the GC via a switching valve that
Data acquisition and analysis were performed with Agilent Chemstation software. The quantification database was developed using a calibration standard that consisted of 21 different gaseous compounds balanced in nitrogen. A linear regression calibration curve was fitted for each compound having at least two concentrations consisting of three measurements each. A single background subtraction (BSB) was performed on the back end of each total ion chromatogram (TIC), and then integrated. Compounds that eluted at the same time as compounds found in the calibration standard were checked with the NIST Standard Reference Database as well as with their target and qualifier ions to validate their identity. Quantitative analysis was then performed and a report was generated for each compound that had a calibration curve.
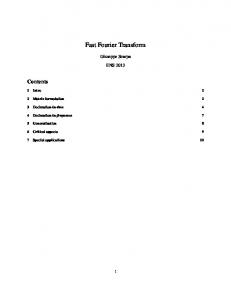
Results and Discussion The FT-IR measured UHC species concentrations are summarized in Table A1 of the Appendix. Concentrations of individual hydrocarbon species in CDC exhaust were normal. As expected for LTC, these same species were present in much higher concentrations as measured by both methods. Each LTC exhaust sample from the same test was sampled, injected and analyzed six times using GC-MS. In the first three minutes, nitrogen and oxygen co-elute, followed by the CO2 peak; each of these exceeded the ion detector limit and therefore are not quantified in this analysis. GC-MS species concentrations and retention times can be found in Table A2 of the Appendix. A GC-MS TIC, which depicts well defined peaks of eluted compounds, from one of the CDC runs is shown in Figure 3. The Porous Layer Open Tubular (PLOT) GC column used in this study is designed for retention of low molecular weight hydrocarbons while being highly inert and unaffected by wet samples that can influence retention stability. It was observed that acetaldehyde was retained while similar
Downloaded from SAE International by Dereck Dasrath, Wednesday, February 15, 2017
oxygenates such as formaldehyde and benzaldehyde were not. For this specific column, retention becomes difficult for some oxygenates and aromatics due to the chemical nature of the bonded stationary silica-based phase. Hence, identification and quantification are limited to a few aromatic and oxygenated compounds in this study.
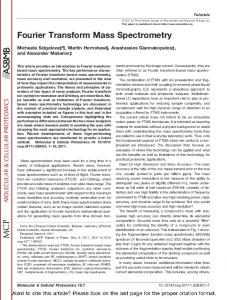
The emissions index (EI) of species measured by the FT-IR and GCMS are compared in Figure 4. The FT-IR is capable of measuring hydrocarbons C1-C8, while the GC-MS, as configured for this study, measured C2-C8. While the FT-IR measured aromatic hydrocarbons (toluene, benzene, and xylenes) by fitting the fine structure of toluene alone, the GC-MS was able to speciate and quantify heavier HCs (cyclo-hexane, heptane, and iso-octane) and specific aromatic HCs (benzene, toluene, ethylbenzene, and p-xylene). Although the FT-IR is capable of quantifying the heavier HCs, heptane and n-octane, the Diesel-SCR method used in this study did not include these compounds. A very good correlation between the two measurement techniques was observed for acetylene, ethylene, ethane, propene, and acetaldehyde. The GC-MS had a higher standard deviation between GC injections for the CDC case and HHCs in general. It is important to note that the FT-IR reported propane for the LTC cases whereas the GC-MS reported a value under its detection limit. Propane is not known to be a product of CDC or LTC [15]. Because the FT-IR recipe was designed for CDC, it could suffer from unknown species interference elicited from LTC modes [14].
Figure 3. TIC of CDC exhaust sample with BSB
To verify the existence of absorption band interference, sample spectra were collected during CDC and the transition to LTC. The spectra from each LTC mode were reprocessed revealing a significant fitting residual between 2700 and 3100 cm-1 (Figures 4 & 5 black solid line). The identical residual feature was found in both LTC 1 & 2, however, LTC 3 produced a somewhat different residual. Due to the lower temperature of these combustion modes, it was hypothesized that these features were the result of unburned diesel fuel vapor, for which the FT-IR CDC method does not account. It is clear from Figures 5 & 6 that removal of diesel vapor intensity alone only partially accounts for the residual features. This is particularly evident for the LTC 3 residual (Figure 6). In an effort to reduce the overall residual intensity, the compounds identified from GC-MS analysis were investigated. Digital spectra of these compounds and others were taken from MGRefsMaster R3 Spectral Library (251 individual compound spectra), which is available for purchase from MKS Instruments, Methuen MA. The Library contains both methods and calibration spectra for each compound. These can be incorporated into any existing method or recipe in order to identify the source of residual intensity in a complex gaseous spectrum. Information regarding the accuracy, traceability, and general quality of the methods can be found in the accompanying portable document file delivered with the library. Of the eleven compounds identified in LTC 2 & 3, only two, acetaldehyde and iso-octane, were found to have significant intensity in the residual region. Removal of the intensities of these compounds together with dodecane (or n-decane) and benzaldehyde reduced the intensity across the entire LTC 2 residual region to a much greater extent. Interestingly, the same kind of intensity reduction for the LTC 3 residual did not involve acetaldehyde or iso-octane. Figure 6 shows that dodecane (or n-decane), benzaldehyde, and hexadecane were required to remove much of the residual feature intensity. Figure 7 shows that the final residuals for LTC 2 & 3 are significantly different. These results suggest that raw diesel fuel is likely not the source of the residual feature. More importantly, they suggest that the source of the residual feature is different for the LTC modes and that combustion chemistry between LTC 1 & 2 may be different from that of LTC 3.
Figure 4. GC-MS vs. FT-IR emissions index. Region 1: FT-IR only; Region 2: FT-IR and GC-MS; Region 3: GC-MS only)
Downloaded from SAE International by Dereck Dasrath, Wednesday, February 15, 2017
Figure 5. LTC 2 FT-IR absorbance: original LTC residual (black), original residual with diesel vapor subtracted (blue), original residual with selected compounds subtracted (red)
Figure 7 shows that the intensity of each residual is not fully accounted for in the current analysis. The next steps in method development are to carefully record calibration spectra for each identified component and incorporate these calibrations into the CDC method, Diesel-SCR. This requires careful analysis of interferences and selection of fitting regions. It may also require altering fitting regions for other components in the standard method. Finally, the method must be evaluated by collecting spectra from each LTC mode and reprocessing them. Evaluation of the spectral residual fittings will reveal how well the new method measures the new components and accounts for the majority of the intensity in the 2700-3100 cm-1 region. Significant improvements in the utility of the GC-MS in this process might include incorporation of two or more stationary phase columns in parallel as well as the ability to sample the condensate where additional exhaust gas components may be found. Alternatively, utilizing a stationary phase column designed for speciation of HHCs (> C8) could replace the need for condensate trapping altogether. The results indicate that care must be taken when applying FT-IR methods optimized for CDC modes to unconventional modes such as LTC. Specifically, one should routinely evaluate FT-IR spectral fitting residuals to ensure that compounds and concentrations are accurately identified and quantified. In this way, the FT-IR can be used as a discovery tool itself or in conjunction with other speciation methods like GC-MS in the evaluation of exhaust from alternative combustion modes and/or fuels.
Conclusion
Figure 6. LTC 3 FT-IR absorbance: original LTC residual (black), original residual with diesel vapor subtracted (blue), original residual with selected compounds subtracted (red)
Figure 7. LTC 2 & LTC 3 residual absorbance after subtraction of selected compounds
In this paper, FT-IR and GC-MS measurements of LHC species concentrations in LTC diesel exhaust were measured and compared. A fixed-volume sampling system was developed for extracting exhaust and injecting it into a GC while minimizing dilution, LHC losses, and removing HHC. The measurement techniques were found to have good correlation (> 90%) for acetylene, ethylene, ethane, and acetaldehyde. FT-IR spectral reprocessing and method analysis was used in conjunction with species identified via GC-MS in an effort to identify FT-IR CDC method interferent(s) in LTC exhaust. The interfering species spectral features were found to be consistent with intermediates of combustion rather than raw diesel, as originally speculated. Interestingly, the analysis revealed different compounds in the low (LTC 1) and mid (LTC 2) HC modes as compared to that of the high HC mode (LTC 3). Dodecane (or n-decane) and benzaldehyde appear to be common intermediates between the LTC modes, while LTC 1 & 2 appear to additionally contain significant amounts of acetaldehyde and iso-octane. Although the FT-IR alone could have been used to identify the species, the GC-MS results narrowed the spectral search thereby shortening the FT-IR method development process. Future efforts to enhance this process will be to use a Restek Rxi-624-MS column to extend the range of hydrocarbons speciated by the GC-MS to higher molecular weights. The results of this study suggest that not only can FT-IR and GC-MS be used in conjunction to measure a variety of compounds from unconventional combustion modes, alternative fuels, or new catalyst materials, but they can also be used together as investigative tools in the discovery of unsuspected or new intermediates arising from future combustion strategies or catalyst materials.
Downloaded from SAE International by Dereck Dasrath, Wednesday, February 15, 2017
References 1.
Jacobs T. J. and Assanis D. N., “The attainment of premixed compression ignition low-temperature combustion in a compression ignition direct injection engine,” Proc. Combust. Inst., vol. 31 II, pp. 2913-2920, 2007.
2.
Han D., Ickes A. M., Bohac S. V., Huang Z., and Assanis D. N., “HC and CO emissions of premixed low-tempearture combustion fueld by blends of diesel and gasoline.”
3.
Northrop W. F., Bohac S.V., and Assanis D. N., “Premixed Low Temperature Combustion of Biodiesel and Blends in a High Speed Compression Ignition Engine,” 2009.
4.
Koci, C., Ra, Y., Krieger, R., Andrie, M. et al., "MultipleEvent Fuel Injection Investigations in a Highly-Dilute Diesel Low Temperature Combustion Regime," SAE Int. J. Engines 2(1):837-857, 2009, doi:10.4271/2009-01-0925.
5.
Feng X., Huo M., Lee C.-F., and Liu H., “The Effects of EGR and Injection Timing on the Engine Combustion and Emission Performances Fueled by Butanol-Diesel Blends,” vol. c, 2012.
6.
Zheng M., Reader G. T., and Hawley J. G., “Diesel engine exhaust gas recirculation-a review on advanced and novel concepts,” Energy Convers. Manag., vol. 45, no. 6, pp. 883-900, Apr. 2004.
7.
Abu-Jrai A., Rodríguez-Fernández J., Tsolakis A., Megaritis A., Theinnoi K., Cracknell R. F., and Clark R. H., “Performance, combustion and emissions of a diesel engine operated with reformed EGR. Comparison of diesel and GTL fueling,” Fuel, vol. 88, no. 6, pp. 1031-1041, 2009.
8.
Kashdan J., Mendez S., and Bruneaux G., “An Investigation of Unburned Hydrocarbon Emissions in Wall Guided, Low Temperature Diesel Combustion Region of Interest Revolutions per Minute Start of Injection,” vol. 63, no. 4, pp. 433-459, 2008.
9.
Han M., Assanis D. N., Jacobs T. J., and Bohac S. V., “Method and Detailed Analysis of Individual Hydrocarbon Species From Diesel Combustion Modes and Diesel Oxidation Catalyst,” J. Eng. Gas Turbines Power, vol. 130, no. 4, p. 42803, 2008.
10. Sluder, C., Wagner, R., Lewis, S., and Storey, J., "Exhaust Chemistry of Low-NOX, Low-PM Diesel Combustion," SAE Technical Paper 2004-01-0114, 2004, doi:10.4271/2004-01-0114.
15. Koci, C., Ra, Y., Krieger, R., Andrie, M. et al., "Detailed Unburned Hydrocarbon Investigations in a Highly-Dilute Diesel Low Temperature Combustion Regime," SAE Int. J. Engines 2(1):858-879, 2009, doi:10.4271/2009-01-0928. 16. Han M., Assanis D. N., and Bohac S. V., “Sources of Hydrocarbon Emissions from Low-Temperature Premixed Compression Ignition Combustion from a Common Rail Direct Injection Diesel Engine,” Combust. Sci. Technol., vol. 181, no. 3, pp. 496-517, Feb. 2009. 17. Sasaki T. a and Wilkins C. L., “Gas chromatography with Fourier transform infrared and mass spectral detection,” Most, vol. 842, pp. 341-349, 1999. 18. Dagaut P. and Nicolle A., “Experimental study and detailed kinetic modeling of the effect of exhaust gas on fuel combustion: Mutual sensitization of the oxidation of nitric oxide and methane over extended temperature and pressure ranges,” Combust. Flame, vol. 140, no. 3, pp. 161-171, 2005. 19. Lucachick, G., Avenido, A., Kittelson, D., and Northrop, W., "Exploration of Semi-Volatile Particulate Matter Emissions from Low Temperature Combustion in a Light-Duty Diesel Engine," SAE Int. J. Engines 7(2):852-859, 2014, doi:10.4271/2014-011306.
Contact Information William F. Northrop 612-625-6854
[email protected] Richard W. Frazee 734-259-9615
[email protected]
Acknowledgements The authors would like to thank our colleagues at the Thomas E. Murphy Engine Research Laboratory at the University of Minnesota. This work was partially funded by the National Science Foundation under research grant numbers 1428318 and 1350709.
11. Northrop W. F., Jacobs T. J., Assanis D. N., and Bohac S. V, “Deactivation of a diesel oxidation catalyst due to exhaust species from rich premixed compression ignition combustion in a light-duty diesel engine,” Int. J. Engine Res., vol. 8, no. 6, pp. 487-498, 2007.
Abbreviations
12. Gierczak C. A., Andino J. M., Butler J. W., Heisner G. A., Jesion G., and Korniski T. J., “FTIR: Fundamentals and applications in the analysis of dilute vehicle exhaust,” Sociol. J. Br. Sociol. Assoc., 1991.
CDC - Conventional Diesel Combustion
13. Sedlmaiera A., Schäfera K., Beckerb K. H., Brockmannb K., Helandb J., Kurtenbachb R., Lörzerb J., Wiesenb P., Umweltforschung A., Wuppertal G., and Fb P. C. I., “Determination of VOCs in traffic exhaust by FTIR absorption spectrometry,” vol. 3821, no. June, 1999.
DPF - Diesel Particulate Filter
14. Northrop W. F. and Avenido A. S., “Fractionation of engine exhaust hydrocarbons using flame ionization detection with variable temperature sample conditioner,” Int. J. Engine Res., vol. 17, no. 2, pp. 235-245, 2015.
AHC - Aromatic Hydrocarbon BMEP - Brake Mean Effective Pressure BSB - Background Subtraction DBTDC - Degrees Before Top Dead Center DOC - Diesel Oxidation Catalyst EGR - Exhaust Gas Recirculation EI - Emissions Index ELTC - Early Low Temperature Combustion FID - Flame Ionization Detector FT-IR - Fourier Transform Infrared Spectroscopy GC - Gas Chromatography GC-MS - Gas Chromatography Mass Spectroscopy HC - Hydrocarbon
Downloaded from SAE International by Dereck Dasrath, Wednesday, February 15, 2017
HHC - Heavy Hydrocarbon
SCR - Selective Catalytic Reduction
LHC - Light Hydrocarbon
SVHC - Semi Volatile Hydrocarbon
LLTC - Late Low Temperature Combustion
THC - Total Hydrocarbon
LTC - Low Temperature Combustion
TIC - Total Ion Chromatogram
MSD - Mass Spectrometry Detector
UHC - Unburned Hydrocarbon
NIST - National Institute of Standards and Technology
ULSD - Ultra-Low Sulfur Diesel
PID - Proportional Integral Derivative
VGT - Variable Geometry Turbocharger
PLOT - Porous Layer Open Tubular
VSA - Variable Swirl Actuation
PTFE - Polytetrafluoroethylene
Downloaded from SAE International by Dereck Dasrath, Wednesday, February 15, 2017
APPENDIX Table A1. Measured FT-IR concentrations
Table A2. GC-MS measurement of species concentrations and retention times
The Engineering Meetings Board has approved this paper for publication. It has successfully completed SAE’s peer review process under the supervision of the session organizer. The process requires a minimum of three (3) reviews by industry experts. All rights reserved. No part of this publication may be reproduced, stored in a retrieval system, or transmitted, in any form or by any means, electronic, mechanical, photocopying, recording, or otherwise, without the prior written permission of SAE International. Positions and opinions advanced in this paper are those of the author(s) and not necessarily those of SAE International. The author is solely responsible for the content of the paper. ISSN 0148-7191 http://papers.sae.org/2017-01-0992