Diagnostic Microbiology and Infectious Disease xxx (2015) xxx–xxx
Contents lists available at ScienceDirect
Diagnostic Microbiology and Infectious Disease journal homepage: www.elsevier.com/locate/diagmicrobio
Comparison of sensitivity and specificity of 4 methods for detection of Giardia duodenalis in feces: immunofluorescence and PCR are superior to microscopy of concentrated iodine-stained samples Helle Gotfred-Rasmussen a, Marianne Lund b, Heidi L. Enemark c, Mogens Erlandsen d, Eskild Petersen a,b,⁎ a
Department of Infectious Diseases, Aarhus University Hospital Skejby, Aarhus Denmark Department of Clinical Microbiology, Aarhus University Hospital Skejby, Aarhus Denmark c Norwegian Veterinary Institute, PO Box 750 Sentrum, N-0106 Norway d Department of Public Health, Section for Biostatistics, Aarhus University, Aarhus, Denmark b
a r t i c l e
i n f o
Article history: Received 16 July 2015 Received in revised form 6 November 2015 Accepted 8 November 2015 Available online xxxx Keywords: Giardia Diagnostic methods PCR Immunofluorescence Microscopy
a b s t r a c t For decades, microscopy of feces after formol-ethylacetate (FEA) concentration and iodine staining has been the routine test for intestinal protozoa. Lately, polymerase chain reaction or fluorescence-labeled parasite-specific antibodies have been introduced, but their place in everyday routine diagnostics has not yet been established. We compared FEA and salt–sugar flotation (SSF) concentration followed by microscopy of iodine-stained concentrate and immunofluorescence assay (IFA) and real-time polymerase chain reaction (qPCR) for detection of Giardia duodenalis in human feces. The median number of Giardia cysts found by FEA in 19 Giardia-positive samples was 50 cysts per gram (CPG), by SSF 350 CPG, by IFA 76,700 CPG, and by qPCR 316,000 CPG. We next tested 455 consecutive samples for presence of Giardia cysts. Using IFA as reference, qPCR had a sensitivity of 91%, specificity of 95.1%, a false-positive rate of 50%, a false-negative rate of 0.48%, a positive predictive value of 50%, and a negative predictive value of 99.5%. In conclusion, qPCR and IFA were significantly more sensitive than microscopy of iodine-stained concentrates using either FEA or SSF. We suggest, when using qPCR, that positive samples are verified by IFA to prevent false-positive results. © 2015 The Authors. Published by Elsevier Inc. This is an open access article under the CC BY-NC-ND license (http://creativecommons.org/licenses/by-nc-nd/4.0/).
1. Introduction Infections with intestinal protozoan parasites like Giardia duodenalis (syn. G. intestinalis and G. lamblia), Cryptosporidium spp. and Entamoeba histolytica are found worldwide and microscopy for intestinal protozoa after formol-ether (FE) or formol-ethylacetate (FEA) concentration is standard procedure for investigating patients with diarrhea where a protozoan etiology is suspected (de Waal, 2012; Fletcher et al., 2012; Muhsen and Levine, 2012). Zinc sulfate flotation for concentration of intestinal protozoa was first described in 1938 (Faust et al., 1938) and soon modified (Sawitz and Faust, 1941); in 1948, the FE concentration technique was described (Ritchie, 1948). The FE and the zinc sulfate flotation methods were compared in 2 studies, which found them equally sensitive (Bartlett et al., 1978; Ritchie et al., 1952). The use of ether has since been substituted with ethylacetate, without any change in sensitivity (Erdman, 1981), to become the FEA concentration technique used in this study. Additionally, we included another flotation method, namely, the salt–sugar flotation
⁎ Corresponding author. Tel.: +45-7845-2817; fax: +45-7845-2870. E-mail address:
[email protected] (E. Petersen).
(SSF) technique as an alternative to FEA. This technique has elsewhere been used to concentrate and quantify Cryptosporidium spp. oocysts and Giardia spp. cysts in fecal samples from animals (Maddox-Hyttel et al., 2006). The SSF technique is advantageous to FEA, while the concentrated samples can be analyzed with polymerase chain reaction (PCR) resulting in higher sensitivity. On the other hand, the SSF technique is rather laborious and may therefore not fit well in a diagnostic laboratory. Immunofluorescence assays (IFAs) can be used to stain fecal smears without initial concentration; this method has an increased sensitivity compared to FEA (Garcia et al., 1992; Rose et al., 1989). Lately, the use of PCR has been introduced, but its place in routine diagnosis of intestinal protozoal infection has yet to been determined. The introduction of PCR allows semiautomation of the diagnostic procedure, and multiplex PCR permits the detection of several different parasite species (Bruijnesteijn van Coppenraet and Wallinga, 2009; Mary et al., 2013; Stensvold and Nielsen, 2012), as well as gastrointestinal bacteria and viruses (van Lieshout and Roestenberg, 2015) in 1 working process. Care should be taken when analyzing samples for G. duodenalis in feces, while G. duodenalis DNA can be present in feces after the infection has been cleared and may cause false-positive reactions. This may also blur reinfection shortly after clearance of the initial infection (van den Bijllaardt et al., 2014).
http://dx.doi.org/10.1016/j.diagmicrobio.2015.11.005 0732-8893/© 2015 The Authors. Published by Elsevier Inc. This is an open access article under the CC BY-NC-ND license (http://creativecommons.org/licenses/by-nc-nd/4.0/).
Please cite this article as: Gotfred-Rasmussen H, et al, Comparison of sensitivity and specificity of 4 methods for detection of Giardia duodenalis in feces: immunofluorescence and PCR ar..., Diagn Microbiol Infect Dis (2015), http://dx.doi.org/10.1016/j.diagmicrobio.2015.11.005
2
H. Gotfred-Rasmussen et al. / Diagnostic Microbiology and Infectious Disease xxx (2015) xxx–xxx
The aim of the present study was to compare sensitivity and specificity of 4 diagnostic methods: FEA, SSF, IFA, and real-time PCR (qPCR) for detection of G. duodenalis in clinical fecal samples. 2. Materials and methods The study followed the Standards for the Reporting of Diagnostic accuracy studies guidelines. Consecutive fecal samples (N = 455) received between August 2012 and April 2013 at Aarhus University Hospital, Denmark, were included. FEA was performed within 48 hours after receipt of the samples. The samples were kept at + 4 °C for up to 90 days prior to qPCR analysis. Due to time constraints, SSF was performed on only 269 samples of the 455 samples included in the study. 2.1. Serial dilution of G. duodenalis–positive samples Nineteen fecal samples, positive for Giardia spp. by FEA, were included in the study. From each sample, 2 g of feces was thoroughly mixed with 4-mL sterile water and diluted 1:1 (undiluted) 1:20, 1:100, 1:500, and from the undiluted sample, a 1:1000 dilution was made and further diluted, 1:5000 and 1:10,000 to minimize dilution errors. One milliliter of each dilution was used in FEA and SSF, 10 μL for IFA, and 1 mL was frozen at −80 °C before analysis by qPCR. 2.2. Formol ethylacetate From each dilution, 1 mL was thoroughly mixed by vortexing for 10 s with 7-mL 10% aqueous formaldehyde solution (VWR, Herlev, Denmark) before poured through gauze. The samples stood for at least 20 min at room temperature, and 3 mL of ethylacetate (Merck, Darmstadt, Germany) was added. After shaking vigorously for 45 s, the samples were spun 1 min at 1500 g and the supernatant was discarded. The pellet was left for a minimum of 30 min and resuspended in a final volume of 1 mL before examination. From each sample, 20 μL was added onto a glass slide and mixed with a droplet of approximately 20-μL iodide stain (Cowland-R, Ampliqon, Odense, Denmark), covered with a coverslip and examined by microscopy at ×400 magnification. Cysts in each sample were quantified once by 1 operator, and the number of cysts per gram feces (CPG) was calculated. 2.3. Salt/sugar flotation Briefly, 1 mL of feces dilution or 1 g of feces was concentrated as described elsewhere (Maddox-Hyttel et al., 2006), although the final volume was adjusted to 2 mL. The samples were analyzed as described for the FEA concentration method. Calculation of CPG for FEA and SSF was estimated from the number of cysts in the 20 μL subsample taken from the concentrated parasite sample and multiplied by 50.
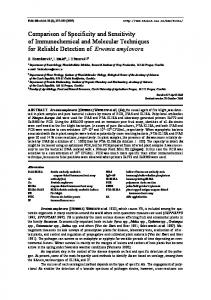
2.5. Real-time polymerase chain reaction 2.5.1. DNA isolation Forty-microliter liquid feces or approximately 50-mg solid feces was added to 750-μL STAR buffer (Roche Diagnostics, Basel, Switzerland). The material was mixed and left at room temperature for 10 min. The supernatant (500 μL) was added to a deep well plate with 20 μL of porcine herpersvirus (PhHV) (cultured and harvested in-house; the original culture derived from Prof Dr HGM Niesters, PhD, University Medical Center Groningen, Department of Medical Microbiology, Division of Clinical Virology Groningen, The Netherlands), corresponding to 3000 copies. The PhHV served as internal control, and the concentration of the PhHV was chosen to give a Cp value close to 30 after DNA purification in the absence of inhibitors. The Cp (crossing point-PCR-cycle) is the value given by the LightCycler 480 and is similar to Ct (cycle tresshold). It is the cycle at which fluorescence achieves a defined threshold. It corresponds to the cycle at which a statistically significant increase in fluorescence is first detected. DNA was purified on MagNA Pure 96 (Roche Diagnostics) using the MagNA Pure 96 DNA and Viral NA Large Volume kit (Roche Diagnostics) with a Pathogen Universal Protocol. DNA was eluted in final volume of 50 μL. 2.5.2. Amplification Previously published primers and probe for G. duodenalis were used (Verweij et al., 2004); the probe was labeled with Cy5 and BBQ (black berry quencher). Primers and probe (labeled with 6-Fam and BBQ) for Cryptosporidium spp. from Verweij et al. (2004) were present in the PCR mastermix, but very few positive samples were found and the results could therefore not be compared between the 4 methods due to lack of statistical power. Primers and probe for PhHV have been published elsewhere (Niesters, 2001). The probe was labeled with LC610 and BBQ as a quencher. Primers were obtained from Eurofins (Ebersberg, Germany) and probes from TIB MolBiol (Berlin, Germany). Amplification reactions were performed in 15-μL volumes containing 7.5-μL TaqMan® Fast Advanced Master Mix (Life Technologies, Naerum, Denmark), primers each at a concentration of 200 nmol/L, probe at concentration of 200 nmol/L, and 5 μL of purified DNA. Amplification reactions consisted of 10 min at 95 °C followed by 45 cycles of 1 s at 95 °C, 30 s at 60 °C. Amplification, detection, and data analysis were performed with the LightCycler 480II system (Roche, Mannheim, Germany). Fluorescence was measured during the extension/annealing step of each cycle. Inhibition by fecal inhibitors was considered if the Cp value of the PhHV internal control was either absent or more than 5 cycles above the expected value (Cp = 30). 2.5.3. Calculation of CPG by qPCR The number of cysts in the qPCR results was inferred from Fig. 1, which shows the correlation between the number of cycles required
2.4. Immunofluorescence assay
Correlation between IFA and qPCR results 45 40 35
Cp-values
Ten µl of diluted feces were taken after proper mixing, and a direct smear was made on Teflon coated slides containing 3 wells of 10 mm (Menzel Gläser; Thermo Scientific, Braunschweig, Germany). The smears were left to air dry at room temperature overnight. The samples were then fixed in acetone (Merck, Darmstadt, Germany) and stained with FITC-labeled anti-Giardia antibodies (Cellabs, Brookvale Australia) according to manufacturer's instructions. The slides were examined by fluorescence microscopy at ×400 magnification, and the number of Giardia cysts was counted per well.
30 25 20 y = -4.1664x + 40.163 R² = 0.7447
15 10 5 0 0
2.4.1. Calculation of CPG for IFA Ten microliters of feces was applied to each well on a slide as a direct smear. The number of cysts per well was multiplied by 100 to provide the CPG.
0.5
1
1.5
2
2.5
3
3.5
4
4.5
log10(number of cysts/10ul) Fig. 1. Correlation between results obtained by IFA (log10 of number of cysts per 10-μL sample) and Cp values obtained by quantitative real-time PCR of G. duodenalis in 455 fecal samples. Sensitivity is shown on the y-axis; and reciprocal dilution, on the x-axis.
Please cite this article as: Gotfred-Rasmussen H, et al, Comparison of sensitivity and specificity of 4 methods for detection of Giardia duodenalis in feces: immunofluorescence and PCR ar..., Diagn Microbiol Infect Dis (2015), http://dx.doi.org/10.1016/j.diagmicrobio.2015.11.005
H. Gotfred-Rasmussen et al. / Diagnostic Microbiology and Infectious Disease xxx (2015) xxx–xxx
3
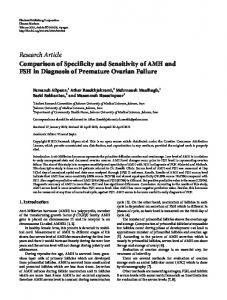
to generate a signal when analyzed by qPCR and the concomitant number of cysts found by IFA from the same diluted sample. 2.6. Statistical analysis G. duodenalis cysts per volume/gram feces were considered not to be normally distributed, and the results are therefore given as medians values and 25–75% range. The results of the dilution experiments were analyzed using a logistic regression model with and without the Bonferroni correction, with dilution factor as the x-variable after log10 transformation. As each sample was analyzed repeatedly (4 methods, 6 dilutions), the generalized estimation equation was used for adjustment. Confidence intervals on sensitivity, specificity, and predictive values were calculated as previously described (Mercaldo et al., 2007). 3. Results When comparing the 4 methods for diagnosis of G. duodenalis infections, qPCR and IFA showed the highest sensitivity. The 19 samples tested for G. duodenalis, undiluted and in serial dilutions up to 1:10,000, showed marked differences in performance comparing between the 4 methods. In the undiluted samples, the median number of G. duodenalis cysts found: by FEA 50 cysts per gram (25–75% percentile, 50–150), by SSF 350 cysts per gram (25–75% percentile, 200–500), by IFA 76,700 cysts per gram (25–75% percentile 56,800–122,100), and by qPCR 316,000 (see Table 1). The difference in detection thresholds was also reflected by the number of samples, which tested positive at each of the dilutions. At a dilution of 1:20, 3/ 19 tested positive with FEA, 7/19 tested positive with SSF, and 19/19 tested positive by IFA and qPCR. At dilution 1:100, 0, 1, 18, and 19 samples were positive by FEA, SSF, IFA, and qPCR, respectively (Table 1). Analysis of the 4 sensitivity curves with respect to interaction between method and dilution showed no interaction (logistic regression, P = 0.9) demonstrating parallel curves. Overall, the sensitivity curves of the 4 methods (Fig. 2) were not equal; P b 0.0001. Pairwise comparison of the 4 tests (after Bonferroni correction) showed no statistical difference between FEA and SSF (uncorrected P = 0.0485) or IFA and qPCR (uncorrected P = 0.2308). However, when comparing the FEA and SSF to IFA and qPCR, significant differences were found between FEA and IFA (P b 0.0001) and FEA and qPCR (P b 0.0001) which was also the case when comparing SSF to IFA and qPCR, respectively (P b 0.0001 in both cases). The number of cysts detected by qPCR was inferred by the correlation between the qPCR Cp and number of cysts counted by IFA (Fig. 1). The sensitivity of the 2 concentration methods followed by iodide staining and microscopy examination had declined to below 40% already at a dilution of 1:20 in comparison to the IFA and qPCR. In addition, the sensitivity remained between 40% and 50% at a dilution of 1:5000, compared with IFA and qPCR. We next tested 455 consecutive samples submitted from general practice for diagnosis of intestinal protozoa. Although the qPCR mix contained primers for detection of Cryptosporidium spp., only few samples were positive for Cryptosporidium spp., and therefore, these results were omitted from the statistical analysis.
Fig. 2. Observed sensitivity of the 4 diagnostics methods for each dilution step with bars indicating the 95% confidence intervals. The difference between SSF and FEA was not significant and neither was the difference between IFA and PCR. However, the difference between the concentration techniques: FEA or SSF compared to IFA or PCR showed a great difference (P b 0.0001).
Using IFA as reference, the qPCR had a sensitivity of 91% and a specificity of 95.1%; of the 455 samples, 42 were positive by qPCR of which 21 samples were also positive by IFA; see Table 2. When the IFA was compared to qPCR as reference method, we found that IFA had a sensitivity of 50% and a specificity of 99.5%; of the 455 samples, 23 were positive by IFA and 21 of these samples were also found positive by qPCR. Comparing FEA with qPCR as reference, the FEA had a sensitivity of 31% and a specificity of 100%; of the 455 samples, FEA found 13 samples positive and the 13 samples were also found positive by qPCR. For SSF, 269 samples were tested, and using qPCR as reference, 8 samples were found positive by SSF and by qPCR. 4. Discussion The 2 concentration methods FEA and SSF followed by direct microscopy performed poorly compared to the immunofluorescence-based method and qPCR. The median number of cysts, 50 cysts per gram detected by FEA, was approximately 1500 times lower than the 76,000 CPG found by the IFA and more than 6000 times lower than the 316,000 cysts per gram detected by qPCR. The SSF on the other hand detected around 900 times fewer cysts than the qPCR and approximately 200 times fewer cysts compared to the IFA. The differences cannot be attributed to a dilution error, while the samples analyzed were performed from the same starting sample, which after thorough mixing and dilution was divided into 4 samples used for analysis.
Table 1 Comparison of results obtained from the 4 methods, in the dilution trial.
FEA
SSF IFA qPCR
Percentage positive Positive/all Median ± 25–75% Positive/all Median ± 25–75% Positive/all Median ± 25–75% Positive/all Median ± 25–75%
1:1
1:20
1:100
1:1000
1:5000
1:10,000
100% 19/19 50 ± 0–150 79% 15/19 350 ± 200–500 100% 19/19 76,700 ± 56800–121,100 100% 19/19 316,200 ± 281,800–631,000
16% 3/19 0 37% 7/19 150 ± 100–150 100% 19/19 43,300 ± 21100–71,400 100% 19/19 31,600 ± 5000–39,800
0
0
0
0
0 5% 1/19 NA 95% 18/19 9400 ± 3700–16,900 100% 19/19 3500 ± 2200–10,000
0 0 0 84% 16/19 700 ± 400–2000 47% 9/19 1000 NA
0 0 0 47% 9/19 300 ± 200–500 32% 6/19 1000 NA
0 0 0 26% 5/19 100 (NA) 11% 2/19 1000 NA
Please cite this article as: Gotfred-Rasmussen H, et al, Comparison of sensitivity and specificity of 4 methods for detection of Giardia duodenalis in feces: immunofluorescence and PCR ar..., Diagn Microbiol Infect Dis (2015), http://dx.doi.org/10.1016/j.diagmicrobio.2015.11.005
4
H. Gotfred-Rasmussen et al. / Diagnostic Microbiology and Infectious Disease xxx (2015) xxx–xxx
Table 2 Sensitivity and specificity of FEA, SSF, IFA, and qPCR in 455 consecutive samples submitted from general practice. Test compared (95% confidence interval)
Sensitivity
Specificity
False-positive rate
False-negative rate
Positive predictive value
qPCR compared to IFA as the reference method IFA compared to qPCR as the reference method FEA compared to qPCR as the reference method SSF compared to qPCR as the reference method
91% (72–99%)
95.1% (93%-97%)
50% ND
0.48% ND
50% (34–66%)
99.5% (98–100%)
9% ND
4.8% ND
91.0% (71–98%)
95.1% (93–97%)
31% (18–47%)
100% (99–100%)
0% ND
6.6% ND
89% (63–97%)
93.1% (90–95%)
67% (35–90%)
100% (99–100%)
0% ND
1.6% ND
84% (52–96%)
99.2% (97–100%)
50% (35–65%)
Negative predictive value 99.5% (98.1–99.8%)
ND = not done.
Other studies have compared microscopy after concentration, to fluorescence labeling of monoclonal antibodies and PCR, respectively (Nazeer et al., 2013; Winiecka-Krusnell and Linder, 1995). In agreement with our data, these studies obtained sensitivities of both IFA and qPCR which were higher compared to the concentration techniques, iodide staining, and microscopy. In contrast, Schuurman et al. (2007) found qPCR, rapid immunoassay, and microscopy to be equally sensitive in a study that compared samples initially detected positive for G. duodenalis by microscopy. Additionally, they found qPCR to be less specific than the other methods due to failure to detect some “true positive” samples and probable cross-contamination of other samples. In our study, qPCR had a higher sensitivity compared with FEA, suggesting that samples detected positive by FEA will also be positive by qPCR. Although qPCR and rapid immunoassays are sensitive and fast, the methods are limited to detect only selected, specific parasites, whereas microscopical examination has the ability to simultaneously detect other gastrointestinal parasites present in the samples. Yet, a molecular screening approach may significantly increase the detection rate of those pathogens included in the test panel. This was shown, for example, by de Boer et al. (2010) who, in a study including 28,185 stool specimens, detected G. duodenalis in 4.7% of the specimens, and of these, only 58.1% were detected positive by microscopy. These results are in accordance with our study, which clearly demonstrated that concentration using FEA or SSF followed by iodine staining and microscopy had a detection level at least 1500-fold lower than immunofluorescence- and PCR-based techniques, and therefore, patients with low-level G. duodenalis infection would be missed by routine FEA or SSF methods. Currently, no “gold standard” test exists for detection of G. duodenalis. Thus, it is unknown whether the false-positive rate of 50% obtained by qPCR with IFA as reference reflects the truth or simply suggests a higher sensitivity of the molecular method. Nevertheless, our results based on serial dilution of 19 positive samples, initially found positive by FEA, did not document any statistical difference between IFA and qPCR. The confirmatory test needs to have similar sensitivity to avoid false-negative results in samples positive by qPCR, while Giardia spp. DNA can be detected several days post infection depending on the treatment (van den Bijllaardt et al., 2014). Therefore, we suggest, when using qPCR as first-line method, that positive samples should be verified by IFA to prevent false-positive results. In case the positive qPCR result is not verified by IFA staining of fecal smear, increased sensitivity may be achieved by preceding SSF concentration of the cysts before immunofluorescence. Acknowledgments The study was supported by Aarhus University Hospital and received no external funding. Dorthe Lind, Aase Rafn, and Annette Olesen are thanked for skillful technical assistance. The study was supported by the Departments of Infectious Diseases and Clinical Microbiology, Institute for Clinical Medicine, Aarhus University Hospital Skejby. The authors declare no conflicts of interests.
References Bartlett MS, Harper K, Smith N, Verbanac P, Smith JW. Comparative evaluation of a modified zinc sulfate flotation technique. J Clin Microbiol 1978;6:524–8. Bruijnesteijn van Coppenraet LE, Wallinga JA. Parasitological diagnosis combining an internally controlled real-time PCR assay for the detection of four protozoa in stool samples with a testing algorithm for microscopy. Clin Microbiol Infect 2009;15:869–74. de Boer RF, Ott A, Kesztyüs B, Kooistra-Smid AMD. Improved detection of five major gastrointestinal pathogens by use of a molecular screening approach. J Clin Microbiol 2010;48:4140–6. de Waal T. Advances in diagnosis of protozoan diseases. Vet Parasitol 2012;189:65–74. Erdman DD. Clinical comparison of ethyl acetate and diethyl ether in the formalin-ether sedimentation technique. J Clin Microbiol 1981;14:483. Faust EC, D'Antoni JS, Odom V. A critical study of clinical laboratory technics for the diagnosis of protozoan cysts and helminth eggs in feces. Am J Trop Med Hyg 1938;18: 169–83. Fletcher SM, Stark D, Harkness J, Ellis J. Enteric protozoa in the developed world: a public health perspective. Clin Microbiol Rev 2012;25:420–49. Garcia LS, Shum AC, Bruckner DA. Evaluation of a new monoclonal antibody combination reagent for direct fluorescence detection of Giardia cysts and Cryptosporidium oocysts in human fecal specimens. J Clin Microbiol 1992;30:3255–7. Maddox-Hyttel C, Langkjær RB, Enemark HL, Vigre H. Cryptosporidium and Giardia in different age groups of Danish cattle and pigs—Occurrence and management associated risk factors. Vet Parasitol 2006;141:48–59. Mary C, Chapey E, Dutoit E, Guyot K, Hasseine L, Jeddi F, et al. ANOFEL Cryptosporidium National Network. Multicentric evaluation of a new real-time PCR assay for quantification of Cryptosporidium spp. and identification of Cryptosporidium parvum and Cryptosporidium hominis. J Clin Microbiol 2013;51:2556–63. Mercaldo ND, Lau KF, Zhou XH. Confidence intervals for predictive values with an emphasis to case–control studies. Stat Med 2007;26:2170–83. Muhsen K, Levine MM. A systematic review and meta-analysis of the association between Giardia lamblia and endemic pediatric diarrhea in developing countries. Clin Infect Dis 2012;55(Suppl. 4):S271–93. Nazeer JT, Khalifa KES, von Thien H, El-Sibaei MM, Abdel-Hamid MY, Tawfik RA, et al. Use of multiplex real-time PCR for detection of common diarrhea causing protozoan parasites in Egypt. Parasitol Res 2013;112:595–601. Niesters HG. Quantitation of viral load using real-time amplification techniques. Methods 2001;25:419–29. Ritchie LS. An ether sedimentation technique for routine stool examinations. Bull US Army Med Dep 1948;8:326. Ritchie LS, Pan C, Hunter GW. A comparison of the zinc sulfate and the MGL (Formalin-ether) technics. J Parasitol 1952;38(Suppl. 4):16. Rose JB, Landeen LK, Riley KR, Gerba CP. Evaluation of immunofluorescence techniques for detection of Cryptosporidium oocysts and Giardia cysts from environmental samples. Appl Environ Microbiol 1989;55:3189–96. Sawitz WG, Faust EC. The probability of detecting intestinal protozoa by successive stool examinations. Am J Trop Med Hyg 1941;22:131–6. Schuurman T, Lankamp P, van Belkum A, Kooistra-Smid M, van Zwet A. Comparison of microscopy, real-time PCR and a rapid immunoassay for the detection of Giardia lamblia in human stool specimens. Clin Microbiol Infect 2007;13:1186–91. Stensvold R, Nielsen HV. Comparison of microscopy and PCR for the detection of intestinal parasites in Danish patients supports incentive for molecular screening platforms. J Clin Microbiol 2012;50:540–1. van den Bijllaardt W, Overdevest IT, Buiting AG, Verweij JJ. Rapid clearance of Giardia lamblia DNA from the gut after successful treatment. Clin Microbiol Infect 2014;20: O972–4. van Lieshout L, Roestenberg M. Clinical consequences of new diagnostic tools for intestinal parasites. Clin Microbiol Infect 2015;21:520–8. Verweij JJ, Blangé RA, Templeton K, Schinkel J, Brienen EAT, van Rooyen MAA, et al. Simultaneous detection of Entamoeba histolytica, Giardia lamblia, and Cryptosporidium parvum in fecal samples by using multiplex real-time PCR. J Clin Microbiol 2004;42: 1220–3. Winiecka-Krusnell J, Linder E. Detection of Giardia lamblia cysts in stool samples by immunofluorescence using monoclonal antibody. Eur J Clin Microbiol Infect Dis 1995; 14:218–22.
Please cite this article as: Gotfred-Rasmussen H, et al, Comparison of sensitivity and specificity of 4 methods for detection of Giardia duodenalis in feces: immunofluorescence and PCR ar..., Diagn Microbiol Infect Dis (2015), http://dx.doi.org/10.1016/j.diagmicrobio.2015.11.005