MEDINFO 2001 V. Patel et al. (Eds) Amsterdam: IOS Press © 2001 IMIA. All rights reserved
Comparison of Three Databases with a Decision Tree Approach in the Medical Field of Acute Appendicitis Milan Zormana, Hans-Peter Eichb, Peter Kokola, Christian Ohmannb a
Laboratory for System Design, Faculty of Electrical Engineering and Computer Science, University of Maribor, Slovenia b Theoretical Surgery Unit, Dept. of General and Trauma Surgery, Heinrich-Heine University Düsseldorf, Germany
they have been successfully used in many medical decision making applications. Transparent representation of acquired knowledge and fast algorithms made decision trees what they are today: one of the most often used symbolic machine learning approaches [1]. Decision trees have been already successfully used in medicine, but as in traditional statistics, some hard real world problems can not be solved successfully using the traditional way of induction [2]. One of the hardest problems is the diagnostic of the acute appendicitis (AAP), which is a special problem of acute abdominal pain. The early and accurate diagnosis of acute appendicitis is still a difficult and challenging problem in everyday clinical routine. Of major concern are the perforation rate (up to 20%) and negative appendectomy rate (up to 30%) [3,4]. An important factor in the error rate is poor discrimination between acute appendicitis and other diseases that cause acute abdominal pain. This error rate is still high, despite considerable improvements in historytaking and clinical examination, computer-aided decisionsupport and special investigation, such as ultrasound. Different types of automatic knowledge acquisition tools like decision trees [5] and neural networks [6] were already evaluated on databases with cases of acute abdominal pain. This clinical problem seems to be well suited for inductive learning systems, since a standardized terminology has been defined. Agreed definitions, criteria and minimum data sets have been laid down by the World Organization of Gastroenterology [7]. This paper concentrates on the problem of separating acute appendicitis from other diseases that cause acute abdominal pain by use of an improved decision tree approach. In addition three different large databases with cases of acute abdominal pain have been investigated to find out the influence of different database characteristics like size, prevalence of appendicitis, reliability of data collection, etc., to the accuracy of decision support tools.
Abstract Decision trees have been successfully used for years in many medical decision making applications. Transparent representation of acquired knowledge and fast algorithms made decision trees one of the most often used symbolic machine learning approaches. This paper concentrates on the problem of separating acute appendicitis, which is a special problem of acute abdominal pain from other diseases that cause acute abdominal pain by use of an decision tree approach. Early and accurate diagnosing of acute appendicitis is still a difficult and challenging problem in everyday clinical routine. An important factor in the error rate is poor discrimination between acute appendicitis and other diseases that cause acute abdominal pain. This error rate is still high, despite considerable improvements in history-taking and clinical examination, computer-aided decision-support and special investigation, such as ultrasound. We investigated three different large databases with cases of acute abdominal pain to complete this task as successful as possible. The results show that the size of the database does not necessary directly influence the success of the decision tree built on it. Surprisingly we got the best results from the decision trees built on the smallest and the biggest database, where the database with medium size (relative to the other two) was not so successful. Despite that we were able to produce decision tree classifiers that were capable of producing correct decisions on test data sets with accuracy up to 84%, sensitivity to acute appendicitis up to 90%, and specificity up to 80% on the same test set. Keywords: Acute Appendicitis; Decision Trees; Acute Abdominal Pain; Machine Learning; Medical Informatics
Introduction
Methods
Decision support systems that help physicians are becoming a very important part of medical decision making. They are based on different models and the best of them are providing an explanation together with an accurate, reliable and quick response. One of the most popular among machine learning approaches are decision trees. For years
Decision trees A decision tree [8,9] is a formalism for expressing mappings from attribute values to classes (predictions) and consists of tests or attribute nodes linked to two or more
1414
Chapter 16: Data Systems
subtrees and leafs or decision nodes labelled with a class which represents the decision. Because of the very simple representation of accumulated knowledge they also give us the explanation of the decision, and that is essential in medical applications. The tool we used is called MtDeciT2.0. It basically follows the same principles as many other decision tree building tools, but it also implements different extensions [10,11]. One of those extensions is called dynamic discretization of continuous attributes, which was used in our experiments with success.
Data collection To compare the databases we concentrated on 18 parameters from history-taking and clinical examination, which could be identified in all three databases. Only clinical parameters with a missing value rate of less than 10% were included. Since we were focusing on the problem of separating acute appendicitis (class: “appendicitis”) from other diseases that cause acute abdominal pain, these other diagnoses fall into one common class (class: “other diseases”). The clinical parameters in the investigation are: sex, age, progress of pain, duration of pain, type of pain, severity of pain, location of pain now, location of pain at onset, previously similar complains, previous abdominal operation on appendix, distended abdomen, tenderness, severity of tenderness, movement of abdominal wall, rigidity, rectal tenderness, rebound tenderness, leukocytes.
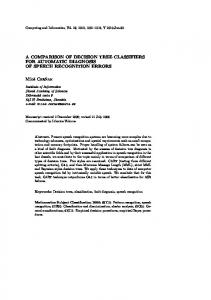
Dynamic discretization of continuous attributes Because of the nature of decision trees, all numeric attributes must be mapped into a set of discrete values. In MtDeciT 2.0 tool we implemented an algorithm for finding subintervals [11], where we consider the distribution of training objects and there are more than two subintervals possible. The approach is called dynamic discretization of continuous attributes, since the subintervals are determined dynamically during the process of building the decision tree. This technique first splits the interval into many subintervals, so that every training object’s value has its own subinterval. In the second step it merges together smaller subintervals that are labelled with the same outcome into larger subintervals (see Figure 1). In comparison to other approaches the dynamic discretization returns more ‘natural’ subintervals, which results in better and smaller decision trees.
Databases of acute abdominal pain 1. AAP I (n = 1254): This prospective clinical data base of AAP was built-up in the framework of a Concerted Action of the European Community (COMAC-BMEEuropean Community Concerted Action on Objective Medical Decision Making in Patients with Acute Abdominal Pain; project leader: F. T. de Dombal (Leeds, UK) [12]. The data came from six surgical departments in Germany, which participated in the study. Included in the study were all patients with acute abdominal pain of less than one week duration. A structured and standardized history and clinical examination were performed in every patient and the data were documented prospectively using a form suitable for computer use. This form was based on the original abdominal pain chart of the World Organization of Gastroenterology (OMGE). Terminology and definitions were taken from the European Community Concerted Action [12]. Final diagnosis was based on operative findings, special investigations and the course of the disease during hospital stay. In cases of patients with non-specific abdominal pain, data from readmission and telephone interviews were used. The prevalence of appendicitis in this database is 16.8 % (n = 211). 2. AAP II (n = 2286): This prospective database was builtup during the German MEDWIS project A70 “Expert system for acute abdominal pain”, project leader: C. Ohmann [13]. Data came from 14 centres in Germany. Included in the study were all patients with acute abdominal pain of less than one week duration. For data collection a computer program with revised and enhanced forms of [12] was used. The final diagnosis was based on diagnosis at discharge. The prevalence of appendicitis in this database is 22.7 % (n = 519). This data set contained a lot of special (more complicated) cases, where patients were sent from ordinary hospitals for treatment in the university hospitals.
Figure 1. Dynamic discretization of a continuous attribute, which has values between 60 and 100. In general we differentiate between two types of dynamic discretization: •
General dynamic discretization, and
• Nodal dynamic discretization. General dynamic discretization uses all available training objects for the definition of subintervals. That is why we perform the general dynamic discretization before we start building the decision tree. All the subintervals of all attributes are memorised in order to be used later in the process of building of the decision tree. Nodal dynamic discretization performs the definition of subintervals for all continuous attributes that are available in the current node of the decision tree. Only those training objects, that came in the current node are used for setting the subintervals of the continuous attributes.
3. AAP III (n = 4020): This prospective database was built-up during an Concerted Action funded by the European Commission during the COPERNICUS programme no.: 555 (project leader: C. Ohmann): “Information Technology for the Quality Assurance in
1415
Chapter 16: Data Systems
set') was the remaining 1/3 of the 'cleaned data set'. That meant that we did not have the approximate 50:50 ratio of the appendicitis and other diagnoses in the test set. The same was true for the second test set, which was actually a 'cleaned data set' (marked in Table 1 as 'Full set'). The number of test objects in 'test sets' was 414 for AAP I (74 classified as appendicitis, 340 classified as other diagnoses), 731 for AAP II (156 classified as appendicitis, 575 classified as other diagnoses), and 1340 for AAP III (542 classified as appendicitis, 798 classified as other diagnoses). The number of test objects in 'full sets' was 1251 for AAP I (211 classified as appendicitis, 1040 classified as other diagnoses), 2279 for AAP II (519 classified as appendicitis, 1760 classified as other diagnoses), and 4020 for AAP III (1628 classified as appendicitis, 2329 classified as other diagnoses).
Acute Abdominal Pain”. Data was collected in 16 centres from Central and Eastern Europe. For data collection the computer program developed in the MEDWIS programme was used. Medical terminology was translated into 10 different languages, so that the participating centres could be provided with national versions of the software [14]. The final diagnosis was based on the diagnosis at discharge. The prevalence of appendicitis in this database is 40.5% (n = 1628). In all three databases we additionally filtered out the cases (objects) for which more than 90% of parameters were not known. As a result of this action, the number of cases in the AAP I reduced for 3 objects (from 1254 to 1251), the number of cases in the AAP II reduced for 7 cases (from 2286 to 2279), and the number of cases in the AAP III remained the same. Training sets
Results
For the training purposes we decided not to use training objects with more than 10 missing values. By that we did our best to increase the quality of knowledge stored in the decision trees. Let us call the data sets which contained objects with no more than 10 missing values the 'cleaned data sets'. During our preliminary tests we found out that the percentage of appendicitis cases in all three data sets was substantially lower than 50% and therefore influenced the decision trees in such way that they learned more about the other diseases than about appendicitis. In order to improve the power of classifiers we reduced the number of objects in the sets by removing the objects classified as 'other diagnosis' that had the most missing values. Let us call such data sets the reduced data sets. For each data set we built two training sets: For the first training set (marked as 'Training set 50:50' in Table 1) we took approximately 2/3 of the 'cleaned data set'. The remaining 1/3 of the data set was saved for the testing purposes as the test set. Then we reduced the 2/3 training set, so it contained approximately the same number of appendicitis cases and cases marked as other diagnosis. The second training set was our reduced data set (marked as 'Full set 50:50' in the Table1) – the original data set with an approximate ratio of 1/2 of objects classified as appendicitis cases and the other half classified as other diagnoses. The number of training objects in 'training sets 50:50' was 274 for AAP I (137 classified as appendicitis, 137 classified as other diagnoses), 763 for AAP II (363 classified as appendicitis, 400 classified as other diagnoses), and 2186 for AAP III (1086 classified as appendicitis, 1100 classified as other diagnoses). The number of training objects in 'full sets 50:50' was 422 for AAP I (211 classified as appendicitis, 211 classified as other diagnoses), 1119 for AAP II (519 classified as appendicitis, 600 classified as other diagnoses), and 3330 for AAP III (1628 classified as appendicitis, 1702 classified as other diagnoses).
For each AAP data set we built two types of decision trees: one for each type of training set. We tested each of those decision trees on each possible test set, except on its own full set (for decision trees built on training set) and its own full and testing set (for decision trees built on reduced data set). Reason for latter was that training sets contained also a few objects, that were in the test sets and the results would not be objective. In the table 1 you can see the best results for each type of the decision tree on each data set. Each part of table 1 at intersection between the training and test set contains cells with the following data: number of nodes in the decision tree, settings for the decision tree (prepruning percentage, type of discretization technique), sensitivity to appendicitis and specificity. Types of discretization techniques used in table 1 are quartiles (Q) and dynamic discretization in the current node with different settings (DC40-2) [11]. From the results of comparison of different data sets we can see that the best average accuracy has been achieved by the decision tree, built on the small reduced data set AAP I (marked as 'Full set 50:50'), followed closely by the decision trees built on the large AAP III data set, which is more of a surprise to us.
Discussion By knowing the background and methods used to collect those three data sets, we did not expect the decision trees built on medium data set AAP II to stand out in such a negative sense. The worse results were achieved on AAP II test sets and with the decision trees, that were built on the training sets of AAP II data set. The only reasons for that which arise at the moment is that AAP II contains a large number of special cases and that the decision tree learning method does not exploit the training set as it should. The overall accuracy of the remaining comparisons between AAP I and AAP III is so high that some of those decision trees could be of a practical use to clinicians. The accuracy we achieved during our experiments is substantially higher than the accuracy other authors
Test sets Similar as for training sets, we also built two test sets for each data set. The first test set (marked in Table 1 as 'Test
1416
Chapter 16: Data Systems
[8] J. R. Quinlan: C4.5: Programs for machine learning. Morgan Kaufmann publishers, San Mateo, CA, 1993.
reported on approaches like neural networks [15] or case based reasoning [16]. Nevertheless the overall results are good and the impression that even more knowledge can be extracted from the three data sets makes us plan new experiments with different training set combination and different machine learning approaches.
[9] Stuart J. Russel, Peter Norvig, et al.: Artificial intelligence: a modern approach. Englewood cliffs, Prentice-Hall (1995): 525-562. [10] Zorman Milan, Hleb Špela, Šprogar Matej: Advanced tool for building decision trees MtDeciT 2.0. In: Kokol Peter (ed.), Welzer-Družovec Tatjana (ed.), Arabnia Hamid R. (ed.). International conference on artificial intelligence, June 28 - July 1, 1999, Las Vegas, Nevada, USA. Las Vegas: CSREA, (1999), book. 1: 315-318.
Conclusion The presented results show that we are on the right way to solve the acute appendicitis problem with the use of machine learning techniques, but many problems still remain to be solved. Currently we are testing improved machine learning methods like genetic decision trees and hybrid neural decision trees on all three AAP databases and preliminary results seem to be even a bit better than results presented in this paper.
[11] Zorman Milan, Kokol Peter. Dynamic discretization of continuous attributes for building decision trees. In: Fyfe C. (ed.). Proceedings of the second ICSC symposium on engineering of intelligent systems, June 27-30, 2000, University of Paisley, Scotland, U.K. : EIS 2000. Wetaskiwin; Zürich: ICSC Academic Press, (2000): 252-257.
Acknowledgements The work was supported in the framework of a bilateral scientific-technological cooperation between Slovenia (Ministry of Science and Technology, Project No.: L21640-0796-99) and Germany (Deutsches Zentrum für Luftund Raumfahrt e.V., Project No.: SVN 99 / 022).
[12] F. T. de Dombal, H. de Baere, P. J. van Elk, A. Fingerhut, J. Henriques, S. M. Lavelle, G. Malizia, C. Ohmann, C. Pera, H. Sitter and D. Tsiftsis: Objective medical decision making in acute abdoinal pain, In: J. E. W. Benken and V. Thevin (Eds.): Advances in Biomedical Engineering, IOS Press, (1993) 65-87.
References
[13] Ohmann C, Platen C, Belenky G, Franke C, Otterbeck R, Lang K et al.: Expertensystem zur Unterstützung von Diagnosestellung und Therapiewahl bei akuten Bauchschmerzen. Informatik, Biometrie und Epidemiologie in Medizin und Biologie 1995; 26(3): 262-274.
[1] Tom af Klercker: Effect of Pruning of a Decision-Tree for the Ear, Nose and Throat Realm in Primary Health Care Based on Case-Notes. Journal of Medical Systems, vol. 20, no. 4 (1996): 215-226. [2] Milan Zorman, Vili Podgorelec, Peter Kokol, Margaret Peterson, Joseph Lane: Decision tree's induction strategies evaluated on a hard real world problem. In: 13th IEEE symposium on computer-based medical systems 22-24 June 2000, Houston, Texas, USA : proceedings, Los Alamitos, IEEE Computer society (2000): 19-24.
[14] C. Ohmann, H. P. Eich, H. Sippel: A data dictionary approach to multilingual documentation and decision support for the diagnosis of acute abdominal pain (COPERNICUS 555, An European Concerted Action). Medinfo 1998 9(Pt 1): 462-466. [15] E. Pesonen, C. Ohmann, M. Eskelinen, M. Juhola: Increasing the accuracy of the acute appendicitis of a LVQ neural network by the use of larger neighbourhoods. Methods of Information in Medicine 37(1) (1996): 59-63.
[3] R. E. Andersson, A. Hungander, J. G. Thulin: Diagnostic accuracy and perforation rate in appendicitis: association with age and sex of the patient and with appendectomy rate. European Journal of Surgery (1992) 158: 37–41. [4] P. J. Blind, S. T. Dahlgren: The continuing challenge of the negative appendix. Acta Chir. Scand. (1986) 152: 623-627.
[16] B. Puppe, C. Ohmann, K. Goos, F. Puppe, O. Mootz: Evaluating four diagnostic methods with acute abdominal pain cases. Methods of Information in Medicine 34 (1995): 361-368.
[5] C. Ohmann, V. Moustakis, Q. Yang, K. Lang: Evaluation of automatic knowledge acquisition techniques in the diagnosis of acute abdominal pain. Artificial Intelligence in Medicine 8 (1996): 23-36.
Address for correspondence Milan Zorman, Laboratory for System Design, Faculty of Electrical Engineering and Computer Science, University of Maribor, Smeatnova 17, SI-2000 Maribor, Slovenia E-mail:
[email protected]
[6] E. Pesonen, M. Eskelinen, M. Juhola: Comparison of different neural network algorithms in the diagnosis of acute appendicitis, International Journal of BioMedical Computing, (1996) 40: 227-233. [7] F. T. de Dombal: Diagnosis of Acute Abdominal Pain, Churchhill Livingstone, Edinburgh, (1991) 105-106.
1417
Chapter 16: Data Systems
Table 1. Results of the comparison of different decision trees on different test sets Cell map Size of the Settings for the decision tree decision tree Overall accuracy Sensitivity to Specificity Appendicitis
TEST SETS LARGE (AAP III) Test Set Full Set
69 Nodes
25%DC40-2
69 Nodes
25%DC40-2
69 Nodes
25%DC40-2
69 Nodes
25%DC40-2
69 Nodes
25%DC40-2
73.67% 74.32%
73.53%
56.77% 42.95%
60.52%
54.76% 39.11%
59.38%
75.52% 65.87%
82.08%
75.67% 64.99%
82.94%
23 Nodes
30%DC40-2
23 Nodes
30%DC40-2
23 Nodes
30%DC40-2
23 Nodes
30%DC40-2
55.81% 49.36%
57.57%
52.87% 42.77%
55.85%
82.31% 82.29%
82.33%
81.99% 81.88%
82.07%
Training Set-50:50
464 Nodes 30%Q
47 Nodes
40%DC40-2
464 Nodes 30%Q
464 Nodes 30%Q
42.75% 43.24%
42.65%
43.73% 38.86%
52.39% 51.28%
52.70%
46.79% 39.30%
43.73% 36.12%
162 Nodes
40%DC40-2
162 Nodes 40%DC40-2
162 Nodes 40%DC40-2
162 Nodes 40%DC40-2
68.84% 54.05%
72.06%
69.30% 44.08%
74.42%
56.79% 32.84%
73.06%
55.47% 31.27%
48 Nodes
40%DC40-2
48 Nodes
40%DC40-2
48 Nodes
40%DC40-2
Training Set-50:50
30%Q
Full Set 50:50
Full Set 50:50
Training Set-50:50
MEDIUM (AAP II) Test Set Full Set
464 Nodes
Full Set 50:50
MEDIUM (AAP II) LARGE (AAP III)
TRAINING SETS
SMALL (AAP I)
SMALL (AAP I) Test Set Full Set
64.73%
44.71%
63.39%
48 Nodes
40%DC40-2
53.21%
48 Nodes
40%DC40-2
50.59%
83.81%
86.49%
60.0%
88.63%
58.27%
52.56%
53.39%
45.86%
51.99%
43 Nodes
40%DC40-2
43 Nodes
40%DC40-2
43 Nodes
40%DC40-2
43 Nodes
40%DC40-2
66.67% 86.49%
62.35%
65.87% 88.15%
61.35%
54.17% 51.92%
54.78%
51.73% 45.09%
53.69%
1418
51.88%
89.48%
79.95%
48.91%
71.95%