Maize Yield and Physical-Chemical Fertility Mapping for the Management of the Soil P. Servadio1, S. Bergonzoli1, D. Dell’Unto1, C. Beni2 1
Agricultural Research Council - Agricultural Engineering Research Unit (CRA-ING), Rome, Italy,
[email protected]
1
Agricultural Research Council - Agricultural Engineering Research Unit (CRA-ING), Rome, Italy,
[email protected] 1
Agricultural Research Council - Agricultural Engineering Research Unit (CRA-ING), Rome, Italy,
[email protected] 2
Agricultural Research Council – Soil-Plant System Research Center (CRA-RPS), Rome, Italy,
[email protected]
Abstract The purposes of this study were: first, to evaluate the traffic effects on soil qualities of a work site layout composed by a forage harvester with maize attachment and a truck for unloading and transportation of the harvested maize; second, to manage the fertilisation with precision farming techniques, after the characterisation of the top soil fertility. Field tests were carried out in a farm near Rome: immediately after harvesting operations, the above mentioned effects were quantified through variation of some soil physical parameters: penetration resistance, dry bulk density and shear strength. These parameters were determined on the tracks left by the harvester machine and by the truck that flanked the harvester machine after the passage and on soil not interested by the passes (Control). The soil chemical properties, considered on a grid basis were: pH, soil particle size, total nitrogen, available phosphorous, cation exchange capability, exchangeable potassium and organic matter content. The effects of the different variables on production were analysed and interpreted with the purpose to relate them with the yield variability. Penetration resistance in the different layers (0-40 cm depth), after the single passage of the harvester machine and the truck, showed statistically significant increases respect to the control. Even shear strength revealed an elevated degree of soil compaction after the passage of the harvester machine and the truck. This trend is also due to the elevated value of the soil moisture content. The chemical fertility analysis and its mapping analysed together to the yield map has allowed to program the most suitable fertilising plan aimed at keeping the crop productivity level, the environmental protection and increase of economic benefits for the farmers. A decreasing of fertilisation costs was proved for each hectare; moreover a reduction in the environmental impact due to a low chemical fertilisers administration, occurs.
Keywords: physical-chemical soil parameters, harvester machine, fertilisation, maize yield, precision agriculture.
Introduction Setting the administration of fertilization is one of the most important problems in farm management. Precision farming permits the adjustment of farming practices (i.e. input application rates) to optimize the production conditions, such as soil nutrient level or other aspects of soil functional quality. Determining the sample grid and the extent of variability is essential, not only at the subfield levels. Optimal sampling depends on trade-offs between potential saving in input expenditures, potential gains from increased yields due to improved management, and sampling costs (Marsili et al., 2000). Precision agriculture is based on the concept of soil-specific management, which aims to adapt management within a field according to specific site conditions in order to maximise production and minimise environmental damage (Pierce and Nowak, 1999). The intent of site-specific nutrient management is to level as much as possible spatial variability, by managing fertiliser applications to achieve maximum yield in the limits imposed by the unchangeable characteristics of each given site. The concepts included in precision agriculture offer the promise of increasing productivity while decreasing production costs and energy input and minimizing environmental impact. Although many of the technologies making up precision agriculture are relatively mature (i.e. GPS, GIS and remote sensing), it is still possible to improve many of those ones directly related to agricultural applications. One of the most important of these is the development of local sensors that can be used to determine crop and soil conditions, weed concentrations, presence of insects, and other variables important for crop growth (Escolà et al., 2009). 1.
Materials and Methods
Vol(1)
Journal of Information Technology in Agriculture
1
Field tests were carried out in a farm near Rome (41°52’502’’ Latitude (N); 12°12’866” Longitude (E)) during harvesting operations using a forage harvester with maize attachment and a truck for unloading and transportation of the harvested maize equipped with: board information system, speed recorder, harvested area measuring, volumetric grain flow sensor, moisture sensor. The aim of the tests were: firstly, to manage the fertilization with precision farming techniques through the characterization of the top soil fertility by means of the determination of spatial variability of the crop yield and of the soil physical and chemical characteristics; and second to evaluate the traffic effects on soil qualities of a work site layout composed by a forage harvester with maize attachment and a truck for unloading and transportation of the harvested product.
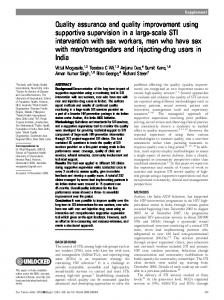
Figure 1. View of the operating forage harvester with maize attachment and the truck working alongside. For the first purpose these parameters (maize yield, soil chemical properties) were determined considering a grid basis (10 x 20 m). The soil samples were collected (from 0 to 0.30 m of depth) to determine chemical properties, such as pH (in H2O), total nitrogen (%), Olsen phosphorous (P 2O5 mg kg-1), exchangeable potassium (K2O mg kg-1), total organic carbon (g kg-1) and organic matter content (%). For the second purpose, penetration resistance, was determined on the tracks left by the harvester machine and by the truck that flanked the harvester machine after the passage, and on soil not interested by the passes (control); this parameter was determined according to the official method of soil chemical and physical analysis and subsequently mapped out in relation to its space distribution. Forage harvester with maize attachment Engine power (kW) Type of Transmission Mass (kg)
370 (at 1800 r.p.m.) Hydrostatic-mechanics 11140
Type of tires:
Front
Rear
Identification initials Rolling radius (m) Section of tire (maximum width) (m) Lugs (n.) Shore A (°) Load on the two tires (kN) Total contact area of the two tires on firm soil (m2) a
30.5 LR 32 0.807 0.765 38 65 71.03
540/65 R 24 0.575 0.533 38 62 38.25
0.833
0.420
Theoretical ground contact pressure (kPa) 85 Inflation pressure (kPa) 90 Vol(1) Journal of Information Technology in Agriculture
91 90 2
a
2.
Table 1. Main technical characteristics of the harvester machine. total contact area of the two tires on firm soil (Ta) was estimated as follows: Ta = St x 0.3 x Ed x 2 - where: St = Section of tire; Ed = External diameter. Results and discussion
A spatial representation of the maize yield values (t ha -1) (Swain, 2009) recorded by the board computer are shown in figure 2. The map was obtained firstly by data interpolation using the Kriging method and the representation was given using wireframe map with tridimensional view.
t ha -1 14.14 – 14.23
14.23 – 14.32 14.33 – 14.42 14.42 – 14.51
14.51 – 14.60
Figure 2. Spatial representation of the maize yield values (variation of East Longitude on the left and variation of North Latitude on the right). 2.1. Soil fertility parameters The results from the soil chemical and physical analyses (, and C.V.) from 0 to 0.30 m depth, have been reported in table 2. The top-soil (0-30 cm) was characterized on average by sub acid reaction, sandy-clay texture and a huge endowment of the main fertilizing elements (mainly for Phosphorous and Potassium), as a result of conspicuous distributions of chemical fertilizers and organic manuring. In particular, it was noticed that a phosphate fertilization, due to the soil average endowment equal to 297.0 mg kg -1 of P2O5, is not necessary and the same is for the potassium manuring in fact the average endowment of the soil is 643.3 mg kg-1 of K2O. For both nutrients the quantities in the soil are significantly above the normal endowment, needed for the optimal growth of the crops; so in the following maps, also areas belonging to the red color, that means lower values, are two or three times higher the normal endowment. This actual condition is attributable to the wrong management of the fertilization in the last years. Probably this is due to the big livestock holding of this farm that obliges distribution of organic manure every year all over the fields.
Vol(1)
Journal of Information Technology in Agriculture
3
Particle size distributions a: sand (2000 - 50 m) (g kg-1)
600
silt (50 – 2 m)
130
clay (< 2 m)
-1
(g kg ) -1
270
(g kg )
-3
Dry bulk density (Mg m ) pH (in H2O), Cation Exchange Capacity (meq 100g-1) Total nitrogen (%) Olsen phosphorous (P2O5 mg kg-1) Exchangeable potassium (K2O mg kg-1) Organic matter (%)
1.2 6.6 29.75 0.18 297.0 643.3 2.8
0.07 0.2 1.01 0.01 113.3 93.3 0.2
C.V. (%) 6.0 2.3 3.4 5.6 38.2 14.5 7.8
Table 2. Some physical chemical properties of the soil used during the test. a (from 0 to 0.10 m depth) Regarding nitrogen fertilization a simple manuring balance to avoid excesses has been calculated: an overabundance of nitrogen means an economic waste of fertilizers and the possibility of losses that are negative for the environment, indeed leaching can contaminate aquifers. To evaluate the right amount of nitrogen fertilizer to be distributed to the soil, it is necessary to consider all the forms that are acquired and which ones are naturally removed (Long et al., 2000). The balance for managing the distribution of the nitrogen fertilizer, is the following: Na = [(u Q) - Nava - Nmin - Norg - Natm - Nres + Nlea + Nimm] Na u Q Nava Nmin Norg Natm Nres Nlea Nimm
(1)
nitrogen amount (kg ha-1). yield unit uptake (6.5 kg t-1 of forage). forage obtained in the preceding year (t ha-1). soil available nitrogen (kg ha-1) equal to 1% of total nitrogen amount. 1.75 g kg-1 x 10000 m2 x 0.3 m x 1400 kg m-3 x 0.001 x 0.01 = 73.5 kg ha-1 = mineralized nitrogen (kg ha-1), varying in relation with the content of organic matter and texture (88 kg ha -1) = organic nitrogen derived by the organic manuring and assessed in to 70.0 kg ha -1. = atmospheric nitrogen fall out, supposed equal to 5.0 kg ha -1, taking into account the area climate and the ….proximity to industrial centers. = residual nitrogen derived from the mineralization of the preceding year, estimated in to 20 kg ha-1. = nitrogen leached along the profile equal to 15.0 kg ha-1, related to the pedoclimatic characteristics. = nitrogen immobilized by soil microorganisms, during the organic transformation of plant residues, ….estimated in to 12.5 kg ha-1. = = = =
The nitrogen balance indicates that an amount of N fertilizer equal to 50.4 kg ha -1 is needed on the average. In general, considering a plan for integrated enrichment, taking into account space variability of the macronutrients, it emerges that on the studied area the optimal administration is: 50.4 kg of N per hectare, 0 kg of P 2O5 and 0 kg of K2O, against the amount normally spread on the area (200 kg ha -1 of nitrogen; 100 kg ha-1 of P2O5 and 100 kg ha-1 of K2O). In order to obtain the total required nitrogen quantity, the whole area has been divided into five sub-areas with the same yield range. Moreover the balance of each sub-area was calculated by considering the percentage relevance respect to the total area, then the sum of all the values has been estimated. Such balance offers an appreciable economic benefit (Wagner, 2009). In fact considering the fertilizer unit prices, equal to 0.65 € for N, 0.67 € for P2O5 and 0.58 € for K2O, a total cost of 32.76 € ha-1 is reached using the precision farming techniques, compared to the 255.00 € ha-1 necessary for the conventional agricultural practices.
Vol(1)
Journal of Information Technology in Agriculture
4
g kg-1
1.61 – 1.66 1.66 – 1.72
1.72 – 1.78 1.78 – 1.84
1.84– 1.89
Figure 3. Spatial representation of the total Nitrogen amounts values in the upper layers (0-30 cm depth).
mg kg -1 220 - 280 280 - 330
330 - 390 390 - 450 450 - 500
Figure 4. Spatial representation of the Phosphorous values in the upper layers (0-30 cm depth). mg kg-1 560 - 610 610 - 660 660 - 710 710 - 760 760 - 810
Figure 5. Spatial representation of the Potassium exchangeable values in the upper layers (0-30 cm depth). In figure 6 are reported the results of the tests carried out after the maize harvest, on the tracks left by the harvester machine and by the truck that flanked the harvest machine after the passage, and on soil not interested by the passes (control).
Vol(1)
Journal of Information Technology in Agriculture
5
90 100
90 100
100 90
MPa
3.15
80
80
80
3.3
70
70
70
3 2.85
Length (m)
60 50
Lenght (m)
60
40 30
30
30
2.55 2.4 2.25 2.1
40
50
Length (m)
40
50
60
2.7
1.95 1.8
20
20
20
1.65 1.5
Width (m)
6
4
2
(m)
2 10
8
Width
6
10
2 10
6
1.35 1.2
Width (m)
Figure 6. Mean values of soil penetration resistance, from 0 to 0.40 m depth, take off on the track after the harvester machine (b) and truck pass (c) and on the control (a). The figure 6 shows how the penetration resistance values increase from the control to the truck pass, reaching a maximum value of 3,5 MPa, while the maximum value of the control is 1,9 MPa; the harvester machine had an intermediate effect with maximum value of 2,5 MPa. The highest values have negative effects on the soil structure, in fact a high rate of campaction, due to the traffic, reduces the porosity limiting the available spaces for the root growth of the next crops; in presence of a shallow water table, it can happen that salt water becomes available for the plants due to capillary crumbling from the deeper layers; all these situations reduce crop yields worsening also soil conditions. Compaction effects on the soil due to agricultural machinery traffic was observed also for other wheeled and rubber tractors (Marsili et al., 1998; Servadio et al., 2001; Servadio et al., 2005; Servadio et al 2010) and it was evident as compaction effects are correlated with and amplified by the existing moisture content, that in our field test was very high (37%). It is important to consider that these effects where caused by only one passage of harvester machine and truck, during harvesting; but for crop managing are needed many more operations, concerning tillage and manuring of the soil, and this contributes to increase compaction effects in terms of reduction of porosity and soil fertility (Meijer et al., 2009). 2.2. The role of GIS in precision farming Using GIS in a context of precision farming can help the farmer to improve significantly the efficiency of fertilization. In a GIS, it is possible to associate a number of layers to a point, each one representing a particular physical or chemical property of soil there. This can be done firstly by georeferencing soil sampling, that should be realized into a regular grid basis to be really representative of soil characteristics, varying in space and time. For what concerns chemical properties, like phosphorus and potassium contents, they can be considered stable over time in agricultural soils (except for sandy ones), because they are not subjected to any loss and they can be taken away only by means of agricultural production. The same is not valid for nitrogen, due to its instability (this is true especially for nitric forms). For nitrogen, it becomes necessary to compile an annual balance like that previously presented. Then, for mechanically harvested crops, it is possible to put into correlation soil properties with its productivity at a punctiform level, simply associating a new layer representing annual crop yield. After collecting this data, it becomes easier for the farmer to manage fertilization with a precision farming approach: phosphorus and potassium can be distributed in different quantities according to soil local content. This makes it possible to level nutrient concentration in soil, to save money and to manage fertilization in a more suitable way in the subsequent year, as a consequence. In fact, conventional uniform fertilization involves keeping level of some stable nutrient (those less subjected to be uptaken by crops, especially in case of monoculture) too high for noticing crop yield positive responses to further increases of their content in soil. It is the case we presented in this work, but it’s also representative of a consistent part of intensively cultivated soils in central Italy. Moreover, what we investigated was the behaviour of soils owned by a large farm near Rome, but our choice wasn’t casual: applying these techniques is undoubtedly more suitable on a large scale, but it is possible (even if with bigger difficulties) also on a medium one.
Vol(1)
Journal of Information Technology in Agriculture
6
Figure 7. Example of using GIS for crop managing (yield distribution).
Conclusions The precision management of nitrogen could allow to avoid problems to the production and to the environment due to the excessive Nitrogen availability. Too much nitrate in the soil can lead to percolation, reducing gravitational water quality. In this research residual soil nitrogen values have been interpolated to generate nitrogen availability maps forming the basis for fertilizers recommendation. Precision nitrogen management has paid off in terms of either profitability and environmental benefits, in an area where leaching potential is high, due to the climate characteristics and the preceding elevate administration of chemical fertilizers and organic manuring, upper than the potential crop removal. Acknowledgements This work was carried out under the auspices of the special project “Sceneries of adaptation of the Italian agriculture to the climatic changes" (AGROSCENARI) of the Agricultural Research Council, and Italian Ministry of the Agricultural and Forestry Politics.
References Marsili, A., Servadio, P., Pagliai, M., Vignozzi, N., 1998. Changes of some physical properties of a clay soil following passage of rubber- and metal-tracked tractors. Soil Tillage Res. 49, 185 – 199. Pierce J.F., Nowak P., 1999. Aspects of precision agriculture. Advances in Agronomy, vol. 67, pp. 85. Academic Press. Long D.S., Engel R.E., Carlson G.R., 2000. Method for precision nitrogen management in spring wheat: II Implementation. Precision Agriculture 2, 25-38. Kluwer Academic Publishers. Servadio, P., Marsili, A., Pagliai, M., Pellegrini, S., Vignozzi, N., 2001. Effects on some clay soil qualities following the passage of rubber tracked and wheeled tractors in central Italy. Soil Tillage Res. 61, 143 – 155. Servadio, P., Marsili, A., Vignozzi, N., Pellegrini, S., Pagliai, M., 2005. Effects on some soil qualities in central Italy following the passage of four wheel drive tractor fitted with single and dual tires. Soil Tillage Res. 84, 87 - 100 Marsili A., Servadio P., Beni C., Di Dio C., Figliolia A., 2000. Spatial variability of maize yield correlated with soil chemical and physical characteristics. International Congress of the AgEng“Agricultural Engineering into the Third Millennium”. 2-7 July, Warwick (GB). Escolà, A. , Arnò, J. Sanz, R. , Camp, F. , Masip, J. Solanelles, F., Rosell, J.R and Planas, S., 2009. Sensing tree canopy parameters in real time for precision fructiculture/horticulture applications: first results. Processing of Joint International Agriculture Conference (JIAC), July 6-8 2009. Ed. By Lokhorst, C., Huijsmans, J.F.M., de Louw, R.P.M. Wageningen Academic Publishers. Swain, K.C. , Zaman, Q.U. , Schumann, A. W. , Percival, D. C. , Dainis, N. and Esau, T.J., 2009. Automated, low-cost yield mapping of wild blueberry fruit. Processing of Joint International Agriculture Conference (JIAC), July 6-8 2009. Ed. By Lokhorst, C., Huijsmans, J.F.M., de Louw, R.P.M. Wageningen Academic Publishers. Vol(1)
Journal of Information Technology in Agriculture
7
Meijer, A. D. , Heiniger, R. W and Crozier, C.R., 2009. Mapping traffic patterns for soil compaction studies using GIS. Processing of Joint International Agriculture Conference (JIAC), July 6-8 2009. Ed. By Lokhorst, C., Huijsmans, J.F.M., de Louw, R.P.M. Wageningen Academic Publishers. Wagner, P. The economic potential of precision farming: an interim report with regard to nitrogen fertilization, 2009 Processing of Joint International Agriculture Conference (JIAC), July 6-8 2009. Ed. By Lokhorst, C., Huijsmans, J.F.M., de Louw, R.P.M. Wageningen Academic Publishers. Servadio, P., Bergonzoli, S., Dell’Unto, D., Beni, C., 2010. Models of soil compaction by agricultural machineries wheeling and soil qualities mapping. International Conference on Agricultural Engineering (AgEng 2010). Towards Environmental Technologies. Clermont-Ferrand, France, 6-8 September.
Vol(1)
Journal of Information Technology in Agriculture
8