Structures of Nuclear Facilities under Decommissioning ... The composition of a possible contamination is a fundamental input for the subsequent assessment of a .... For the nuclide vectors introduced in chapter 2.1, the clearance levels given ...
P-5-313
Concepts and Methods for the Clearance Measurements of Building Structures of Nuclear Facilities under Decommissioning L. Hummel, B. Sitte, K.-H. Lehmann TÜV Süddeutschland, Westendstr. 199, Munich, Germany
1
INTRODUCTION
At the end of every decommissioning project cleared building structures and outdoor areas remain on the site (“green field option”). The rising number of nuclear facilities under decommissioning in Germany requires the development of concepts and methods for measuring procedures for the clearance of building structures under decommissioning. In Germany several criteria of assessment concerning the decommissioning of nuclear facilities (especially NPP´s) are existing. Examples therefore are the Recommendation of the German Commission on Radiological Protection concerning the „Clearance of Materials, Buildings and Sites with Negligible Radioactivity from Practices subject to Reporting and Authorisation“ (1) based on the IAEA „10 µSv-concept“ (safety series #89, (2)) and the „Guide to the Decommissioning of Facilities as Defined in §7 of the Atomic Energy Act“ given by the Federal Ministry for Environmental Protection (3). Several German standards like DIN 25457 („Activity Measurement Methods for the Release of Radioactive Waste Materials and Nuclear Facility Components“, (4)) deal with technical subjects of clearance measurements. The content of the basic formal and technical regulations and standards was described in several publications in the past. Therefore this point is neglected here. Actually in Germany 14 large nuclear facilities are under decommissioning, nine of them are former nuclear power plants. Furthermore two fuel fabrication facilities and two nuclear power plants are already released from the German Atomic Energy Act. The measuring strategies dealing with building structures and sites of a nuclear facility are of larger interest due to the fact that very high masses have to be handled and the measuring techniques differ significantly from those used in an operating facility. Especially in the past, it was common practice that building structures were released by analysing samples randomly taken from the surface or measuring the surface activity by large proportional counters. Recently in situ gamma spectrometry became a major part in release measurements. Beneath the development of measuring devices and strategies we analysed the influence of varying averaging areas on the radiological effects regarding exposure scenarios like direct radiation or incorporation. Maximal averaging areas resulted from this investigations. The substantial part of the work presented in this paper was performed within the scope of a R&D-project funded by the Federal Ministry for Education, Science, Research, and Technology and the State Ministry for Regional Development and Environmental Protection of Bavaria (5).
2
NATURE OF CONTAMINATION IN BUILDING STRUCTURES
The starting point for the definition of an appropriate measuring strategy is the investigation of the major parameters describing building contamination. Four parameters were taken into account: Nuclide vector Activity distribution with depth Lateral1 distribution of activity Frequency distribution of maximum activity values Normally a large number of samples are analysed during the decommissioning to clarify the first two points. The latter points are usually treated as subjects with reduced importance. Nevertheless these points have a significant influence on the quality of release measurements, especially if the contamination must be assumed to appear inhomogeneous or if spot checks are performed to achieve validation of the release critieria. Therefore we have investigated these points with large data-sets in a generic matter to assess the influence of these topics. 2.1
NUCLIDE VECTOR The composition of a possible contamination is a fundamental input for the subsequent assessment of a measuring strategy. Table 1 shows two complete typical nuclide vectors for “special facilities” (S), fuel fabrication facilities (F) and nuclear power plants (P)2. 1
Lateral means the two-dimensional distribution along the surface „Special facilities“ contain a more complicated nuclide vector with nuclides, which are difficult to measure and possess high dose factors (e.g .reprocessing plants). 2
P-5-313
#S1 #S2 #F1 #F2 #P1 #P2 0.521 10.402 34.395 16.565 Fe-55 0.308 0.152 16.995 41.837 Co-60 1.875 3.618 40.191 19.240 Ni-63 31.556 4.221 0.022 0.864 Sr-90 31.556 4.221 0.022 0.864 Y-90 10.088 19.900 0.004 0.001 4.504 20.408 Cs-137 0.563 Pm-147 0.651 0.054 Eu-154 0.190 Eu-155 0.195 2.629 Tl-208 0.234 2.929 Bi-212 0.194 2.836 Pb-212 Ra-226 0.203 2.587 Ac-228 0.218 2.950 Th-228 0.450 Th-230 0.983 Th-232 1.197 1.573 Th-234 1.249 1.666 Pa-234m 89.645 75.135 0.004 U-234 3.586 4.243 U-235 0.461 0.414 U-236 1.223 1.604 0.005 U-238 0.172 1.025 0.014 0.176 0.177 Pu-238 0.068 1.462 0.079 0.21 0.046 Pu-239 0.108 1.628 Pu-240 16.162 49.449 1.345 2.919 Pu-241 6.056 3.920 0.154 0.485 Am-241 Table. 1: Detailed description of the composition [%] of typical building contamination of different nuclear facilities in Germany According to (1) nuclides which contribute less than 10% to the total effective dose of a member of the general public may be neglected. This simplifies the nuclide vector significant (see Table 2). #S1 #S2 #F1 #F2 #P1 #P2 1 nuclide Am-241: Cs-137: U-234: U-234: Co-60: Co-60: 47,4% 36,9% 100,0% 79,3% 92,6% 87,2% nd Th-228: Cs-137: Cs-137: 2 nuclide Sr-90: Pu-α: 10,4% 7,4% 12,8% 24,7% 28,7% rd 3 nuclide Cs-137: Am-241: Th-232: 23,7% 24,2% 10,4% 4th nuclide Pu-241: Pu-241: 4,2% 10,2% Table 2:Reduced nuclide vectors after implementation of the criterion according to (1) (see text). The values in % give their contribution to the total dose (data-base: mass-specific clearance levels according to (8). st
Thus it can be concluded, that in general nine nuclides as shown in Table 2 are sufficient to assess the radiological impacts of building structures after their release.
P-5-313
2.2
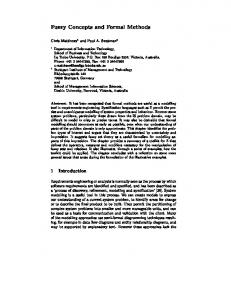
ACTIVITY DISTRIBUTION WITH DEPTH In a special investigation (5) the migration of important nuclides into concrete was summarised from different decommissioning projects3. The focus laid on the isotopes Co-60, Sr-90, Cs-137, U-235 and Am-241. For Sr-90 only few results of detailed depth profiles were available. Furthermore Am-241 decreased very strong with depth in the profiles under investigation. Therefore only the results for Co-60, Cs-137 and U-235 will be presented. Figure 1 gives the result as a scatter plot for Co-60 (40 samples), Cs-137 (39 samples) and U-235 (43 samples)4. 10
β [g/cm²]
1
0.1
0.01 0.1
1
10
max. sampling depth [g/cm²]
Figure 1: Scatterplot of the value β (depth as mass per unit area), where the activity has decreased to 1/e of the surface activity of the structure by assuming an exponential decrease of activity as a function of the maximum sampling depth. The lines show the regression curves in double logarithmic scale for Co-60 (straight), Cs-137 (dash) and U-235 (dot). The data shown in Figure 1 have a good correlation coefficient (worst: U-235 with 0.74; best: Co-60 with 0.91). The migration depth of the three nuclides under investigation is comparable. All curves have a statistical clear upward gradient (min: 0,98 for Cs-137; max: 1,28 for Co-60), therefore the estimation of a pure exponential decrease of activity with depth is disproved. It has to be concluded, that there is a decrease of activity with depth, which has to be fitted with a function, which is more rapid than the exponential function. For the interpretation of this result, it can be stated, that the commonly used exponential law can be used, if the value β is defined according to its later use (e.g. definition of β with a sampling depth somewhat higher than necessary for decontamination purposes). 2.3
LATERAL DISTRIBUTION OF ACTIVITY An essential aim of our investigation was the definition of a simple function to estimate the lateral distribution on building structures. For this parameter, no easy fit procedure was expected. The investigation showed, that a gaussian decrease of activity with distance from the centre of the contamination fits the data better than a linear or an exponential decrease. This result was achieved by analysing 2.980 samples from nuclear power plants, 1.591 samples from fuel fabrication facilities and 602 samples from so-called “special facilities”. Each sample represents one measurement with a contamination monitor upon a regular grid laid of the building structure with a contamination level high enough to achieve a signal. According to the strong variability of the physical and chemical conditions during the contamination itself a large variability of the results was expected. For grids measured in nuclear power plants under decommissioning the analysis of the frequency distribution of the measured width of contamination showed that the median values were between 17 and 41 cm for the 1σ-width of the contamination. Many tests were performed to prove, that the result is free of systematically appearing errors (e.g. density of measurements, level of contamination). In Figure 2 the results of the data-sets mentioned above are summarised.
3 4
Due to the total masses and activities activated concrete structures are of less importance and neglected here. For U-235 different materials than concrete were investigated due to the building structures used for fuel fabrication facilities.
1 σ -width of contamination
P-5-313
100
10 1
2
5
10
20
30 40 50 60 70
80
90
95
98 99 99.5
Probability [%]
Figure 2: Probability of occurrence of a contamination with a 1σ-width smaller than the value given on the y-axis in [cm] by assuming a gaussian shaped decrease of activity. The straight line represents the data from grid measurements in nuclear power plants (dot: fuel fabrication facilities, dash: “special” facilities) The smooth gradient of the curves in Figure 2 shows the expected result of a wide variability of the lateral extent of contamination upon building structures. Nevertheless this investigation gives valuable information e.g. the probability of contamination smaller than a given value for the assessment of the representativity of a definite sampling strategy. 2.4
FREQUENCY DISTRIBUTION OF MAXIMUM ACTIVITY VALUES For the estimation of the total activity of a building structure or the assessment of the probability of missing a contamination above the clearance level knowledge of the frequency distribution of contamination maxima would be of interest. The frequency distribution of contamination defines the properties of contamination and its determination requires very large data-sets. The reason therefore is, that all measurements below the detection limit must be filtered off before the statistical analysis5. It was a remarkable result, that all 12 data-sets, which were analysed could be fitted with a logarithmic gaussian distribution with very low values of χ². So the activity values of contamination can be predicted with a given variability in orders of magnitude. The typical value of the 1σwidth of the logarithmic gaussian distribution is approx. 0.7 orders of magnitude (extreme values: 0.23±0.17, 1.44±0.10). This result was checked with respect to their dependence on parameters like number of measurements in the set of statistics (a), contamination level (b), measuring technique (c) and type of facility (d). A Wilcoxon-test performed for the parameters (a-d) led to the result, that the 1σ-width is independent from (d) and clearly dependent from (c). The parameters (a, b) seem to show no dependence. The reason for the dependence upon the measuring technique (c) (contamination monitor or sampling and subsequent laboratory analysis) is not understood yet. Nevertheless the investigation led to the result, that a frequency distribution of contamination maxima with a 1σ-width of 0.35 to 0.85 orders of magnitude gives a good estimate for the true distribution of the peak contamination values of building structures.
3
RISK-BASED CLEARANCE LEVELS
Since several years a set of nuclide specific clearance levels for the release of materials based on the “10 µSv-concept” (2) is established in Germany. With the actual revision of the German radiation protection ordinance three comparable sets of clearance levels for buildings and building rubble will be established. The data base is a directive of the European Commission (8). Table 3 summarises the clearance levels for important nuclides. 5
The frequency distribution of interest would be masked with the gaussian distribution given by measurements below detection limit.
P-5-313
I II III Co-60 0,36 2,9 0,089 Sr-90 34 34 1,5 Cs-137 1,5 12 0,40 Th-228 0,27 2,6 0,073 Th-232 0,14 1,2 0,038 U-234 1,4 11 0,36 0,3 2,4 0,077 Pu-α Pu-241 11 92 3,0 Am-241 0,34 2,8 0,091 Table 3: Surface-specific (Column I&II, [Bq/cm²]) and mass-specific (Column III, [Bq/g]) clearance levels according to (8). Column I will be used, if the building may be reused in the future, column II may be used, if the building will be demolished and column III is for building rubble arising during the decommissioning process. The surface-specific activity must be interpreted as the projection of the total migrated activity upon the surface divided by the unit area6. For the nuclide vectors introduced in chapter 2.1, the clearance levels given in Table 4 were calculated using these clearance levels of table 3. #S1 #S2 #F1 #F2 #P1 #P2 I [Bq/cm²] 9.4 1.8 1.4 1.2 0.44 0.51 II [Bq/cm²] 16 15 11 9.1 3.6 4.1 III [Bq/g] 0.635 0.498 0.360 0.297 0.112 0.129 Table 4: Surface-specific (Raw I&II) and mass-specific (Raw III,) clearance levels according to (8) for the nuclide vectors introduced in chapter 2.1. In (8) the averaging area for the surface-specific clearance level is recommended to be 1 m² for the massspecific clearance level is recommended to be 1 Mg. These quantities were used for a radiological investigation performed in (5) to assess, whether these criteria stay appropriate after implementation of the results gained in chapter 2.2 and 2.4. Due to the positive result of this investigation, which is not object of this presentation, the following total activities resp. specific activities of the leading nuclide have to be detected (Table 5). Due to the achievable detection limits performing gamma spectrometric analysis Cs-137 for vector #Sx had to be chosen as leading nuclide7, U-235 for vector #Fx and Co-60 for vector #Px. The release of building rubble with massspecific clearance levels will not be considered in the following discussion due to the fact that buildings of nuclear facilities generally should be released before their demolition. [Bq/cm²] [kBq]
#S1
#S2
#F1
#P2
Cs-137 Cs-137 U-235 Co-60 I 0.95 0.34 0.050 0.21