Hydrol. Earth Syst. Sci., 13, 893–904, 2009 www.hydrol-earth-syst-sci.net/13/893/2009/ © Author(s) 2009. This work is distributed under the Creative Commons Attribution 3.0 License.
Hydrology and Earth System Sciences
Conditioning rainfall-runoff model parameters for ungauged catchments and land management impacts analysis N. Bulygina, N. McIntyre, and H. Wheater Department of Civil and Environmental Engineering, Imperial College, London, UK Received: 19 January 2009 – Published in Hydrol. Earth Syst. Sci. Discuss.: 6 March 2009 Revised: 28 May 2009 – Accepted: 10 June 2009 – Published: 23 June 2009
Abstract. Data scarcity and model over-parameterisation, leading to model equifinality and large prediction uncertainty, are common barriers to effective hydrological modelling. The problem can be alleviated by constraining the prior parameter space using parameter regionalisation. A common basis for regionalisation in the UK is the HOST database which provides estimates of hydrological indices for different soil classifications. In our study, Base Flow Index is estimated from the HOST database and the power of this index for constraining the parameter space is explored. The method is applied to a highly discretised distributed model of a 12.5 km2 upland catchment in Wales. To assess probabilistic predictions against flow observations, a probabilistic version of the Nash-Sutcliffe efficiency is derived. For six flow gauges with reliable data, this efficiency ranged between 0.70 and 0.81, and inspection of the results shows that the model explains the data well. Knowledge of how Base Flow Index and interception losses may change under future land use management interventions was then used to further condition the model. Two interventions are considered: afforestation of grazed areas, and soil degradation associated with increased grazing intensity. Afforestation leads to median reduction in modelled runoff volume of 24% over the simulated 3 month period; and a median peak flow reduction ranging from 12 to 15% over the six gauges for the largest simulated event. Uncertainty in all results is low compared to prior uncertainty and it is concluded that using Base Flow Index estimated from HOST is a simple and potentially powerful method of conditioning the parameter space under current and future land management.
Correspondence to: N. Bulygina (
[email protected])
1
Introduction
Rainfall-runoff modelling can be undertaken on different catchment discretisation scales: starting from representative volumes of a few centimetres, going up to the whole catchment being treated as one element (Beven, 2008; Singh, 1996). The choice of modelling scale depends on modelling objectives, the sought prediction accuracy and the available supporting data, particularly rainfall and flow observations. It is common to have supporting flow observations at only one point in the catchment or to have no response record at all (Sivapalan et al., 2003; Wagener et al., 2005). Such data scarcity (or absence) contributes to ambiguity in model parameter values due to the absence of information with which to constrain the prior parameter space (Beven, 2001, 2003), which may result in unacceptable uncertainty in modelled response. Where the modelling objective requires a detailed catchment discretisation with many element types, each with its own model parameter set, the issue of uncertainty due to lack of flow observations quickly becomes over-riding. To alleviate this problem, parameter regionalisation may be used to constrain the parameter space prior to, or instead of, calibration (Bardossy, 2007; McIntyre et al., 2005; Yadav et al., 2007). The core of most regionalisation approaches is an estimation of either the dependence of the model parameter on physical catchment characteristics (e.g. catchment area, steepness, soil permeability) (Lamb and Kay, 2004; Lee et al., 2006; McIntyre et al., 2005; Young, 2006); or the dependence of response indices (e.g. mean annual discharge, daily discharge standard deviation) using physical characteristics (Bardossy, 2007; Yadav et al., 2007), so that the indices can then be used to restrict the parameter space. The first approach is weakened by uncertainty in the model parameters and hence the regional relationship, and the regional relationship neglects or simplifies model parameter interdependencies (McIntyre et al., 2005). The potential benefit of the second approach is that the response indices may be selected
Published by Copernicus Publications on behalf of the European Geosciences Union.
894
N. Bulygina et al.: Conditioning rainfall-runoff model parameters for ungauged catchments
so that they are relatively independent and well-defined for the relevant set of catchments, so that relationships with the chosen catchment characteristics may be found with minimal ambiguity. The underlying challenge is to find indices which are adequately informative, independent and lead to well-defined regional relationships. Yadav et al. (2007) explored different physical characteristics and response indices in a pilot study for 30 UK catchments. The most influencial properties were found to be Base Flow Index (proportion of flow as base flow) and a Wetness Index equal to precipitation divided by potential evaporation. In their work the Base Flow Index (BFI) is estimated using the HOST system of Boorman et al. (1995). The HOST system provides estimates of Base Flow Index (BFIHOST ) for each of 29 soil classes as functions of various physical soil properties: depth to gleyed layer, depth to slowly permeable layer, integrated air capacity, presence of peaty surface layer, and soil parent material. Therefore, BFIHOST is non-linearly related to soil properties, with considerable uncertainty. The variance of BFIHOST is specified for each class, representing spatial and temporal variabilities within classes. Various other researchers have found that BFIHOST is the catchment characteristic of principal importance in the UK and alone contains significant information about rainfall-runoff model parameters (Lamb and Kay, 2004; Lee et al., 2006; Young, 2006). In some cases, other catchment properties or HOST outputs have been found to be more important. These are generally, although not always, highly correlated with BFIHOST (Wagener et al., 2004). In all applications of the HOST data to rainfall-runoff modelling, the significant uncertainty in HOST outputs, among other sources of model uncertainties, means that formal uncertainty analysis is recommended. As well as application to ungauged catchments, regionalisation of response indices may be applied to land management impacts analysis (Wagener, 2007). For example, the impact of land management on soil properties can be speculated and translated, via the regional model, into changes in response indices. This has been done most widely using indices derived from the USDA’s Curve Number system (e.g. Gassman et al., 2007) and recently in the UK using the HOST system (DEFRA, 2007). Although the effect of some land management interventions has been well studied in some catchments (e.g. the study of the impacts of trees by Robinson et al., 2003), in general the link between land management and runoff indices is complex and not well identified from the literature (O’Connell et al., 2007). Representation of land management using conceptual models therefore involves significant uncertainty. The objective of this study is to propose a regionalisation scheme which may be applied throughout the UK, and which may provide adequate information about rainfallrunoff responses for a range of applications. In particular the method is developed to allow us to predict flows in ungauged catchments and to explore impacts of local land manHydrol. Earth Syst. Sci., 13, 893–904, 2009
agement changes to catchment properties using highly discretised catchment models. The response index approach to regionalisation is adopted, using the indices to condition prior model parameter uncertainty into posterior distributions so that probabilistic predictions of land management impacts can be made. While the methodology allows all available runoff response indices to be introduced, we use only BFIHOST with the hypothesis that this on its own is usefully informative. In the rest of this paper, the methodology is described and assessed for a highly discretised catchment, and its applicability to evaluating land use change impacts is demonstrated. 2 2.1
Method Parameter space restriction using BFI
Suppose a catchment is discretised into a large number of runoff generating elements, and catchment response is viewed as the integration of all the individual elemental responses (we consider network routing of generated runoff as a separate issue, below). Potentially, the catchment model needs a separate set of parameters for each element. Here, it is assumed that all elements with the same HOST have the same set of parameter values. Therefore, the number of different parameter sets needed for runoff generation modelling is far less than the number of elements and cannot exceed 29 – the number of soil types in the HOST classification. For simplicity, we assume each element to be homogeneous in terms of HOST classification (although if the heterogeneity was significant, the method could easily be extended to consider the distribution of BFI values within each element). For each model element, a hydrological model can be run, and then the BFI can be estimated from the simulated runoff. In this study, BFI is estimated using base flow hydrograph separation procedure from Gustard et al. (1992). The procedure calculates flow minima of five-day non-overlapping consecutive periods and subsequently searches for turning points in this sequence of minima. The turning points are then connected to obtain the base flow hydrograph which is constrained to equal the observed hydrograph ordinate on any day when the separated hydrograph exceeds the observed. The simulated BFI is compared to the expected BFIHOST value for the associated soil class. The closer the comparison, the more consistent the model with the prior information about the soil. This comparison should account for the standard deviation of BFI due to natural variablity within a soil class σ (Table 1). Therefore, for each HOST soil type, the posterior distribution of model parameter θ is expressed as p(θ ) ∝ L(BFIHOST |BFIθ ) ∗ p0 (θ )
(1)
where p0 is a prior parameter distribution, L(BFIHOST |BFIθ ) is the likelihood of BFI = BFIHOST given the model estimate www.hydrol-earth-syst-sci.net/13/893/2009/
N. Bulygina et al.: Conditioning rainfall-runoff model parameters for ungauged catchments
895
Table 1. BFIHOST expected values, standard deviations and analogue classes under soil degradation (Packman et al., 2004). HOST class
1
2
3
4
5
6
7
8
9
BFIHOST
1
1
0.9
0.79
0.9
0.65
0.79
0.56
0.73
0.52
0.022
0.039
0.052
0.042
0.065
0.065
0.177
0.216
0.254
0.142
Analogue class
3
3
7
6
7
8
7
8
9
10
HOST class
11
12
13
14
15
16
17
18
19
20
BFIHOST
0.93
0.17
1
0.38
0.38
0.78
0.61
0.52
0.47
0.52
Std
0.213
0.075
0.231
0.225
0.028
0.195
0.027
0.039
0.104
0.207
Analogue class
11
12
3
24
15
18
18
20
22
HOST class
21
22
23
24
25
26
27
28
29
BFIHOST
0.34
0.32
0.22
0.31
0.17
0.24
0.26
0.58
0.23
Std
0.025
0.111
0.118
0.019
0.042
0.043
0.193
0.156
0.034
23
27
25
25
25
26
27
28
29
Std
Analogue class
BFI = BFIθ . The likelihood function is assumed proportional to a normal probability density function with expected value BFIθ and variance σ 2 . In the case study, a single model structure is assumed, although the method may be generalized to multiple model structures. As introduced previously, the underlying hypothesis behind the method is that BFIHOST alone contains an adequate amount of information with which to condition the parameter space. The method is therefore not applicable for conditioning the parameters of model components unrelated to soil type. For example, this may include the routing effects of lakes, reservoirs and the channel network; and effects of vegetation types on evapotranspiration and routing. The parameters of these components must be constrained using some other source of knowledge or observed data. 2.2
Modelling aspects of land use change
As well as testing the applicability of the method to ungauged catchments, our motivation is to allow element-scale (100 m×100 m) land management changes to be easily represented within catchment scale models. This involves identifying suitable changes to p(θ) for the affected elements. Two examples are discussed here – afforestation and grazing intensity. In most situations trees are known to increase interception losses and hence reduce net rainfall, reduce soil water content, and increase infiltration rates at the soil surface (Jewitt, 2005). There is also evidence that base flow proportion increases under forest both in Pontbren (Wheater et al., 2008) and in reviews of paired catchment studies around the world (Brown et al., 2005), but currently only limited quantitative www.hydrol-earth-syst-sci.net/13/893/2009/
10
20
information about this change is available. Therefore, afforestation is assumed to lead to higher BFI, while keeping the same HOST soil type. Hence, given a parameter set θ0 (and corresponding BFI value BFI0 ) before afforestation, the posterior parameter probability distribution for new conditions is defined as, p(θf |θ0 ) ∝ L(θf |θ0 ) ∗ p0 (θf )
(2)
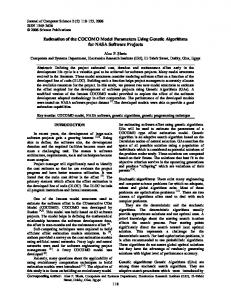
Here, θf is a parameter set for afforested conditions, the prior p(θf ) = p(θ0 ) is the parameter distribution for the current HOST class, and the likelihood L(θf |θ0 ) takes one of two values: 1 if the simulated BFI for θf is higher than BFI0 and 0 otherwise. In other words, the posterior includes only those parameter sets that lead to a base flow increase. We note that, in principle, physics based models could be used as an additional source of information for parameter conditioning, e.g. following Jackson et al. (2008). Changes in interception losses associated with afforestation may be estimated using a standard model using parameter distributions from the literature. For the simple hard threshold bucket model shown in Fig. 1, the value of canopy storage capacity, Cint can range from 0.2 to 3.8 mm depending on species, leaf area index, canopy cover, vegetation structure, and density. Canopy storage is particularly low in deciduous forests during leafless (winter) periods (David et al., 2005). The second land management change considered is increasing stocking density, leading to soil structural degradation. Following the approach of Hollis (Packman et al., 2004), degraded soil is assigned an appropriate analogue HOST class to represent the change (Table 1). The rationale Hydrol. Earth Syst. Sci., 13, 893–904, 2009
896
N. Bulygina et al.: Conditioning rainfall-runoff model parameters for ungauged catchments
for the proposed changes is that soil structural degradation, in the form of topsoil and upper subsoil compaction and seasonal “capping” and sealing of soil surfaces, causes a reduction in the effective soil storage, which in turn results in increased surface runoff. Therefore, the general principle is that soil structural degradation affects the soil storage/wetness component of the HOST classification, but does not alter the hydro-geological component. Given a parameter set θ0 (and corresponding BFI value BFI0 ) before soil degradation, the posterior parameter probability distribution for the degraded conditions is defined as p(θd |θ0 ) ∝ L(θd |θ0 ) ∗ p0 (θd )
(3)
where θd is a parameter set for the degraded conditions, the prior p(θd ) equals the parameter distribution for the analogue HOST class, and the likelihood L(θd |θ0 ) takes one of two values: 1 if the simulated BFI for θd does not exceed BFI0 and 0 otherwise. Hence, the posterior accepts only those parameter sets that lead to a base flow reduction and therefore flashier response. 2.3
Performance statistics
The proposed parameter restriction method will result in probabilistic discharge prediction. Often in hydrology, prediction quality is characterised using the Nash-Sutcliffe efficiency coefficient (NS). To define its analogue for probabilistic predictions, a “distance” between a data point at time t (qt0 ) and a random variable that represents the modelled value (ξt ) can be introduced as follows, sZ d(ξt , qt0 ) =
(q − qt0 )2 · fξt (q)dq
(4)
where fξt denotes probability density function (pdf) for ξt , and q is a variable for integration. Then transforming the relationship using probability theory, the distance becomes q d(ξt , qt0 ) = Var[ξt ] + (E[ξt ] − qt0 )2 (5) where Var[·] denotes variance, and E[·] denotes mathematical expectation. Then the NS statistic is defined as NS
prob
PT
2 0 t=1 d (ξt , qt ) 0 0 2 t=1 (qt − E[q ])
= 1 − PT
(6)
or using the above transformation NSprob = 1 −
PT
0 2 t=1 Var[ξt ] + (E[ξt ] − qt ) PT 0 0 2 t=1 (qt − E[q ])
(7)
This can be subdivided into two parts ( ) PT PT (E[ξt ] − qt0 )2 Var[ξt ] NSprob = 1 − PTt=1 0 − PT t=10 0 2 0 2 t=1 (qt − E[q ]) t=1 (qt − E[q ])
Hydrol. Earth Syst. Sci., 13, 893–904, 2009
(8)
Fig. 1. Interception loss model.
where the first part corresponds to the traditional NS coefficient in which expected values are considered as predictors; and latter represents the variance whereby the higher predictor variance around the mean is, the less “effective” the prediction. Although the proposed method may be used for ungauged and poorly gauged catchments, for performance assessment purposes the method is applied here to a densely monitored experimental catchment, as if it were poorly gauged; and the predictions are evaluated using the traditional and proposed Nash-Sutcliffe efficiency coefficients.
3 3.1
Case study Case study – catchment description
The method is demonstrated using data from the Pontbren catchment in Powys, Wales, UK (gauged area 12.5 km2 ) (Marshall et al., 2009). Elevations in the catchment range from 170 m to 438 m, and slopes are typically steep, on average 5.9% . The land at Pontbren is almost exclusively grazed grassland, which occupies approximately 88% of the land. Woodland occupies 7% of the land area, and the remaining 5% is crops, roofs, paved areas, private gardens and open water. The average annual rainfall measured at Pontbren for the period April 2005–January 2008 is 1670 mm, and potential evapotranspiration, estimated by the MORECS model (Hough and Jones, 1997) for grassland is 774 mm, so that P/PE ratio is about 2.16. Soil types are dominated by low permeability silty clay loams (Table 2 and Fig. 2). Typically, 20 cm depth of topsoil overlies a deep layer of relatively impermeable subsoil. On moorland, the topsoil has a significant peat content. The time-series data used for this study are 10-min resolution rainfall from one of the on-site raingauges, daily MORECS potential evapotranspiration data, and 15-min www.hydrol-earth-syst-sci.net/13/893/2009/
N. Bulygina et al.: Conditioning rainfall-runoff model parameters for ungauged catchments
897
Table 2. Soils of the Pontbren catchment. Soil series
Broad group
Manod
East Keswick
Fine loamy over lithoskeletal Fine loamy over lithoskeletal Fine loamy
Sannan
Fine silty
Cegin
Fine silty
Wilcocks
Peaty surface layer over loamy
Hiraethog
Denbigh
texture
Soil water regime
Soil parent material
HOST class
BFIHOST
Well drained, moderately permeable, subsoils rarely wet
Mudstones and sandstones
17
0.61
Well drained, moderately permeable, subsoils rarely wet
Mudstones and sandstones
17
0.61
Well drained, moderately permeable, subsoils rarely wet Slight seasonal waterlogging, subsoils slowly permeable Slowly permeable, seasonally wet
Drift with siliceous stones Glacial till with siliceous stones Glacial till with siliceous stones Glacial till with siliceous stones
6
0.65
18
0.52
24
0.31
26
0.24
Mudstone and sandstone
15
0.38
Crowdy
Thin peat over loamy over lithoskeletal Deep peat
Seasonally waterlogged, topsoils wet for most of autumn, winter and spring, subsoils wet for most of year Seasonally waterlogged, topsoils wet for most of autumn, winter and spring Permanently waterlogged
Humified peat
29
0.23
Winter Hill
Deep peat
Permanently waterlogged
Peat
29
0.23
Table 3. Contributed areas for the considered gauges. Gauge number Contributing area, km2
2
5
6
7
9
1.3
2.4
3.2
5.8
4.1
10 12.5
resolution streamflow data from five bed-mounted acoustic Doppler velocity meters (gauges 2, 5, 6, 7, and 9 in Fig. 3) and from a pressure transducer at a rated section (gauge 10). Gauge 10 data are used for assessing low flow (< 1.5 m3 /s ) performance only because the rating curve for higher flows is poorly defined. The contributing areas at each of the six gauges are given in Table 3. Although another four flow gauges exist (Fig. 3) their data are considered less accurate (McIntyre and Marshall, 2008) and so are neglected here. The periods used for the modelling demonstration are January 2007–March 2007, where the best quality and the most complete data exist; and end of June 2007–beginning of August 2007, used to demonstrate the prediction skill in dry conditions. To match observation record frequency, the model input-output time resolution is 15 min. 3.2
Case study – model description
The catchment is discretised into 100 m×100 m runoff generating elements. A semi-distributed modelling toolkit (Orellana et al., 2008; Wagener et al., 2004) is used that requires www.hydrol-earth-syst-sci.net/13/893/2009/
Fig. 2. Pontbren soils.
specification of a conceptual runoff generating model and a routing model for each element. An element’s generated runoff directly goes to a stream network that connects all elements, so that there is no model element interaction. A probability distributed soil moisture (PDM) model together with two parallel linear routing stores (Fig. 4) is selected, as this is perceived to be widely applicable in the UK (Calver et al., 2005; Lamb and Kay, 2004; Lee et al., 2006). This model has five parameters (units are listed in Table 4): cmax is the maximum soil water storage capacity within the element, b is a shape parameter defining the storage capacity distribution, α is a parameter defining the proportion of quick runoff, and kf Hydrol. Earth Syst. Sci., 13, 893–904, 2009
898
N. Bulygina et al.: Conditioning rainfall-runoff model parameters for ungauged catchments
Fig. 4. Rainfall-runoff conceptual model.
Table 4. Parameter ranges used in analysis.
Fig. 3. Pontbren instrumentation locations: black triangular with number denotes stream and drain flow monitoring site; blue triangular denotes rain gauge.
and ks are routing store residence times. Actual evapotranspiration is equal to potential evapotranspiration multiplied by the relative moisture content of the soil. There is a lake upstream of gauge 8 (Fig. 4). Its response is simulated using the weir equation Q = kH m , where H is the water level in the lake above the outlet’s lowest point, and coefficients k and m are related to the outlet geometry (Montes, 1998) that, following channel measurements (McIntyre and Marshall, 2008), is assumed to be parabolic. Any subsurface flow from the lake is neglected. Other lakes and reservoirs in the catchment are not accounted for, due to their small sizes. Each element is connected to the stream network. In each element the channel is assumed to be a single straight length of channel connecting the upstream and downstream nodes of that element. The runoff from each element is assumed to be uniformly distributed along the associated stream length. Element runoff is routed down using a constant celerity approach, i.e. the water moves with constant velocity (Beven, 1979). Rainfall is assumed uniform across the catchment, while PE is associated with vegetation cover via the MORECS data. 3.3
Case study – conditioning the parameter space for land management impacts analysis
Prior ranges for the runoff generating model parameters are given in Table 4. These are liberal ranges for UK catchments (Wagener et al., 2004). To select acceptable parameter sets for each HOST soil class, 10 000 parameter sets are randomly sampled from the five-dimensional prior parameter space using the Latin hypercube method, and the model is run for 2 years (2006–2007 WY) to estimate the corresponding BFI for each parameter set. Following Eq. (1), each paHydrol. Earth Syst. Sci., 13, 893–904, 2009
Parameter
Cmax , mm
b –
α –
kf , 15 min
Range
0–500
0–2.5
0–1
1–60
ks , 15 min 60–3000
rameter set is prescribed a weight based on the closeness of the simulated BFI to the corresponding BFIHOST value, producing a posterior parameter distribution for each soil type. Then 1000 parameter sets for each HOST class are independently sampled from the posterior distributions. Thus 1000 possible parameter sets for each of the 29 soil classes define the conditioned parameter space, and no observed flow data have yet been used. The celerity parameter is estimated by fitting the modelled peak flow arrival times to observations. To do so, a celerity value is sampled from the range 0.1 to 1 m/s, and the semidistributed model is run to generate modelled time of arrival for each flood event. Several samples of peak flow arrival time observed at gauge 6 are used to estimate the best of the sampled celerity values (visual fit). Note that the flow data requirement for parameter estimation is thereby limited to a few samples of peak flow arrival time (and no actual discharge values are used). In catchments which are completely ungauged, the celerity parameter could instead be estimated from channel properties. In this work, we keep the celerity parameter unchanged for both current day and land use change scenarios, assuming that stream network hydraulics will not differ significantly under the scenarios. At the beginning of the simulations the soil moisture stores are assumed to be full, and the fast and slow routing stores are assumed to be empty. To diminish the influence of the initial conditions on predictions, the model is run for a two month “warming up” period before the 1st of January 2007. To investigate the effect of afforestation and grazing effects, the conditioning method described by Eqs. (2) and (3) is implemented. Additionally, for afforestation, an interception capacity is added to the model using Cint =1 mm, www.hydrol-earth-syst-sci.net/13/893/2009/
N. Bulygina et al.: Conditioning rainfall-runoff model parameters for ungauged catchments
899
Fig. 5. BFI – restricted marginal parameter distributions (HOST = 4, BFIHOST = 0.79, σ = 0.042).
and wet canopy evaporation is assumed to be three times higher than the dry canopy transpiration rate, representative of pine/coniferous forest (David et al., 2005; Stewart and Thom, 1973). Alternatively, an interception capacity and wet canopy enhanced evapotranspiration rate could be conditioned using the top-down model for forest actual evapotranspiration rate proposed by Zhang et al. (2001).
4
Results
The posterior parameter distributions restrict the slow flow residence time ks and runoff partitioning coefficient α (Fig. 5). The low ks values have low posterior probability, and the runoff partitioning coefficient distribution is concentrated around a value of (1−BFIHOST ). The celerity of 0.7 m/s provided satisfactory peak flow arrival timing, and is used for stream network routing. These results illustrate that BFIHOST contains information about baseflow response time as well as baseflow proportion, however lacks information about soil moisture capacity and fast flow response. Nevertheless, the results below show that despite this missing information, the method performs well in terms of explaining the observed flow. Other investigations have indicated that soil parameters and fast flow residence times may be usefully estimated from other prior information (e.g. Koren et al. 2004; Lee et al. 2006; Jackson et al., 2008) and/or may be well identified from suitable calibration data sets. Such information would be necessary if uncertainty needed to be constrained further. www.hydrol-earth-syst-sci.net/13/893/2009/
Figure 6 shows discharge predictions for January 2007, which is representative of the 3-month evaluation period. Here, the medium grey area represents the 90 percentile on the discharge prediction; and the blue dots are observed data points. The light grey area represents the 90 percentile of prior uncertainty, when there is no distinction due to soil type and land use, and parameters are assigned uniformly across the catchment. The dashed lines show the range of flows within which the streamflow gauge was calibrated and considered accurate (McIntyre and Marshall, 2008), so that the data points lying in the range could be considered as being more reliable than the points lying outside. Note that gauge 10 rating curve is estimated using flows up to 1.5 m3 /s only. The Nash-Sutcliffe statistics for probabilistic predictions and expected values, as defined in Sect. 2, are summarized in Table 5. These are better overall than those achieved by Jackson et al. Jackson et al. (2008) who used a dataintensive “meta-modelling” approach, combined with calibration to observed flows, to model the same catchment. Although the PDM model is not designed for dry period modelling, predictions for a summer period (end of June 2007 to beginning of August 2007) are shown in Fig. 7. While the good performance is maintained in general, the model significantly over-estimates stormflow following the rainfall events during the relatively dry periods in the middle of July. Difficulty in simulating wetting-up periods is typical of this PDM model and similar conceptual models. In particular, the simple evapotranspiration calculation and the inability of the model to maintain percolation while turning off stormflow generation (i.e. the assumption of constant α) are thought to
Hydrol. Earth Syst. Sci., 13, 893–904, 2009
900
N. Bulygina et al.: Conditioning rainfall-runoff model parameters for ungauged catchments
Table 5. Nash - Sutcliffe efficiency coefficients (1 January 2007–31 March 2007).
Random variable Expected value
Gauge 2
Gauge 5
Gauge 6
Gauge 7
Gauge 9
0.71 0.84
0.66 0.70
0.81 0.85
0.70 0.78
0.79 0.80
Gauge 10 0.64 0.65
Fig. 6. Prediction uncertainty bounds for January, 2007. 90% high probability density interval is shown as medium grey area; the blue dots are measured data; the prior 90% high probability density area is represented by the light grey area, and the dashed lines indicate flow range streamflow gauge was calibrated on.
be the main causes of this error. Both Figs. 6 and 7 show that the model is least successful at gauge 9 in terms of explaining the base flow observations. This may be because the influence of the lake in sustaining low flows is more complex than represented in the model; or may be due to low flow gauging errors. The performances achieved together with Fig. 6 support the view that BFIHOST is an effective response index. The afforestation and soil degradation scenarios introduce the shifts in the distributions of α shown in Fig. 8. Figure 9 shows the predicted impacts of these land management changes on runoff at gauge 10. Here, the solid lines represent the 90 percentiles for current conditions and the dashed lines are the corresponding results for full afforestation and soil degradation. The peak flow distributions provide quantitative information which reflects our basic prior knowledge. The uncertainty in the peak flow is high compared to the exHydrol. Earth Syst. Sci., 13, 893–904, 2009
pected changes, indicating that there would be benefits in seeking some more information about the model parameter values particularly, perhaps, kf . The relative differences between the median and mean results associated with the scenarios are given in Table 6. This includes changes in total runoff within the period 1 January 2007–31 March 2007 and changes in the highest observed peak flow (on the 18th of January). The percentage reductions in total runoff, when rounded to the closest integer, were the same for all gauges (only this single number for each land use change is shown in the corresponding rows in Table 6). The afforestation delayed the highest peak arrival by 15 min (one simulation time step), and the soil degradation scenario did not show any difference in peak flow arrival time.
www.hydrol-earth-syst-sci.net/13/893/2009/
N. Bulygina et al.: Conditioning rainfall-runoff model parameters for ungauged catchments
901
Table 6. Median and expected value of relative reductions in total flow and peak flow (in percent relative to current day land use) due to some effects of afforestation and soil degradation. Gauge 2
Gauge 5
Gauge 6
Gauge 7
Gauge 9
Gauge 10
Afforestation % reduction in total runoff % reduction in peak flow
24
14
13
12
14
15
12
(5)*
(6)
(8)
(8)
(11)
(8)
Soil degradation % reduction in total runoff % reduction in peak flow
0
−9
−9
−9
−9
−4
−8
(−20)
(−17)
(−15)
(−13)
(−7)
(−11)
* The numbers in parenthesis are expected values of changes, if different from corresponding medians
Fig. 7. Prediction uncertainty bounds for the end of June–beginning of August, 2007. 90% high probability density interval is shown as medium grey area; the blue dots are measured data; and the dashed lines indicate flow range streamflow gauge was calibrated on.
5
Conclusions
This study illustrated a simple method of conditioning hydrological model parameters on prior information in order www.hydrol-earth-syst-sci.net/13/893/2009/
to simulate runoff under current conditions and future land management scenarios. The prior information about current conditions, in this case, came almost entirely from the BFIHOST index from a national database of soil types. Under Hydrol. Earth Syst. Sci., 13, 893–904, 2009
902
N. Bulygina et al.: Conditioning rainfall-runoff model parameters for ungauged catchments
the case study catchment (Pontbren, a 12.5 km2 upland catchment in Wales), the conditioned model was shown to simulate observed flows to an impressive level of accuracy in a wet winter period. Due to the simplicity of the evapotranspiration model and also due to the fixed split of effective precipitation between slow and fast stores, the method did not perform so well in a drier period, and is not expected to perform so well on relatively permeable soils. Under land management scenarios, new posteriors for BFIHOST and interception losses were introduced based on best available knowledge, providing probabilistic predictions of land management effects on flood runoff. Two speculative scenarios were investigated: 1) returning the catchment to a pristine woodland landscape through afforestation and; 2) further degradation of the soil associated with over-grazing. Median values show significant impacts: for example, the changes in the largest observed flood peak at the catchment outlet were 12% reduction with afforestation and 8% increase due to overgrazing. However, Fig. 9 illustrates the high uncertainty associated with these predictions, prompting a discussion of the need for better conditioning of the model parameters. The most obvious limitations of the approach are associated with the limited information in the BHIHOST index, in particular the failure of the BFIHOST to significantly condition the soil parameters b and cmax and the fast response parameter kq , and the need for observed water levels to estimate the celerity parameter. These limitations warrant consideration of additional sources of prior information. The traditional method of developing posterior parameter distributions for ungauged catchments is to relate parameter values directly to catchment properties through regression. Various examples exist of how this might be done and which properties might contain useful information about specific parameters, although these are restricted to daily or hourly analyses (Wagener et al., 2004; Lamb and Kay, 2004; Lee et al., 2006). For example, Lee et al. 2006 found that cmax could be related to urban cover, and b to altitude (reflecting generally thinner soils at higher altitudes in their data set); while (Wagener and Wheater , 2006) found that cmax was related to steepness (reflecting generally thinner soils at higher inclines) and b to the complexity and size of the stream network (reflecting spatial variability). Additonally, kq has consistently been found to have strong regression relationships with properties controlling flashiness of catchments (e.g. Lamb and Kay, 2004; Lee et al., 2006). However, as previously noted, the traditional regression method has theoretical limitations which cause information about parameter interactions to be lost. It is also unclear whether the information from these previous studies can be integrated coherently with the Bayesian approach, due to the wish to properly represent dependencies between parameters, and between the input properties. A more promising approach to introducing additional information would be to look for additional response indices which complement BFIHOST . Ideally these indices would be independent of BFIHOST and each other, so that their disHydrol. Earth Syst. Sci., 13, 893–904, 2009
Fig. 8. The joint distributions for runoff partitioning coefficients before (α0 ) and after (αF and αD ) land use change: (a) afforestation, (b) soil degradation (HOST = 4, BFIHOST = 0.79, σ = 0.042). The contours with smaller perimeter correspond to higher density values.
tributions could be identified independently of each other, and Bayesian updating of parameters (Eq. 1) could be sequentially applied. The information content of different response indices has been explored in this context by Yadav et al. (2007) using a similar conceptual PDM model to that employed by us, applied to daily data. For example, Yadav et al. 2007 found that the high pulse count, an index of flashiness, could be identified for ungauged catchment using regionalisation. Subsequently Zhang et al. (2008) demonstrate the power of this index for conditioning the kq parameter. Similarly, significant information about the b and cmax parameters was retrieved using regionalised indices representing the runoff ratio and the flow variance. The b parameter, representing the shape of the distribution of soil moisture capacity, has been found by successive authors as difficult to identify, raising the question of whether a specially designed response index, focussing on wetting up response is needed, for example based on distributed measurements of soil moisture. The potential benefits of integrating additional response indices into the Bayesian framework are large, including reductions in ungauged catchment prediction uncertainty and allowing additional land use scenarios to be examined. The principal challenge of doing so lies largely in the regionalisation step, which generally requires analysis of large data sets. Although regionalised information about UK soils is ready-made in the form of the HOST database, it is unclear how much more useful information can be extracted from this source. Another ready-made source of regionalised data, potentially containing additional information, is the USDA’s Soil Conservation Service curve number system (USDA, TR55, 1986), although transferability of the information to UK soil classifications, land use issues, and any particular conceptual model may be problematic. It is likely that significant additional regionalisation exercises, along the lines of Yadav et al. (2007) and Zhang et al. (2008) but using larger data sets and sub-daily data, may be needed to achieve the full potential of the method. www.hydrol-earth-syst-sci.net/13/893/2009/
N. Bulygina et al.: Conditioning rainfall-runoff model parameters for ungauged catchments
903
Fig. 9. Prediction uncertainty bounds for flows at gauge 10 due to the 18th of January, 2007 rainfall event: (a) afforestation, (b) soil degradation. The solid lines are 90% high probability density intervals for current day land use, and dashed lines are 90% high probability density intervals for flow predictions due to the land use change.)
Another challenge in the context of predicting effects of land use management, is that land management may occur at small spatial scales. In our case study, the model was discretised into a 100 m square grid so that spatially discriminate interventions may be explored. In landscapes such as Pontbren, however, effective land management interventions often occur at even smaller scales, for example tree shelter belts of a few meters width (Jackson et al., 2008; Marshall et al., 2009). These scales are much smaller than scales at which the reponse indices have been estimated and regionalised. Other relevant land management interventions, althought potentially implemented at small catchment scales, may not be represented by the regional model due to lack of measurements of their effects. Tile drainage installation and drain blocking are two such examples in the Pontbren case study. The proposed methodology does not by itself address these types of issues. To do so, small-scale physics-based models or observations would be needed to generate additional information on smaller-scale response indices (Jackson et al., 2008). Estimating channel routing parameters is another issue (observed levels were used to estimate channel celerity in our application), however these parameters and their uncertainty may be estimated from channel characteristics theoretically (e.g. Koren et al., 2004). Finally, it must be noted that the land use impacts analysis presented in this paper is largely theoretical (i.e. HOST class change and interception loss modelling) and built mainly on literature review. Validation studies are required. This may be done using paired catchment or manipulation plot experimental data (Brown et al., 2005; Marshall et al., 2009), and will be one of our future work directions.
www.hydrol-earth-syst-sci.net/13/893/2009/
Edited by: R. Merz
References Bardossy, A.: Calibration of hydrological model parameters for ungauged catchments, Hydrol. Earth Syst. Sci., 11, 703–710, 2007, http://www.hydrol-earth-syst-sci.net/11/703/2007/. Beven, K.: Generalized kinematic routing method, Water Resour Res., 15(5), 1238–1242, 1979. Beven, K.: How far can we go in distributed hydrological modelling?, Hydrol. Earth Syst. Sci., 5, 1–12, 2001, http://www.hydrol-earth-syst-sci.net/5/1/2001/. Beven, K.: A manifesto for the equifinality thesis, paper presented at 3rd MOPEX Workshop, Elsevier Science, Sapporo, Japan, July, 2003. Beven, K.: Rainfall – runoff modelling, John Wiley& Sons, Inc., Chichester, 1–359, 2008. Boorman, D., Hollis, J., and Lilly, A.: Hydrology of soil types: a hydrologically-based classification of the soils of the United Kingdom, Institute of hydrology, Wallingford, 1–137, 1995. Brown, A. E., Zhang, L., McMahon, T. A., Western, A. W. and Vertessy, R. A.: A review of paired catchment studies for determining changes in water yield resulting from alterations in vegetation, J. Hydrol., 310(1–4), 28–61, 2005. Calver, A., Crooks,S., Jones,D., Kay,A., Kjeldsen,T., and Reynard, N.: National river catchment flood frequency method using continuous simulation, DEFRA, UK, 1–147, 2005. David, J. S., Valente, F., and Gash, J.: Evaporation of intercepted rainfall, in: Encyclopedia of Hydrological Sciences, edited by: Anderson, M. G., Wiley&Sons, Ltd.,1–8, 2005. Gassman, P. W., Reyes, M. R., Green, C. H., Arnold, J. G.: The soil and water assessment tool: Historical development, applications, and future research directions, Transactions of the ASABE, 50, 4, 1211–1250, 2007.
Hydrol. Earth Syst. Sci., 13, 893–904, 2009
904
N. Bulygina et al.: Conditioning rainfall-runoff model parameters for ungauged catchments
Gustard, A., Bullock, A., and Dickson, J.: Low flow estimation in the United Kingdom, report no 108, Institute of Hydrology, Wallingford, 1–88, 1992. Hough, M. N. and Jones, R. J. A.: The United Kingdom Meteorological Office rainfall and evaporation calculation system: MORECS version 2.0-an overview, Hydrol. Earth Syst. Sci., 1, 227–239, 1997, http://www.hydrol-earth-syst-sci.net/1/227/1997/. Jackson, B., Chell, J., Francis, O., Frogbrook, Z., Marshall, M., Mcintyre, N., Reynolds, B., Solloway, I., Wheater, H.: The impact of upland land mangement on flooding: insights from a multi-scale experimental and modelling programme, J. Flood Risk Man.,1(2), 71–80, 2008. DEFRA: Ripon Land Management Project – Final Report, Jeremy Benn Consultants Ltd, Skipton, UK, 97 pp, 2007. Jewitt, G.: Water and forests, in: Encyclopedia of hydrological sciences, edited by: Anderson, M. G., Wiley&Sons, Ltd., 1–15, 2005. Koren, V., Reed, S., Smith, M., Zhang, Z., Seo, D-J.: Hydrology laboratory research modeling system (HL-RMS) of the US national weather service, J. Hydrol., 291, 297–318, 2004 Lamb, R., and Kay, A. L.: Confidence intervals for a spatially generalized, continuous simulation flood frequency model for Great Britain, Water Resour., 40(7), W07501, doi:10.1029/2003WR002428, 2004. Lee, H., McIntyre, N. R., Wheater, H. S., and Young, A. R.: Predicting runoff in ungauged UK catchments, Proc. Inst. Civ. Eng. Water Manage., 159, 129–138, 2006. Marshall, M., Frogbrook, Z., Solloway, I., Reynolds, B., McIntyre, N., Wheater, H., Jackson, B., and Francis, O.: The impact of upland land management on flooding:results from an improved pasture hillslope, Hydrol. Process., 23(3), 464–475, 2009. McIntyre, N. and Marshall, M.: Field verification of bed-mounted acoustic Doppler velocity meters, P. I. Civil Eng. (WM0), 161(4), 199–206, 2008 McIntyre, N., Lee, H., Wheater, H., Young, A., Wagener, T.: Ensemble predictions of runoff in ungauged catchments, Water Resources Research, 41(12), W12434, doi:10.1029/2005WR004289 , 2005. Montes, S.: Hydraulics of open channel flow, ASCE Press, Reston, VA, USA, 1998 OConnell, P. E., Ewen, J., ODonnell, G., and Quinn, P.: Is there a link between agricultural land-use management and flooding?, Hydrol. Earth Syst. Sci., 11, 96–107, 2007, http://www.hydrol-earth-syst-sci.net/11/96/2007/. Orellana, B., Pechlivanidis, I., McIntyre, N., Wheater, H., Wagener, T.: A toolbox for identification of parsimonious semi-distributed rainfall – runoff models: application to the Upper Lee catchment, in: International Congress on Environmental Modelling and Software, edited, Barcelona, Spain, 1–8, 2008. Packman, J., Quinn, P., Hollis, J., and O’Connell, P.: Review of impacts of rural land use and management on flood generation, Short term improvement to the FEH rainfall – runoff model: technical background, DEFRA, London, UK, 1–66, 2004.
Hydrol. Earth Syst. Sci., 13, 893–904, 2009
Robinson, M., Cognard-Plancq, A. L., Cosandey, C., David, J., Durand, P., Fuhrer, H. W., Hall, R., Hendriques, M. O., Marc, V., McCarthy, R., McDonnell, M., Martin, C., Nisbet, T., O’Dea, P., Rodgers, M., and Zollner, A.: Studies of the impact of forests on peak flows and baseflows: a European perspective, Forest. Ecol. Manag., 186(1–3), 85–97, 2003. Singh, V.: Kinematic wave modeling in water resources, John Wiley & Sons, Inc., New York, 1399 pp., 1996. Sivapalan, M., Takeuchi, K., Franks, S., Gupta, V. K., Karambiri, H., Lakshmi, V., Liang, X., McDonnell, J., Mendiondo, E., O’Connell, P., Oki, T., Pomeroy, J., Schertzer, D., Uhlenbrook, S., and Zehe, E.: IAHS decade on Predictions in Ungauged Basins (PUB), 2003-2012: Shaping an exciting future for the hydrological sciences, Hydrol. Sci. J.-J. Sci. Hydrol., 48(6), 857–880, 2003. Stewart, J. B. and Thom, A. S.: Energy budgets in pine forest, Q. J. R. Meteorol. Soc., 99(419), 154–170, 1973. United States Department of Agriculture, Urban hydrology for small watersheds, TR 55, 1–164, 1986. Wagener, T.: Can we model the hydrological impacts of environmental change? Hydrol. Process., 21(23), 3233–3236, 2007. Wagener, T. and Wheater, H.: Parameter estimation and regionalization for continuous rainfall-runoff models including uncertainty, J. Hydrol., 1–2(320), 132–154, 2006. Wagener, T., Freer, J., Zehe E., Beven, K., Gupta, H., and Bardossy, A.: Towards an uncertainty framework for predictions in ungauged basins: The Uncertainty Working Group, paper presented at Symposium on Predictions in Ungauged Basins, Int Assoc Hydrological Sciences, Foz do Iguaco, BRAZIL, April, 2005 Wagener, T., Wheater, H., and Gupta, H.: Rainfall – runoff modelling in gauged and ungauged catchments, London, UK, Imperial College Press, 2004. Wheater, H., Reynolds, B., McIntyre, N., Marshall, M., Jackson, B., Frogbrook, Z., Solloway, I., Francis, O., and Chell, J.: Impacts of land managenent on flood risk: FRMRC WP2 at Pontbren, Imperial College London, CEH Bangor, 2008. Yadav, M., Wagener, T., and Gupta, H.: Regionalization of constraints on expected watershed response behavior for improved predictions in ungauged basins, Adv. Water Resour., 30(8), 1756–1774, 2007. Young, A. R.: Stream flow simulation within UK ungauged catchments using a daily rainfall-runoff model, J. Hydrol., 320, 155– 172, 2006. Zhang, L., Dawes, W.R., and Walker, G.R.: Response of mean annual evapotranspiration to vegetation changes at catchment scale, Water Resour. Res., 37(3), 701–708, 2001. Zhang, Z., Wagener, T., Reed, P., and Bhushan, R.: Reducing uncertainty in ungauging basins by combining hydrological indices regionalization and multiobjective optimization, Water Resour. Res., 44(3), W00B04, doi:10.1029/2008WR006833, 2008.
www.hydrol-earth-syst-sci.net/13/893/2009/