Technical Report CS-91-30, De- partment of Computer Science, Brown University,. Providence, RI, 1991. John92] Brian Johnson. TreeViz: Treemap Visual-.
Cone Trees in the UGA Graphics System: Suggestions of a more Robust Visualization Tool Oren J. Tversky Scott S. Snibbe and Robert Zeleznik
Department of Computer Science Brown University Providence, Rhode Island 02912 CS-93-07
Febuary 1993
Cone Trees in the UGA Graphics System: Suggestions for a more Robust Visualization Tool Oren J. Tversky Scott S. Snibbe Robert Zeleznik Department of Computer Science Brown University Providence, RI 02912-1910 USA (401) 863-7693
Abstract The Xerox Parc cone tree is an e�cient, practical tool for visualizing hierarchical information. It makes use of three dimensional space to display more information than is possible in two dimensions. It employs animation and interactive selection to create a focal point on the structure. Shadows and perspective serve to enhance the e�ect. In this paper, we describe an implementation of cone trees under the UGA graphics architecture. The implementation is in the FLESH language{ an-object oriented graphics language that is the core of the UGA system. The FLESH language allows for rapid prototyping of three dimensional widgets such as this. In addition to the rapid implementation, several extensions of the vanilla Xerox trees were implemented. A critique of the cone tree is o�ered, as well as suggestions for future direction of visualization of hierarchical data sets. Cone Trees, Information Visualization, Graphical Visualization, Interface Metaphors, Fisheye Views, 3D Widgets.
Keywords:
1 Introduction The problem of packing and organizing a large quantity of information into a small space has plagued graphic designers since before the advent of the modern computer. Traditionally, designers have sought to maximize the quantity of information in a given space, without overwhelming the observer. This task poses several problems in and of itself, for instance, preserving the overall structure of the information while providing detail where needed. Problems of this nature take on added importance when trying to visualize information on the limited size of a computer screen. Typically a workstation monitor is much smaller than the physical objects we obtain information from on a daily basis- a
desk, or a room for instance. Fortunately, while the limited size of the computer screen can act as a hindrance, the computational and graphical power of the machine may serve as an aid. Indeed, one of the ways to pack a lot of information on to a limited space, while maintaining overall coherency is to enlarge relatively important features and shrink relatively unimportant features. This notion, called a focus , has been implemented in several systems. In 1982, Spence and Appreley pioneered a technique they dubbed the Bifocal Display. Used for visualizing o�ce information [Spen82], their system, featured the workspace as a set of information items positioned in a horizontal strip. The display combines a detailed view of the strip with two distorted views, where items on either side of the detailed view are squashed horizontally into narrow vertical strips. In an '86 paper, Furnas introduced the concept of the Fisheye Lens [Furn86]. The lens distorts a display such that regions close to the focus appear large and in detail, while more remote regions appear in successively less detail. Sarkar and Brown extended this notion in a CHI '92 paper with a prototype Fisheye Lens browser for large graphs [Sark92a]. Previously, at CHI '91, Mackinlay, Robertson and Card invented a technique which uses 3D interactive animation to visualizing linear information [Mack91], such as time data. Called the Perspective Wall, this widget boasts a detailed center panel and two side panels receding into the distance. The use of a perspective projection results in the side panels' diminishing degree of detail. Finally, in 1992, Sarkar and Reiss [Sark92b] developed a system which allows a user to interactively stretch or shrink rectangular regions of graphs, much as stretching a rubber sheet. The previous techniques to create a focus apply to all sorts of varied data sets. With the exception of the perspective wall, the techniques do not attempt to take advantage of the special characteristics of a particular class of data sets. Robertson, Mackinlay and
Card [Robe91] realized there were speci c types of information sets which might lend themselves to specialized techniques. Hierarchical information sets (such as CSG data or Unix le hierarchies), they realized could be visualized in three dimensions without much di�culty. Furthermore, a focus could be created in three dimensions simply by using a perspective view with the objects of interest at the fore, in the same manner as the Perspective Wall. They used a Unix le hierarchy as an example, and relied on 3D rendering hardware found in most of today's graphics workstations. They dubbed their visualization tool the cone tree. However, they claim their approach does not lend itself well to arbitrary data sets, for the highly structured nature of hierarchical data is what prevents the three dimensional visualization from becoming overly complex. Arbitrary three dimensional graphs for instance might become nearly impossible to interpret if laid out in space. On the other hand, While the cone tree assumes some familiarity with three dimensions, we can argue that most computer users are familiar with spatial relations from everyday life. Biologists build three dimensional models of molecules to aid in understanding the underlying molecular structure. And, three dimensional computer paradigms are increasing in frequency. We could argue that the future user will be completely at ease in a three dimensional world, especially with the advent of new three dimensional screens and input devices. In this paper, we describe an implementation of the Xerox Parc cone trees under the Brown University UGA graphics system [Hubb91], which allows for rapid prototyping of 3D widgets through the FLESH language. The Flesh language o�ers a powerful architectureindependent, object oriented interface to this system. Our implementation takes advantage of the human mind's abilities to interpret large data sets rapidly. This is after all one the premises of the original cone tree. We add several visual cues, such as color, size and shape, to the vanilla cone tree. These additional coding channels enhance the utility of the cone tree as a useful information visualization tool. Finally, we point out some of the limitations of the cone tree- both practical and theoretical.
an object may be a camera, a directory, or a molecule, for example. Under this paradigm, scenes are described as collections of objects, while animations are described in terms of scenes over time. Objects belong to object classes which dictate object behaviors. As in traditional object oriented paradigms, objects have methods associated with them. The geometric objects (spheres, cubes, super quadric etc.) for instance, have drawing methods associated with them. Other more complex objects might have other methods associated with them. For instance, a molecule object might be able to calculate the electro-magnetic force it exerts on its neighbor molecules. Furthermore, objects may make inquiries of other objects, so that they may interact with one another. We call such inter-object connections dependencies. For instance, a cube may inquire a sphere's position and change its own color based on the sphere's position at a given time. The UGA system interprets the FLESH language through its graphical modeler/animator Trim. Trim allows for interactive modi cation of FLESH scripts through its Macintosh-style user interface, as well as through a more traditional command-line interface. Animations and three dimensional widgets may be built through Trim or written in a text editor in FLESH and then interpreted through the modeler/animator.
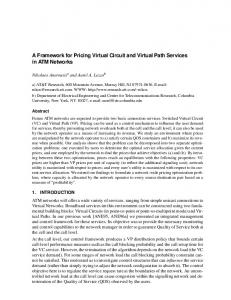
2.2 Implementation The rst cone trees we implemented described the CSG hierarchy of a modeled object. Selection of an object, and subsequent depression of a three dimensional button generates the CSG hierarchy of the selected CSG. The resulting hierarchy (see Figure 1) is displayed on the screen. Note the model cone at the left of the gure. This is actually a three dimensional widget which can be resized by pulling on the silver spheres. Resizing the model cone causes the dimensions of all the cones in the cone tree to resize. The remaining features discussed in the original paper are supported as well. These include: pruning of a branch of a tree (we call this elision), selection of a node, and moving around in the three dimensional scene with simple mouse controls. Shadows are used for reference purposes, and animation is used to rotate selected nodes to the fore. Searches, such as those described in [Robe91] are not yet implemented. A simple working version with no bells and whistles was implemented in a matter of hours by Robert Zeleznik. The nal version took Scott Snibbe about a week to complete. The code is almost entirely in FLESH, with a few C extensions to provide access to CSG structure information.
2 Cone Trees: the rst implementation 2.1 Flesh
FLESH is an object-oriented animation and modeling scripting language. Under the FLESH programming language, scenes over time are described through \objects." Objects may have a geometric representation, e.g. a cube, a mannequin associated with them, or may have no geometry associated with them at all. Indeed, 2
Figure 1: The CSG hierarchy cone tree
3
3 Extensions
are accustomed to distinguishing between large objects and far away ones on a daily basis. For all of its de ciencies, however, scaling each node by the logarithm of its size in bytes and clamping the minimumand maximum size appeared to be an e�cient means of nding general trends in le sizes. Such questions as: where in the directory hierarchy are there a lot of large les, or does this directory structure take up a lot of disk space are easy to answer based on a few seconds of visual scanning.
The second version of the tool modeled a Unix le hierarchy, extending the visualization tool by reapplying some of the underlying principles of the cone tree. This modi ed version of the cone tree, written on top of the old version by Oren Tversky takes advantage of human cognitive abilities. Just as, the cone tree works because of the mind's ability to extract structure from a three dimensional image, so too can the mind interpret other large scale graphical information presented to it. The cone tree codes structural information by using spatial relations to represent semantic information. Text is also used to encode additional information (in this case a Unix le name). It makes use of animation and perspective as well. It does not however use color, or shape or size as an additional channels for transmitting information.
3.1.2
Color Coding
Color was used to cue le age. Shades varying from red to pink indicate last access time to that le/directory (see Figure 3). This technique, color cuing, was also found to be e�ective by users. 3.1.3
3.1 Additional Channels
Icons (Shape)
Finally, trivial \icons" were used to indicate le type (see Figure 4). Triangular pyramids indicate exeFor our example we encoded additional le information cutable, while the ellipsoids indicate directories and the by using other visual channels available to us. We did scaled cubes indicate normal les. Obviously this codnot use sound or other media. We encoded le size, ing scheme can be extended by adding many more types le age and le type using size, color and shape respec- of les/nodes, and by developing more suggestive icons tively. The principle behind this is the that the mind therefore. Hardware texture mapping might be used to can interpret shape, color, size and spatial relations very generated detail in the three dimensional icons. quickly and notice other such similar trends much more e�ciently than it can read a le name on a far away screen. The cone tree is not a good tool for nding a 3.1.4 Range Control single le in a tree structure. It is an excellent tool for We should note that with all of these techniques it would determining general trends (e.g. which directory has be useful if there was a user interface to provide clampa lot of les?) Likewise, the visual channels we chose ing of values by the user. This would be especially useare good for giving a general impression of an overall ful if the range of the data is large. For instance, a structure. user may be interested in examining les modi ed with in the last week. Determining which les were touched on Tuesday and which on Wednesday might be impor3.1.1 Size Coding tant but with les that are as old as a year, it would File size, while in some ways the most successful en- be di�cult to display the full range with color detail in coding technique su�ered from two major drawbacks the desired range of the user. Allowing for interactive (see Figure 2). Firstly, the change in size of the nodes control of the color-mapping functions might solve this was dramatic. Attempts to clamp a maximum size problem. worked reasonably well, but ideally a new layout algorithm should be incorporated to take node size into 3.2 Controlling the Visual Complexity account. Obviously if the size of the nodes could be toggled on and o� a smooth animation between the multi- Extending this notion even further, it might be exsized layout and the mono-sized layout should be ap- tremely useful to be able to turn on and o� the complied in the hopes of maintaining the user's visual men- plexity. Our interface allows the user to selectively turn tal map [Eade91]. Moreover, some would argue that on or o� any of the additional visual channels we have scaling nodes relative to each other destroys the focus added (see Figure 5). The ability to selectively concreated by the perspective view. While this argument trol the complexity of the scene is important in order may have some merit, using shadows partially compen- to insure the user is not overwhelmed with data. sates for this. With shadows, we can distinguish beIndeed, other methods for simpli cation ought to be tween a node that is twice as big and half as far as a added to the tool. We have already discussed elision of another node. Without shadows, two such nodes would an entire branch, but similar pruning based on, for expossess identical three dimensional forms. Also, humans ample minimum le size might be useful as well. Sim4
Figure 2: The Unix size coding tree
5
Figure 3: The Unix color coding tree
6
Figure 4: The Unix Icon coding tree
Figure 5: Visual complexity interface 7
A
A
B
F
C
E
D
B
C
D
E
F
Figure 6: Reordering the structure ilarly the ability to elide all nodes which do not have children might simplify the tree even further and give even more clue as to the overall structure of the cone tree.
Figure 7: TreeViz Treemap
3.3 Other Possibilities
The original Robertson, Mackinlay and Card cone tree paper mentioned the use of shadows as a three dimensional depth cue. We attempted to carry this notion one step further. We allowed selection of a node by means of selection of its shadow below. Unfortunately this produced poor results, for while shadows provide an important cognitive clue as to the location of a three dimensional object in space, the inverse problem (namely locating a three dimensional object based on its two dimensional shadow) becomes much more di�cult to solve. We have not, however completely given up the notion that shadows could be used as more than a depth cue [Hern92]. If, for example, the only objects whose shadows appeared on the oor would be parents with children (in our case only directories), and the shadows were labeled as above, selection of nodes by their shadows might become practical. Indeed, it might even become more e�cient. The two dimensional shadow map (similar to what we discussed in Section 3.2) would represent a higher level pruned structure, while the three dimensional structure would possess all of the nodes. General searches by the user could be conducted in the two dimensional shadow space, and more detailed examinations could be found by using the three dimensional tool. Furthermore, while the cone tree makes use of the extra space a�orded by the additional dimension, shadows displaying solely only parent nodes might very well t in two dimensions for many cases. In Section 1, we spoke of the how visualization methods often seek to create a focus . Some of the techniques discussed even allow for multiple focal points (see [Sark92b]). Because of the perspective projection however, we cannot do this. Under the current cone tree implementation we are restricted to an ordering of children that is determined by the directory reading algorithm. We cannot place two subdirectories near each other in order to better compare them. User controlled operations, such as those illustrated in Figure 6 would be useful.
Figure 8: Traditional tree layout
4 Limitations
When we discussing the pros and cons of cone trees as a visualization tool, we must also keep in mind the limits of the tool. For instance, cone trees are only practically e�ective with a reasonable number of nodes on the screen. Too many nodes both slow down the speed of animation, and add visual clutter to an already complex three dimensional model. If we know that we will be dealing with a large data set, we might be better o� using a system such as [John92] (the author claims up he can clearly display up to 1000 nodes may be displayed on a 13" monitor with his system), which lays out hierarchical data as a Venn diagram (see Figure 7). Or, we might resort to the conventional two dimensional tree representation (see Figure 8) and the use one of the aformentioned algorithms for generating a focus. (Side Note: it might be possible to do a Stretchtools [Sark92b] style scaling in three dimensions coupled with an orthogonal view and a three dimensional screen to obtain multiple foci. It might also be possible to accomplish this with volume warping). Also, while cone trees appear to be an excellent tool 8
for obtaining a general impression of a structure, they Conf. on Human Factors in Computing Systems, are de cient as a tool for small scale searches. In other pp. 173{179, 1991. words, this tool should be used to gain a \snapshot" of a tree in conjunction with other visualization tools- not [Mill92] Michael Mills, Jonathan Cohen and Yin Yin Wong. A magni er tool for video data. Proc. ACM as the sole visualization tool. SIGCHI Conf. on Human Factors in Computing Systems , pp. 93{98, 1992. [Robe91] George G. Robertson, Jock D. Mackinlay, and Stuart K. Card. Cone Trees: Animated 3D visuWe have found cone trees to be an e�ective and easy to alizations of hierarchical information. Proc. ACM implement technique for visualizing hierarchical data. SIGCHI Conf. on Human Factors in Computing There are several additional channels which can also be Systems , pp. 189{194, 1991. used able to encode additional information beyond the standard textual node names in a subtle way. In en- [Sark92a] Manojit Sarkar and Marc H. Brown. Graphcoding such information, however, the notion of user ical Fisheye Views of Graphs. Proc. ACM SIGCHI controlled visual complexity is key in making such a Conf. on Human Factors in Computing Systems , technique practical. We believe that many of these nopp. 83{91, 1992. tions can be extended suggestions for future research into three dimensional visualization paradigms. Per- [Sark92b] Manojit Sarkar and Steven P. Reiss. Manipulating Screen Space with StretchTools : Visualizhaps cone trees, coupled with other more conventional ing Large Structure on Small Screen. Technical Revisualization techniques, might provide valuable insight port CS-92-42, Department of Computer Science, into the semantics and structure of hierarchical data. Brown University, Providence, RI, 1992. [Spen82] Robert Spence and Mark Apperley. Database navigation: An o�ce environment for the professional. Behavior and Information Technology , vol. [Eade91] Peter Eades, Wei Lai, Kazuo Misue and Kozo 1, no. 1, pp. 43{54, 1982. Sugiyama. Preserving the mental map of a diagram. Research Report IIAS-RR-91-16E, Interna-
5 Conclusions
References
tional Institute for Advanced Study of Social Information Science , Fujitsu Laboratories Limited,
August, 1991. [Furn86] George W. Furnas. Generalized sheye views. Proc. ACM SIGCHI Conf. on Human Factors in Computing Systems , pp. 16{23, 1986.
[Hern92] Kenneth P. Herndon, Robert C. Zeleznik, Daniel C. Robbins, D. Brookshire Conner, Scott S. Snibbe and Andries van Dam. Interactive Shadows. Proc. ACM SIGGRAPH and SIGCHI Symp. on User Interface Software and Technology, accepted
for publication 1992. [Hubb91] Phillip M. Hubbard, Matthias M. Wloka, and Robert C. Zeleznik. UGA: A Uni ed Graphics Architecture. Technical Report CS-91-30, Department of Computer Science, Brown University, Providence, RI, 1991. [John92] Brian Johnson. TreeViz: Treemap Visualization of Hierarchically Structured Information. Proc. ACM SIGCHI Conf. on Human Factors in Computing Systems , pp. 369-370, 1992.
[Mack91] Jock D. Mackinlay, George G. Robertson and Stuart K. Card. The perspective wall: Detail and context smoothly integrated. Proc. ACM SIGCHI 9