hand-coupled rotation, fish-eye zooming, coalescing of dis- tant nodes ... attempt to allow a user to view large hierarchies, centered around the use of three ... straight-forward cone tree implementation has three major ..... The selective processing of information thus ... This directed acyclic graph is generated at initialization.
Interacting with Huge Hierarchies: Beyond Cone Trees Jeromy Carriere, Rick Kazman Computer Graphics Lab, Department of Computer Science University of Waterloo, Waterloo, Ontario, Canada N2L 3G1 {j2carrie,rnkazman}@watcgl.uwaterloo.ca Abstract This paper describes an implementation of a tool for visualizing and interacting with huge information hierarchies, and some preliminary empirical evaluation of the tool’s efficacy. Existing systems for visualizing huge hierarchies using cone trees ‘‘break down” once the hierarchy to be displayed exceeds roughly 1000 nodes, due to increasing visual clutter. This paper describes a system called fsviz which visualizes arbitrarily large hierarchies while retaining user control. This is accomplished by augmenting cone trees with several graphical and interaction techniques: usage-based filtering, animated zooming, hand-coupled rotation, fish-eye zooming, coalescing of distant nodes, texturing, effective use of colour for depth cueing, and the applications of dynamic queries. The fsviz system also improves upon earlier cone tree visualization systems through a more elaborate node layout algorithm. This algorithm enhances the usefulness of cone tree visualization for large hierarchies by all but eliminating clutter.
1 Introduction
fsviz, which attempts to capitalize upon the use of cone trees while overcoming the size limitations which have been evident in previous implementations. Our approach to overcoming the size limitations which have hampered straight-forward cone tree implementation has three major components: 1.
presentation: we improve on the layout algorithms for cone trees, removing all visual clutter, making better use of colour and node shape, and providing fish-eye viewing, as will be discussed in sections 2 and 2.5;
2.
animation: we have implemented both automatic animation and hand-coupled rotation, as will be discussed in section 2.4;
3.
intelligent filtering: we allow users to interactively prune the hierarchy through dynamic queries, as will be discussed in section 3.
In addition to these improvements to the visualization of hierarchies, we provide the ability to directly modify the hierarchy without ever departing from the presentation metaphor, as will be discussed in section 4.
A number of systems have been implemented which attempt to allow a user to view large hierarchies, centered around the use of three dimensional visualization in general, and cone trees in particular [7]. A cone tree is a three dimensional representation of hierarchical information in which one node of a tree is located at the apex of a cone, and all of its children are arranged around the circular base of the cone. The goal of a cone tree visualization is to present a structure in such a way that the entire hierarchy, or a large percentage of it, is visible without scrolling.
This paper will describe the implementation of fsviz, showing how we use these three techniques to allow users efficient access to hierarchies of theoretically arbitrary size. We will also present some preliminary empirical results on evaluating the efficacy of fsviz. Although fsviz could be used to interact with any hierarchy, we will exemplify its use in the domain of a Unix file-system hierarchy.
A few groups ([7], [9]) have constructed prototype visualization tools using cone trees. However, these systems all lose their efficacy once the hierarchy to be visualized exceeds approximately 1000 nodes, primarily due to a prohibitive level of visual clutter. In [6] the authors state “there are limits to the size of the hierarchy that can be effectively displayed. . .more than about 1000 nodes, 10 layers”. This paper describes a research system, called
Visual effects or ‘‘channels”, such as colour, text, shape, and size, are the mechanisms by which information is conveyed to the user. Choosing appropriate channels involves determining which information is interesting and/ or useful to the user, determining which channels are available (from a technical point of view), and mapping channels to information to be conveyed. Also, problems of ‘‘information overload” must be considered.
2 Presentation
2.1 Colour
2.2 Shape
Previous cone tree implementations (operating in the same problem domain) made use of colour in various ways, such as using varying colour to indicate the age of files represented in the tree. In the implementation presented here, colour conveys file size. A smooth range of colour is more likely to intuitively indicate increasing file size: the greater the saturation of the colour, the larger the file.
3 dimensional node shape was adopted as an alternative to texturing of the nodes. From initial prototyping with fsviz, we have observed that users can easily pick out files of different types when the nodes representing those files are different shapes. This scheme has the advantage that node shapes remain distinctive even at relatively low resolution. Even at a resolution of 10 pixels by 10 pixels, different node shapes are easily distinguishable. This is not true of most other visual channels, such as texture [9].
However, this is an inefficient use of colour, because files are not evenly distributed by size: the median size for a file in a Unix file-system is approximately one kilobyte [5]. Therefore, a distribution of colour that maps a larger number of shades to files that have sizes between zero and 1024 bytes is required. Recent samples collected at the University of Waterloo show only a slightly different distribution from that in [5]. Thus, our scheme maps ranges of file sizes to colours such that equal colour distribution is given to size ranges containing an equal number of files. For example, files smaller than 256 bytes are shown in green and files between 256 bytes and 1K are shown in blue---the particular colours are chosen arbitrarily. Within these ranges, the saturation of the colour varies with size. Also, the colour of arcs connecting nodes in the tree indicates the depth in the tree of the node at the ‘‘top” of the arc. As you move down the tree, the colours of the arcs change smoothly from blue to red. This application of colour is especially useful when the tree is being viewed from the top---it is very easy to identify the hierarchical relationship between nodes, even though only two dimensions are being used.
The adopted scheme maps C language source files to spheres, executable files to tetrahedra, and other files to cubes. While other geometries could easily be added to represent more file formats, there is undoubtedly a point at which further node shapes will not improve the visualization. It should be noted that in the printed representation of the visualization, it is difficult to distinguish node shapes. These shapes are easily distinguished (at the resolution mentioned above) on the screen.
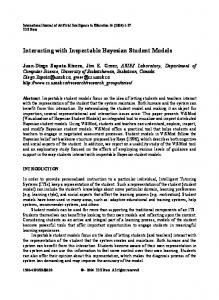
2.3 Text While colour, shape, and size of nodes are useful cues for identifying either continuously varying data (such as size) or discrete data with a small range of values (such as file type), they are not useful for presenting data such as file names. This information is conveyed via text placed near the nodes in the tree. The text scales and rotates along with the tree such that it always faces the viewer. An example of a tree indicating the use of text and shape is given in Figure 1.
Another application of colour is used for colouring the arcs in the tree. We map the type (and hence colour) of the file represented by the node at the ‘‘lower” end of an arc to the colour of the arc. 2.1.1 Possible Enhancements Rather than basing the distribution of colours of nodes in the tree on a pre-calculated statistical summary of file sizes, an accurate distribution of colours, and their saturation levels, could be calculated at runtime. However, this poses its own problems as a user may have difficulty in adapting to a colour scheme that changes from file-system to file-system. At the least, the ability to revert to a standard colour scheme should be included. In addition, colour must be used in such a way that the information which it conveys is attainable through other visual channels such as texture, since a large percentage of the population is at least partially colour-blind.
2
Figure 1: A Tree Showing Node Shapes and Labels
2.4 Animation Animation is applied in two forms within fsviz. The first is hand-coupled rotation, in which the user can directly manipulate both their view of the cone tree structure and the orientation of the cone tree’s subcomponents. In previous studies, such as [10], hand-coupled rotation has been shown to be an effective aid to the human cognitive processes when working with three dimensional constructs. Also, the software provides automatic animation in two ways. First, the user can select a set of nodes in the tree and fsviz will perform sequence of ‘‘zooms” to bring the user directly to that set. Second, when a file is selected using the file information browser, the node representing that file will be rotated to the front of the tree. This rotation is accomplished step by step from the node upward to the root. The node first rotates to the appropriate side of the cone in which it resides, then its parent rotates to the front of its cone, and so on, until the root is reached. In this way the user can keep track of the transformation that is taking place. This second technique is similar to that used in [7].
2.5 Tree Layout While a simplistic node layout algorithm for cone trees often produces satisfactory results for small trees, such algorithms are often inadequate for large hierarchies (even for more than a hundred nodes). A simple algorithm may determine the radii of the sub-cones within the tree based solely on the depth of the parent node in the tree. For example, consider the function: R ( h) =
Ri h+1
Here, R(h) represents the radius of a tree at height h, and Ri is some fixed initial radius. Determining cone radii using this function produces satisfactory tree layouts for small trees. However, the applications of cone tree techniques to large information hierarchies are more interesting. We therefore require a more elaborate scheme for tree layout. Other attempts at reducing clutter in visual representations of hierarchical information have used a radically different mechanism for display, such as [3], [4]. These algorithms can be quite effective, and may be applicable in concert with the layout algorithm described below. fsviz also addresses the idea of ‘‘focus” and fish-eye viewing, as described in [3], in concert with dynamic queries. Because there is no restriction that a tree to be visualized will be fully n-branching, as is assumed by [4], one
3
can effectively allocate space around the radii of the cones in the tree to accommodate the children. In this way, all overlap between subtrees can be eliminated. Overlap in this sense refers to the intersection of individual cones in the three-dimensional tree, rather than the visual overlap that occurs when the three-dimensional representation is projected onto two dimensions. i+1 height n-1
rn,i+1 i
rn,i θi
i-1
rn-1,j
rn,i-1
height n
Figure 2: Tree Layout
The algorithm used by fsviz commences layout at the bottom of the tree (at level n) with a cone radius based linearly on the number of nodes in the cone. At all levels above, the circumference for a cone at level n-1 is estimated by: C n − 1 ≅ 2 ∑ r i, n i
where ri,n is the radius of child i at level n. The radius is then calculated with: rn =
Cn 2π
Also, the arc length required for a child will be estimated by: s i ≅ r i − 1 , n + r i, n
Subtrees are placed around the cone, with angles defined by: θi =
si rn
≅
r i − 1 , n + r i, n rn
In this way, each cone occupies as much space as it requires in its parent’s cone. Finally, to continue proper layout, the radius of the largest child is added to the required radius of the parent. This adjusted radius is used for the remainder of the layout
calculations (up the tree), and the original radius is used for rendering. A top view of a rendered tree is shown in Figure 3, demonstrating this layout algorithm in operation. It is important to note that overlap is only truly eliminated when the number of nodes in each cone is large. This is due to the fact that the approximation to the circumference of a cone breaks down when that cone has few children. A typical example is the case in which a node has two children, both of which are very large---the circumference of the node’s cone will be estimated as the sum of the radii of the two children, which is obviously too small, and the children will overlap. This problem is addressed in fsviz by scaling each cone up by a factor which varies inversely as the number of children in the cone and directly as the ratio between the largest child and the estimated parent radius. This technique has proved appropriate in practice.
where x is the node being considered, y is the current focus, and root is the root node. fsviz applies dynamic queries in an implementation of fish-eye views, as described in section 3.3.
2.7 Automatic Subtree Coalescing A final graphical, as opposed to semantic, technique was applied in fsviz to reduce the number of nodes displayed at a given time. Whenever a subtree is sufficiently distant from the user’s focus node so as to be practically of no interest to them, the subtree is collapsed, or coalesced, into a single graphical representation. This representation is currently a tetrahedron, whose colour reflects the size of the directory itself. The threshold distance beyond which this coalescing takes place is adjustable, via a slider. .
Figure 4: A Coalesced Tree
Figure 3: A Top View
Figure 3 and Figure 3 show two views of the same tree, the first with distant subtrees coalesced and the second, where the user has zoomed in slightly on the tree, with those same subtrees expanded.
2.6 Fish-eye Viewing Fish-eye views, as defined in [3] and [8], are motivated by the desire to satisfactorily balance local detail and global structure (or context) when displaying data visually. The basic mechanism depends on a Degree of Interest (DOI) function which defines the ‘‘importance” of a particular node in the structure. An a priori importance typically plays a role in the DOI function. Nodes are then displayed based on their relationship to a threshold importance. A typical example using tree structures defines the a priori importance of a node as the negative distance from the root of the tree to that node. The distance from a particular node, called the focus, completes the DOI function: DOI fisheye ( tree) 〈x|y〉 = − 〈d tree ( x, y ) + d tree ( x, root ) 〉
4
Figure 5: The Same Tree Expanded
This technique serves two purposes: it produces an improvement in rendering efficiency, since fsviz does not attempt to render distant nodes (which are so small as to have little meaning to the user), and visual clutter is reduced. For example, when attempting to render very large numbers of small nodes and arcs, one typically runs into anti-aliasing problems. This is eliminated by coalescing distant sub-trees into a few, relatively large polygons.
3 Information Filtering
be specified in order to prune the tree, as above.
The application of dynamic queries ([1], [2]) to the visualization of hierarchical structures has not been explored in previous cone tree prototypes. Dynamic queries are a direct manipulation mechanism for databases which allow ‘‘users to formulate queries with graphical widgets, such as sliders” [2] rather than in a separate query language. The results of the query immediately affect the information presented. For example, the fsviz implementation of dynamic queries allows the tree to be pruned or expanded---nodes are hidden or shown---based on the value of some attribute of the nodes, such as file size or usage frequency.
This technique is very powerful, as it captures the intuitively appealing notion that the nodes which have been of greatest interest to the user in the past are those likely to be of interest in the future.
By allowing a user to dynamically specify queries and have these queries control the class of information visualized, we can utilize fsviz as a semantic filter. By doing so, we can access arbitrarily large information landscapes, under the assumption that the user can narrow the scope of the search---and thus the information which needs to be visualized---through dynamic queries. The coupling of our improved layout algorithm and dynamic queries means that a user can start by visualizing an arbitrarily large hierarchy, and through a sequence of dynamic queries, zooms and animated rotations, quickly locate a small section of interest within the hierarchy. Three examples of dynamic queries using fsviz are now presented.
3.1 Node Size Queries As mentioned above, node size is one possible attribute that could be used for dynamic queries. fsviz allows the user to dynamically hide nodes which represent nodes which are larger than some maximum size or smaller than some minimum size. The maximum and minimum sizes are adjustable dynamically using a doublebox slider. The tree display changes dynamically when the maximum or minimum node size is modified by the user. When one of the size bounds changes, the tree is redrawn, with nodes representing nodes with sizes outside the specified range not displayed.
3.2 Frequency of Usage Queries Another interesting application of dynamic queries to the visualization of hierarchies addresses the relative usage frequency of the nodes in the hierarchy. That is, how often a particular node (in our example, a file) has been accessed, relative to the other files in the tree, becomes another attribute of the node representing the file. Maximum and minimum values for this attribute can then
5
Several techniques were considered for the collection of file usage measurements. The most effective but most difficult to implement scheme is that of hooking the underlying file-system, so that accesses to files can be recorded by the kernel when files are opened. This scheme also offers considerable flexibility as different types of accesses can be recorded individually. While this scheme offers the greatest functionality, it is usually difficult to rebuild the kernel of a multi-user computer. For this reason, a second, simpler scheme was adopted for prototyping purposes. This second approach utilizes a modified shell to record occurrences of file names on command lines. The numbers collected using this mechanism supply an approximation to actual file access measurements. Once executing, fsviz allows the user to specify maximum and minimum access counts for the files that should be displayed in the tree. As with dynamic queries on file size, the tree display is updated dynamically when the maximum or minimum values are changed.
3.3 Implementing Fish-eye Viewing As mentioned above, in section 2.6, fsviz implements fish-eye viewing using dynamic queries. The system implements the DOI function which bases node importance on the node’s distance from the root and on the node’s distance from the current focus. A double-box slider is then used, as for other dynamic queries [1], to select a range of DOI values. Nodes with degrees of interest outside the specified range are pruned from the tree. In this way, the fish-eye technique implemented is a semantic fish-eye, rather than a graphical fish-eye as described by [8].
4 Tree Manipulation While previous cone tree efforts provide mechanisms by which the displayed tree structure can be manipulated, they provide little or no functionality for manipulation of the information hierarchy. fsviz goes beyond previous cone-tree implementations in that it not only displays huge hierarchies, but allows users to control the underlying information structure without leaving the underlying presentation metaphor. For example, a ‘‘drag-and-drop” interaction capability was added to allow users to move and copy subtrees from place to place. Furthermore, a combination of control panel buttons and tree selections allow directory creation and ‘‘find” operations.
Figure 6: The Main Window Showing a Large Hierarchy
The user interface for fsviz comprises three windows. The main window (Figure 3) contains the rendering of the directory and file hierarchy. A control panel contains a file information browser (showing details on selected files as described below) along with a number of buttons used to control the operation of the program. A visual key window describes the meaning of the various types of visual information used in the rendering, such as node colour and node shape. The user can select individual nodes in the tree structure by pointing and clicking. When selecting nodes with children, further mouse movement and button combinations allow rotation of the subtree. Functionality to shrink, enlarge, and collapse subtrees is also in place. The collapse feature is convenient when browsing larger structures; subtrees that clutter the view can be collapsed to a ‘‘tag” node, shown as a black disc. Shrink and enlarge operate similarly, allowing control over the radii of individual subtrees. Other interaction techniques including zooming to a selected node and, for nodes that are symbolic links, zooming to the linked-to node. Also, any node in the tree can be made the apparent root, hiding all nodes not descendants of this new root. In this way, the focus can be shifted to a particular portion of the tree. A small stack of root nodes is maintained to allow the user to progressively refine their focus in the tree.
6
4.1 Possible Enhancements In [6] there is a description of cam trees, in which the tree grows left to right rather than top to bottom. Such a modification to the software would be almost trivial and may ease some of the text display issues that arise. The implementation of Tversky et al [9] permitted the user to enable and disable individual channels of visual information. The selective processing of information thus made possible may be of substantial benefit to the visualization process. This also suggests possible enhancements of configurability, such as allowing the user to dynamically allocate visual channels to particular features of the underlying structure. One possible feature would permit the user to choose the file type to node shape mapping according to personal preference. Although configurability lends considerable flexibility to a visualization system, one must be careful not to place too much weight on it at the expense of a useful base-level allocation of the visual channels to more important aspects of the available information. Further user interaction issues include:
• the ability to arbitrarily reorder nodes in the tree. In this way, users could group nodes they wish to consider together;
• animation techniques beyond the simple ‘‘zoom-andpan” scheme implemented here. A more elaborate animation sequence that simulates a tree ‘‘fly-
through” might be an effective visualization mechanism.
5 Implementation fsviz is currently implemented under the Silicon Graphics Graphics Library (GL), running on both the IRIS Indigo/XS24 and the Onyx/Reality Engine. There are two primary data structures employed in the implementation of fsviz. The first is a multi-way tree that is constructed at initialization time from the file-system information. Each node in this tree represents a file or directory and contains file-system information (returned by stat()) and layout information such as node location in a modeling coordinate system. Also, if the node is representing a directory, it will contain pointers to the node’s children. The second data structure used is an object hierarchy. This directed acyclic graph is generated at initialization time from the multi-way tree. The hierarchy contains the transformations to place nodes in their correct positions, as well as all of the primitive objects used for nodes.
6 Results In the current implementation of fsviz, hierarchies larger than approximately 2000 nodes suffer from extremely poor interactive performance. Larger hierarchies, up to approximately 5000 nodes, have been successfully rendered, without breakdown of the layout algorithm. That is, hierarchies of up to 5000 nodes have been rendered without having any node obscure any other node. There is no theoretical limit to the size of the hierarchy that fsviz can display. However, as with any visualization mechanism, a lack of screen space and resolution will eventually place a practical limitation on the amount of information that can be conveyed. The point at which the screen resolution limitation manifests itself in fsviz is the hierarchy size at which some of the node shapes can no longer be distinguished, with the whole tree in view. With hierarchies larger than about 1000 nodes, some of the most distant nodes are no longer identifiable. It is important to note, however, that this limit is not due to visual clutter, as was the case with earlier cone-tree implementations. We have shown that huge hierarchies can be displayed by fsviz without visual clutter. The current limitation is merely that not all of the nodes will be detailed enough for a user to immediately perceive their semantic status---a limitation which the system ameliorates in part by allowing the user to navigate, pan, and zoom around the hierarchy, and in part by coalescing distant trees into single, large nodes. It is precisely because fsviz has eliminated visual clutter that a user is able to eas-
7
ily navigate around the hierarchy without losing context. Thus, fsviz provides a means of scaling to arbitrary large hierarchies, whereas other cone-tree implementations do not.
6.1 Evaluation A small user test was conducted to provide some idea as to the usability of fsviz. Five users were provided with a brief introduction to the operation of the application and were asked to perform three tasks in the context of a small file-system hierarchy. The tasks were: 1.
Find the largest file in the tree.
2.
Find the all files in the tree larger than 1M.
3.
Find the the 4 most frequently accessed files in the tree.
The users were then asked to perform the same tasks using standard Unix shell utilities (no particular utilities were suggested). The users had no prior experience with fsviz, but each had more than 5 years experience with Unix. The timing results collected are shown below (all times are in seconds). Subject 1 2 3 4 5
Time using fsviz Time using shell Task: 1/2/3 Task: 1/2/3 75/60/120 90/127/155 13/34/37 16/20/45 29/30/99
180/180/131/131/23/23/92/68/116/116/-
The third task was not tested in the shell environment, as Unix does not provide the facilities, in general, for file access measurements. Four of the five users solved the first and second tasks identically using shell utilities, explaining the identical times. Examining the times for completion of the various tasks, we see that in only one case was the task performed more slowly with fsviz. We construct a small-sample Student’s t statistic for the first task with the hypothesis that the mean time for performing the task is equal for fsviz and shell utilities. We find that t=-2.11, which is inside the rejection region for the α = .1 level of significance. Thus, the chances are 1 in 10 that our test could lead us to conclude that the task was performed faster with fsviz if in fact this conclusion is false. Performing the same analysis on the data from the second task, we find t=-1.48, which is inside the rejection region for the α = .2 level of significance. For this task, the chances are 1 in 5 that our test could lead us to con-
clude that the task was performed faster with fsviz if in fact this conclusion is false. As the third task was not performed in the shell environment, it cannot be used for comparison. This evaluation is obviously preliminary, and was conducted primarily to provide support for informal experience indicating the strengths of fsviz. We see some indication that fsviz is useful in performing certain tasks concerning hierarchical information. Furthermore, we conducted the study using a relatively small file system hieararchy. We expect that the advantage of fsviz would be more dramatic with a larger hierarchy. In our experience, fsviz is most suited to helping users answer structural and trends-related questions. For example, a user wishing to find a particular file in a file-system tree will not find the task faster or more easily using fsviz versus standard Unix shell tools. However, a user wishing to determine the approximate number of files whose attributes satisfy a particular set of constraints will undoubtedly have the desired results in a shorter time if fsviz is used. Tasks with a broader scope, such as determining which branches of a file-system tree contain clusters of large files, will demonstrate the strengths of fsviz even more dramatically. Looking for patterns of usage--such as ascertaining if the most frequently accessed files in a tree reside in the same directory, or finding the smallest subtree that contains all of the most frequently used files--are also tasks well suited to the structure of fsviz.
6.2 Limitations/Future Directions Robertson et al [6] considered the effectiveness of cone trees in balanced hierarchies as somewhat doubtful since it is difficult to distinguish between virtually identical substructures from a distance. The extension of cone tree-like ideas into larger hierarchies, possibly incorporating statistical summaries to give high level information should be considered. For example, in a very large structure a high level summary might show a directory containing a large number of files as a special icon coloured to indicate the average size of the files within the directory. Many extensions of this type of representation are possible.
7 Conclusions Cone trees provide aesthetically pleasing representations of hierarchical information in three dimensions. Although there is still no conclusive evidence to support their usefulness in visualizing large structures in general, fsviz addresses several of the usability issues raised by previous implementations. Such issues include the use of colour, texture, node shape, node size, and text for repre-
8
sentation of the hierarchy, as well as the possibility of user interaction with the visualized structure. By paying careful attention to node layout, we were able to address one of the most severe limitations of previous studies: we removed all visual clutter. Possibly more significantly, fsviz allows for automatic coalescing of nodes, which means that distant information is not lost, it is merely summarized into a single identifiable polygon. Finally, we have explored the composition of cone trees, as a display technique, with dynamic queries, as an information filtering technique. fsviz also goes beyond previous implementations in that it permits input in the form of user modifications to the visualized hierarchy. This permits a user to perform useful work within the visualization metaphor, rather than using it as an “output-only” tool. Future work must consider the problem of scalability to larger structures in terms of tree layout and condensation of information. Also, user-based experimentation could shed considerable light on the appropriate use of colour and other visual channels.
References [1] C. Ahlberg, C. Williamson, B. Shneiderman, “Dynamic Queries for Information Exploration and Evaluation”, Proceedings of CHI ‘92, 1992, pp. 619-626. [2] C. Ahlberg, B. Shneiderman, “Visual Information Seeking: Tight Coupling of Dynamic Query Filters with Starfield Displays”, Proceedings of CHI ‘92, 1992, pp. 619-626. [3] G. W. Furnas, ‘‘Generalized Fisheye Views”, Proceedings of CHI ‘86, 1986, pp. 16-23. [4] H. Koike, H. Yoshihara, ‘‘Fractal Approaches for Visualizing Huge Hierarchies”, Proceedings of 1993 IEEE/CS Symposium on Visual Languages, 1993, pp. 55-60. [5] S. J. Mullender, A. S. Tanenbaum, ‘‘Immediate Files”, Software—Practice and Experience, Vol. 14, April 1984, pp. 365368. [6] G. Robertson, S. Card, J. Mackinlay, ‘‘The Information Visualizer, An Information Workspace”, Proceedings of CHI’91, 1991, pp. 181-188. [7] G. Robertson, S. Card, J. Mackinlay, ‘‘Cone Trees: Animated 3D Visualizations of Hierarchical Information”, Proceedings of CHI’91, 1991, pp. 189-194. [8] M. Sarkar, M. Brown, ‘‘Graphical Fisheye Views”, Communications of the ACM, Vol. 37 Num. 12, 1994, pp. 73-84. [9] O. Tversky, S. Snibbe, R. Zeleznik, ‘‘Cone Trees in the UGA Graphics System: Suggestions of a more Robust Visualization Tool”, Technical Report CS-93-07, Department of Computer Science, Brown University, February 1993. [10] C. Ware, D. Hui and G. Grank, ‘‘Visualizing Object Oriented Software in Three Dimensions”, Proceedings of CASCON ‘93, Toronto, Ontario, 24-28 October 1993, pp. 612-620.