JRRD
Volume 45, Number 9, 2008 Pages 1295–1302
Journal of Rehabilitation Research & Development
Consistency of within-cycle torque distribution pattern in hand cycling Joeri Verellen, MSc;* Christophe Meyer, MSc; Sofie Reynders, MSc; Debbie Van Biesen, MSc; Yves Vanlandewijck, PhD Department of Rehabilitation Sciences, Faculty of Kinesiology and Rehabilitation Sciences, Katholieke Universiteit Leuven, Leuven, Belgium
[1–2], investigated the influence of different cadence strategies in hand cycling [3], and compared asynchronous and synchronous cranking during hand cycling [4– 6]. Other investigations have compared gross mechanical efficiency in hand cycling with hand rim wheelchair propulsion [7–8] or with row cycle propulsion [9]. More recently, investigations are focusing on the force-generation, movement, and muscle activity patterns during hand cycling. One investigation studied the electromyographic activity of shoulder girdle muscles during hand cycling and recommended hand cycling for the prevention of shoulder dysfunction in persons with spinal cord injury [10]. However, another study investigated kinematics during handbike sprinting in various gear ratios and the implications for joint pain and repetitive strain injury; the authors reported high amplitudes and fast angular joint accelerations of the upper limb that were near or superior to the ergonomic recommendations for injury prevention. The authors concluded that hand cycling could represent a risk factor for overuse injuries
Abstract—This investigation studied the consistency of the within-cycle torque pattern in hand cycling (1) in subsequent cycles, (2) between different individuals, (3) between different power output levels, and (4) with respect to fatigue. Ten nondisabled male participants performed a progressive peak arm crank ergometry test; a number of 5-minute submaximal tests at 10, 20, 30, and 40 W; and one 15-minute submaximal test at 80% to 90% of their peak heart rate. A hand cycle unit attached to a computerized motor allowed for power output adjustments and registered position and torque. Variation coefficients were calculated and averaged for evaluation of the pattern consistency. Values were 2.7% to 3.9% for subsequent cycles, 3.2% to 5.3% between participants, 2.8% between different power output levels, and 3.1% with respect to fatigue. These results indicate a consistent within-cycle torque distribution pattern for subsequent cycles that is minimally influenced by factors such as power output and fatigue.
Key words: arm crank propulsion, biomechanics, force generation, handbike, health, kinetics, performance, rehabilitation, sports, torque.
Abbreviations: ACC = acceleration phase, bpm = beats per minute, DEC = deceleration phase, rpm = revolutions per minute, SD = standard deviation, TO1 = first turnover phase, TO2 = second turnover phase. *Address all correspondence to Joeri Verellen, MSc; Department of Rehabilitation Sciences, Katholieke Universiteit Leuven, Tervuursevest, 101, 3001 Heverlee, Leuven, Belgium; +32-16-32-91-27; fax: +32-16-32-91-96. Email:
[email protected] DOI:10.1682/JRRD.2007.12.0205
INTRODUCTION Hand cycling has become popular in recent years, improving mobility in activities of daily living and increasing training and sports opportunities for persons with lower-limb impairments. Research in hand cycling, however, is scarce and, until recently, limited to physiological investigations. Several studies evaluated the metabolic response and race performance of handbike athletes 1295
1296 JRRD, Volume 45, Number 9, 2008
[11]. Other biomechanical determinants that affect performance during hand cycling are yet to be investigated. No data are available regarding the mechanical and ergonomic optimization of the handbike-user interface. Nor have the influence of internal and external conditions (e.g., cadence and power output levels), ergonomics, and user-related variables (e.g., experience, fatigue, and functional potential) on these parameters yet been addressed. Nevertheless, such data are important to further optimize hand cycling from a performance as well as a health perspective. To understand and analyze the force-generation pattern in hand cycling, one must gain insight on its consistency. Intraindividual consistency is warranted to address causal relationships between force-generation strategies and performance (e.g., [an]aerobic power) or healthrelated aspects (e.g., repetitive strain injuries). In a pilot study, the within-cycle torque pattern during synchronous hand cycling was already investigated. Preliminary results suggest that a consistent within-cycle torque distribution pattern exists for subsequent cycles during hand cycling and that this pattern is minimally influenced by factors such as varying power output levels and fatigue [12]. However, only two participants were recruited in that study, reducing the statistical power of the investigation. Moreover, the test protocol used did not allow for the submaximal test to be conducted at a similar power output level for both participants. Therefore, the current study was conducted to confirm the results of the previous pilot study by recruiting a larger nondisabled participant group and using a standardized test protocol and equivalent submaximal test intensities. The purposes of this investigation were to analyze the within-cycle torque distribution pattern during hand cycling and evaluate the consistency of this pattern (1) in subsequent cycles at a constant power output, (2) between different individuals, (3) between different power output levels, and (4) with respect to fatigue at a submaximal power output level.
METHODS Participants Ten nondisabled male participants (mean ± standard deviation [SD] age = 21.3 ± 1.42 years; mean ± SD height = 1.79 ± 0.05 m; mean ± SD mass = 72.4 ± 9.3 kg) agreed to participate in this study. All were moderately to very active but had no prior experience in hand cycling or
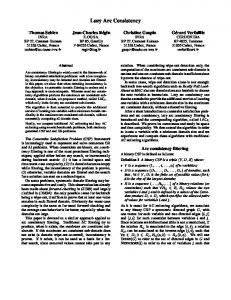
specific upper-body training. The study was approved by the medical ethical committee of the Katholieke Universiteit Leuven, Belgium, and the participants signed an informed consent form. All procedures were completed in accordance with the ethical standards as described in the Declaration of Helsinki. Procedures The study consisted of two test series with a recovery period of at least 48 hours between tests to ensure complete recovery. The first test day consisted of a progressive peak arm crank ergometry test. Participants performed this test so we could record peak heart rate values during arm cranking. Power output, 15 W at the onset of the test, was increased 15 W every 3 minutes. On the second test day, all participants performed a series of submaximal 5-minute synchronous handbike tests. Exercise tests were separated by a resting period of at least 2 minutes. Power output in the first 5-minute test was 10 W, and this was increased by 10 W per test. When a power output level was achieved during the 5-minute test that elicited a heart rate of 80 to 90 percent of the peak heart rate as determined in the previous peak progressive arm crank ergometry test, and after a resting period of at least 5 minutes, a submaximal 15-minute handbike test was performed at this power output level. Consequently, the exercise intensity was equivalent for all participants. Participants were instructed to choose a comfortable crank rate across all the tests (peak and submaximal). Ergonomic conditions on both test days were standardized with a minimal seat inclination and a hip angle of 90°. Furthermore, by adjusting the seat height and the position of the backrest, we set the crank axis at shoulder height and positioned the fore-aft, allowing near maximal elbow extension (approximately 170°) (Figure 1). Instruments The progressive peak arm crank ergometry test was carried out with an arm crank ergometer (Ergometry System 280, Elema Schönanden, Sweden). All submaximal tests were performed with a wheelchair (Quickie, Sunrise Medical; Nieuwegein, the Netherlands) to which a hand cycle unit (Stricker, Double Performance; Gouda, the Netherlands) was attached. The hand cycle unit was connected to a torque-controlled position motor (Compumotor, Dynaserv DR1070E, Parker Hannifin; Cleveland, Ohio) via a system of chains and cog-wheels (Figure 1). Computer controlled through a software program developed by engineers at the Department of Rehabilitation Sciences, Katholieke Universiteit Leuven, and using
1297 VERELLEN et al. Torque distribution pattern in hand cycling
interpolation to 360 values per cycle (one per degree of the full circular motion).
Figure 1. Experimental hand cycle setup.
weights for accurate calibration, this system allowed for precise power output adjustments. However, we were unable to conduct an incremental peak exercise test using this equipment because of power output range limitations. We had to conduct the peak and the submaximal tests using different ergometers. Data Collection Heart rate was registered every minute across all tests with a Polar Accurex Plus (Polar Electro Oy; Kempete, Finland). The computer-controlled ergometer system controlled and regulated torque to maintain the set level of power output and recorded the position of the motor with a position accuracy of 614,400 per cycle and a time accuracy of 1 registration every millisecond. Consequently, we were able to derive the position of the arm cranks with respect to time and to register the torque required during hand cycling at a given power output. Crank rate was continuously calculated to the nearest revolutions per minute (rpm) and registered and displayed as a mean per complete cycle so within-cycle fluctuations could be avoided. Data Reduction Crank position and torque were recorded by the cycle ergometer system every minute during the 5- and 15-minute submaximal tests in 10-second sampling measurements, leading to 10,000 values for each variable per measurement. All values were thereafter reduced through polynomial
Data Analysis All torque data were converted to relative values to the peak torque value within each cycle, allowing us to investigate the pattern regardless of crank rate. To evaluate the consistency of the within-cycle torque distribution in subsequent cycles with a constant power output (purpose 1), we calculated variation coefficients [13] (SD/ mean × 100) from the torque values of the first five complete cycles of the 10-second measurement. The 360 coefficients were reduced to one mean variation coefficient as an indicator of the consistency in subsequent cycles. To evaluate the consistency of the within-cycle torque distribution between participants (purpose 2), between different power output levels (purpose 3), and over time at submaximal power output level (purpose 4), we calculated one averaged propulsion cycle per 10-second measurement for each participant at each power output level. Again, variation coefficients between participants, between power output levels, and over time at a submaximal power output level were calculated and averaged, consequently leading to one mean variation coefficient as an indicator of pattern consistency for the different purposes.
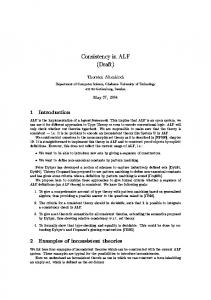
RESULTS Peak and Submaximal Responses Peak heart rate achieved during the progressive peak arm crank ergometry test ranged between 157 and 201 beats per minute (bpm) (mean ± SD = 180.0 ± 15.4). Absolute and relative heart rate data, power output, and crank rate during the 5- and 15-minute submaximal tests are presented in the Table. For the 5-minute tests, only seven participants performed the test at 40 W. Heart rate increased progressively with increasing power output; crank rate remained constant between 70 and 80 rpm. Power output in the 15-minute test ranged between 30 and 55 W (mean ± SD = 42.0 W ± 7.5 W). Mean ± SD absolute and relative heart rate were 156.0 ± 14.1 bpm and 86.0 ± 2.9 percent, respectively. Within-Cycle Torque Distribution Pattern Figure 2 gives a typical example of a torque signal in one subject cycling at 30 W and demonstrates the magnitude and change in the torque value over a 10-second
1298 JRRD, Volume 45, Number 9, 2008
Table. Resting and peak heart rate (HR) (in beats/minute) from maximal arm crank ergometry test; HR and crank rate (CR) (in revolutions/minute) from 5 min tests; and power output (PO) (in watts), HR, HR relative to maximum (%HR) and CR from 15 min test. Peak Test Submaximal 5 Min Test Submaximal 15 Min Test (n = 10) Rest Peak 10 W (n = 10) 20 W (n = 10) 30 W (n = 10) 40 W (n = 7) Part. PO HR %HR CR HR HR HR CR HR CR HR CR HR CR 1 72 160 98 76 101 64 112 61 125 69 2 91 199 113 88 155 86 177 77 — — 3 89 183 110 121 125 99 145 108 159 108 4 81 167 88 79 94 76 107 86 139 86 5 69 186 84 49 95 61 125 59 150 62 6 66 157 99 52 94 45 106 64 115 64 7 106 201 142 96 158 84 171 79 — — 8 87 183 109 45 122 45 130 47 — — 9 64 193 110 98 123 91 127 83 148 76 10 80 175 96 57 101 61 128 47 158 62 Mean ± SD 81 ± 13.2 180 ± 15.4 105 ±16.3 76 ± 25.1 117 ± 24.3 71 ± 18.9 133 ± 24.7 71 ± 19.1 142 ± 16.7 75 ± 16.9 Part. = participant, SD = standard deviation.
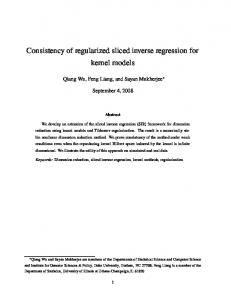
registration. The torque values presented in Figure 2 were the values generated in the motor to maintain the set power output; the transmission from motor to cranks had a gear ratio of 0.59. As a consequence, the registered absolute torque values do not represent the actual torque generation at the crank axis or at the crank handles. Exemplary within-cycle torque patterns are given in Figure 3. Relative torque values—i.e., as a percentage of the peak torque generated within each cycle—are presented on the y-axis, and segments from 0° to 360° are on the xaxis. The within-cycle torque pattern for five subsequent cycles at 20 W for one participant is presented in Figure 3(a). A comparison of the torque pattern between all participants at 20 W is shown in Figure 3(b). The influences of different power output levels and fatigue on the torque pattern for one participant are shown in Figure 3(c) and (d), respectively. Figure 4 shows the mean variation coefficients that we calculated to assess the consistency of the within-cycle torque pattern, ranging from 2.7 to 5.3 percent. Figure 5 displays the overall mean withincycle torque distribution pattern for one cycle across all tests, conditions, and participants. The cycle is divided
Figure 2. Exemplary 10-second sample registration output taken for one participant cycling at 30 W.
45 140 87 30 167 84 40 162 88 40 141 84 40 150 81 55 134 85 35 179 89 50 165 90 45 162 84 35 157 89 42 ± 7.5 156 ± 14.2 86 ± 2.9
69 66 115 84 62 67 86 66 81 83 78 ± 15.8
according to angle (per 45°) from a positional viewpoint. Using the points of inflection, one can distinguish four quadrants from a torque-related viewpoint: first turnover phase (TO1), acceleration phase (ACC), second turnover phase (TO2), and deceleration phase (DEC). The mean range of relative torque varies between 85.5 and 96.8 percent of peak torque, with the highest and lowest values at TO1 and TO2 phases, respectively, therefore showing very limited variations. In addition, standard deviations were rather low, ranging between 1.6 and 4.8.
Figure 3. Variation in mean within-cycle torque distribution pattern as percentage of within-cycle peak torque for (a) five subsequent cycles for 1 participant at 20 W, for (b) 10 participants at 20 W, and for 1 participant at (c) different power output levels (10, 20, 30, and 40 W) and (d) over time (1st–15th minute).
1299 VERELLEN et al. Torque distribution pattern in hand cycling
Figure 4. Variation coefficients for pattern consistency (VC C) between subsequent cycles at different power output levels (10, 20, 30, and 40 W), between different participants (VC P) at different power output levels (10, 20, 30, and 40 W), between different PO levels (VC PO), and with respect to time (VC T).
DISCUSSION The purposes of this study were to investigate the within-cycle torque distribution pattern and analyze its consistency in subsequent cycles, the interindividual variability, and the influence of varying power output levels and fatigue. The overall mean within-cycle torque distribution pattern is presented in Figure 5. In contrast with previously reported torque profiles in arm crank ergometry [14], the torque distribution pattern shows limited fluctuation over the cycle in the torque signal, expressing a relatively constant torque pattern despite different phases and transfers being coordinated by the upper body-arm-hand system, involving different sets and combinations of upper body muscles. We can assume that the closed-chain motion in hand cycling in combination with movement inertia and the relatively low employed workloads contribute to the occurrence of these limited pattern fluctuations. The torque distribution pattern as presented in Figure 5 can be divided into quadrants not only from a positional but also from a torque-related viewpoint. Previous investigations in cycling have already described two vertically oriented motor phases in cycling, a propulsion phase and a recovery phase, and two transition points, top and bottom dead center [15]. However, the transition curves in the present study as shown in Figure 5 are
Figure 5. Overall mean ± standard deviation within-cycle torque distribution pattern as percentage of within-cycle peak torque, divided according to angle and in four torque-related quadrants: first turnover phase (TO1), acceleration phase (ACC), second turnover phase (TO2), and deceleration phase (DEC).
stretched over a longer time period in hand cycling and can therefore be considered phases. We can assume that this longer time period is caused by differences between cycling and hand cycling regarding the user’s position to the crank axis (in front of the crank axis in hand cycling vs on top of the crank axis in cycling), the propulsion strategy (synchronous in hand cycling vs asynchronous in cycling), and the coupling of the hands at the handlebars. As a consequence, from a positional viewpoint each cycle in hand cycling theoretically comprises two horizontally oriented active components that depend on the user’s position toward the crank axis—a push and a pull phase—and two vertically oriented passive components—an assistive and a deleterious gravity phase. In combination with the ergonomic conditions and kinesiological consequences, these components lead to the withincycle torque-generation pattern presented in Figure 5, which can be divided into four quadrants: ACC and DEC, split by TO1 and TO2. During ACC, both kinesiological circumstances for the biceps muscle [16] and gravity are beneficial for force generation. As a result of these kinesiological and positional profits, cycle speed increases. Between 180° and 0° of each cycle, however, gravity is no longer assisting. Although kinesiological conditions are beneficial for the force-generation capacity of the biceps muscle [16], a turnover in cycle speed occurs from ACC to DEC (TO2), indicating less muscle activity in this phase and leading to a constant DEC during which movement relies mostly on inertia. Thereafter, gravity converts from disadvantageous to beneficial, which leads to a new TO1 from DEC to ACC until a constant ACC phase is once again reached.
1300 JRRD, Volume 45, Number 9, 2008
The variation coefficients found in this study confirm previously reported values [12] and indicate that a consistent within-cycle torque distribution pattern exists that is minimally influenced by factors such as power output and fatigue. All coefficients with respect to their specific purposes will be discussed separately in the following paragraphs. In addition, to interpret the variation coefficients obtained in this investigation, we present the range of variation across an entire cycle with respect to the different purposes in Figure 6. Regarding the consistency of the within-cycle torque pattern between subsequent cycles, calculated averaged variation coefficients ranged between 2.6 and 3.9 percent. As well, the mean spread of variation over the entire cycle was rather constant, indicating that the torque generation strategy remained similar across subsequent cycles. Variations that do occur should therefore be considered the consequence of small artifacts, such as postural shifts rather than changes in crank propulsion strategy. Mean variation coefficients in the between-subject comparison illustrate the consistency of the within-cycle torque pattern. However, the mean spread of variation showed higher values at the end of the ACC and during TO2. Evidently, despite the overall consistency of the torque pattern, differences in torque generation did occur; specifically, the pull-strategy between participants was varying. Another consideration is that hand cycling is practiced by athletes with various functional potential levels, specifically regarding arm and/or hand function and trunk stability. The participants in this study were nondisabled to neutralize the effect of functional potential and solely investigate the pattern consistency. Consequently, the consistency of the pattern, particularly with respect to between-subject variability, was not fully investigated and was presumably underestimated in this study. Further research is necessary for examination of the impact of functional potential on the torque pattern as well as the force-generation, the movement, and the muscleactivation pattern, and for interpretation of its consequences for the classification system in competitive hand cycling. Although the results in this study also demonstrated little influence of and therefore a consistent torque pattern across different power output levels, variation was not spread constantly. Because cadence remained stable across all power output levels, increases in power output originated from increased resistance. Consequently, mean variation appears to be higher between 180° and
Figure 6. Change of mean variation coefficients over entire cycle with respect to variation (a) between subsequent cycles, (b) between participants, (c) between different power output levels, and (d) over time (gridlines at 2%, 4%, 6%, and 8%). ACC = acceleration phase, DEC = deceleration phase, TO1 = first turnover phase, TO2 = second turnover phase.
270°; i.e., during TO2 and DEC, when propulsion is mostly relying on inertia. The mean variation coefficient for fatigue was 3.1 percent, indicating little impact of time (and fatigue) on the torque-generation pattern. In agreement, previous results reported that the pedaling pattern during an endurance cycling exercise remained stable [17]. However, although not quantified, an increased forward-backward movement of the trunk was observed in all participants as the 15-minute test progressed, possibly leading to changes in the propulsion strategy. This altered strategy is specifically manifested in the pull phase (between 90° and 270°), because the torque pattern has the highest variation in this section. On the other hand, the push phase remained consistent regardless of the influence of fatigue. Other compensation strategies, however, did occur during the 15-minute test as the mean pedaling rate increased from 78 rpm at the start of the test to 85 rpm at the end. We must address the drawbacks of the present study and its consequences for the results and their implications.
1301 VERELLEN et al. Torque distribution pattern in hand cycling
Different propulsion strategies (asynchronous vs synchronous) were used during the peak and the submaximal tests because of practical equipment limitations. Previous investigations conducted on a treadmill—therefore requiring steering—have demonstrated significant differences in mechanical efficiency, peak power output, and peak heart rate between synchronous and asynchronous arm cranking [4,6]. Other investigations not requiring any steering or stabilization mechanisms have demonstrated significant differences in mechanical efficiency and peak power output during synchronous versus asynchronous arm cranking [5,18–19]. However, these studies reported no differences in peak heart rate between the two crank configurations. Consequently, supported by studies conducted in arm crank ergometry and hand cycling where no steering was required, as was the case in the present study, we decided to derive the power output during the submaximal 15 minute test from a percentage of peak heart rate (80%– 90%) achieved during the peak arm crank ergometry test to ensure equivalent workloads between participants. The materials used in this study only allowed measurement of the torque at the motor axis. Because the motor torque is not equal to the crank axis torque because of frictional losses in the ergometer, the arm cranks, and the connection between both systems, the motor-generated and -registered torque values are an underestimation of the actual crank axis torque generated by the user. In addition, several force components are generated at the crank handles during hand cycling, in multiple directions as well as in multiple time phases. We can assume, however, that the frictional losses and therefore the underestimation of reported torque values are constant and do not alter the within-cycle torque distribution pattern or its consistency. Most persons active in hand cycling sports are cycling in the kneeling or lying position. Consequently, the seating position used in this study only represents recreational and a small number of sport-orientated hand cyclists, since the torque distribution pattern is expected to be determined by the ergonomic conditions. However, we can see no reason to assume that the pattern consistency will be influenced by ergonomic alterations. Participants in this study had no experience in hand cycling. To our knowledge, the effect of experience on hand cycling characteristics has not yet been examined. In addition, investigations regarding the influence of experience in cycling have reported discrepant findings
[20]. However, further research on the impact of experience in hand cycling is warranted. All the tests were performed with the participants adopting a self-chosen crank rate. To neutralize the influence of crank rate on the within-cycle torque-generation pattern, we expressed all torque values within each cycle as relative values to the peak torque value registered in that cycle. The influence of crank rate on the within-cycle torque pattern, however, was not considered in this investigation. Nevertheless, we can assume that cycle speed will influence the muscle activation pattern and, consequently, alter the torque pattern. A previous study of athletes highly trained in cycling [17] investigated the influence of power output and fatigue on the mechanical pattern and concluded that the pattern remained stable throughout 1 hour of cycling exercise performed at 65 percent of peak aerobic power output, irrespective of the cadence. However, the authors did report greater positive and negative work generated during pedaling, and peak torque angle shifts earlier in the crank cycle at higher cadences [17]. As the possible occurrence of this cadence-related within-cycle pattern shift was not compensated for in the present study, the torque pattern is not solely accounting for the variation presented in this study and the calculated variation coefficients are an overestimation of the pattern variation. As a result, we can assume that the within-cycle torque distribution pattern is more consistent than the results of this study suggest.
CONCLUSIONS The results of this investigation suggest that a consistent within-cycle torque distribution pattern exists that is minimally influenced by power output and fatigue. This pattern can be subdivided into quadrants based on position (active vs passive components) or torque generation (acceleration and deceleration phases, split by two turnovers). Further research is now necessary to fit forcegeneration strategies, movement pattern, and muscleactivation pattern into this four-quadrant model and to study the influence of various internal and external conditions, such as functional potential of the user, handbike configuration, and handbike-user interface on these biomechanical parameters and mechanical efficiency.
1302 JRRD, Volume 45, Number 9, 2008
ACKNOWLEDGMENTS We wish to extend our sincere appreciation to Double Performance (Mr. Kees Van Breukelen) and Marc Beirinckx for their material and technical support. This work was unfunded at the time of manuscript preparation. The authors have declared that no competing interests exist. REFERENCES 1. Janssen TW, Dallmeijer AJ, Van der Woude LH. Physical capacity and race performance of handcycle users. J Rehabil Res Dev. 2001;38(1):33–40. [PMID: 11322469] 2. Knechtle B, Müller G, Knecht H. Optimal exercise intensities for fat metabolism in handbike cycling and cycling. Spinal Cord. 2004;42(10):564–72. [PMID: 15289799] 3. Verellen J, Theisen D, Vanlandewijck Y. Influence of crank rate in hand cycling. Med Sci Sports Exerc. 2004;36(10): 1826–31. [PMID: 15595307] 4. Dallmeijer AJ, Ottjes L, De Waardt E, Van der Woude LH. A physiological comparison of synchronous and asynchronous hand cycling. Int J Sports Med. 2004;25(8):622–26. [PMID: 15532007] 5. Abel T, Vega S, Bleicher I, Platen P. Handbiking: Physiological responses to synchronous and asynchronous crank montage. Eur J Sport Sci. 2003;3(4):1–9. 6. Van der Woude LH, Bosmans I, Bervoets B, Veeger HE. Hand cycling: Different modes and gear ratios. J Med Eng Technol. 2000;24(6):242–49. [PMID: 11315650] 7. Dallmeijer AJ, Zentgraaff ID, Zijp NI, Van der Woude LH. Submaximal physical strain and peak performance in handcycling versus handrim wheelchair propulsion. Spinal Cord. 2004;42(2):91–98. [PMID: 14765141] 8. Mukherjee G, Samanta A. Physiological response to the ambulatory performance hand-rim and arm-crank propulsion systems. J Rehabil Res Dev. 2001;38(4):391–99. [PMID: 11563492] 9. Maki KC, Langbein WE, Reid-Lokos C. Energy cost and locomotive economy of handbike and rowcycle propulsion by persons with spinal cord injury. J Rehabil Res Dev. 1995;32(2):170–78. [PMID: 7562657] 10. DeCoster A, Van Laere M, Blondé W. Electromyographic activity of shoulder girdle muscles during handbiking. In: Van der Woude LH, Hopman MT, Van Kemenade CH,
editors. Biomedical aspects of manual wheelchair propulsion: The state of the art II. Amsterdam (the Netherlands): IOS Press; 1999. p. 138–40. 11. Faupin A, Gorce P, Campillo P, Thevenon A, Remy-Neris O. Kinematic analysis of handbike propulsion in various gear ratios: Implications for joint pain. Clin Biomech (Bristol, Avon). 2006;21(6):560–66. [PMID: 16510220] 12. Verellen J, Gers B, Van de Vliet P, Vanlandewijck Y. Consistency of the within-cycle torque distribution pattern during hand cycling: A pilot study. Eur Bull Adapt Phys Activ. 2004;3(2):1–8. 13. Smith PM, Chapman ML, Hazlehurst KE, Goss-Sampson MA. The influence of crank configuration on muscle activity and torque production during arm crank ergometry. J Electromyogr Kinesiol. 2008;18(4):598–605. [PMID: 17337211] 14. Schabort EJ, Hopkins WG, Hawley JA. Reproducibility of self-paced treadmill performance of trained endurance runners. Int J Sports Med. 1998;19(1):48–51. [PMID: 9506800] 15. Sanderson DJ, Hennig EM, Black AH. The influence of cadence and power output on force application and in-shoe pressure distribution during cycling by competitive and recreational cyclists. J Sports Sci. 2000;18(3):173–81. [PMID: 10737268] 16. Murray WM, Buchanan TS, Delp SL. The isometric functional capacity of muscles that cross the elbow. J Biomech. 2000;33(8):943–52. [PMID: 10828324] 17. Sarre G, Lepers R, Van Hoecke J. Stability of pedalling mechanics during a prolonged cycling exercise performed at different cadences. J Sports Sci. 2005;23(7):693–701. [PMID: 16195019] 18. Goosey-Tolfrey VL, Sindall P. The effects of arm crank strategy on physiological responses and mechanical efficiency during submaximal exercise. J Sports Sci. 2007; 25(4):453–60. [PMID: 17365532] 19. Mossberg K, Willman C, Topor MA, Crook H, Patak S. Comparison of asynchronous versus synchronous arm crank ergometry. Spinal Cord 1999;37(8):569–74. [PMID: 10455533] 20. Marsh AP, Martin PE. Effect of cycling experience, aerobic power, and power output on preferred and most economical cycling cadences. Med Sci Sports Exerc. 1997;29(9):1225–32. [PMID: 9309635]
Submitted for publication December 14, 2007. Accepted in revised form June 23, 2008.