CONSTRUCTING LOW-ORDER DISCRIMINANT NEURAL NETWORKS USING STATISTICAL FEATURE SELECTION
Eric K. Henderson, M.S. Brigham Young University 835 E. Mountain Cir Alpine, Utah 84004
[email protected]
Tony R. Martinez, PhD Professor Computer Science Department Brigham Young University PO Box 26576 Provo, Utah 84602-6576
[email protected]
Tony Martinez! 1/8/07 2:47 PM Deleted: PLEASE SEND ALL CORRESPONDENCE TO DR. TONY R. MARTINEZ
ABSTRACT
CONSTRUCTING LOW-ORDER DISCRIMINANT NEURAL NETWORKS USING STATISTICAL FEATURE SELECTION
The selection of relevant inputs, and determining an appropriate network topology, are two critical issues faced when applying neural networks to classification problems. This paper presents an algorithm called Pair Attribute Learning (PAL) for addressing both input selection, and the determination of network topology. The PAL algorithm uses a preprocessing stage to search for features derived from pairs of training instances. A statistical rank is used to select a good set of features, and these features are then used to drive the construction of a single hidden layer neural network. Only inputs relevant within the context of a feature are used in constructing the network. This results in a sparsely connected hidden layer, and lower-order discriminants. Results on nine learning problems demonstrate that PAL constructed networks are 70% less complex on average than networks built using other constructive techniques, without a significant loss of predictive accuracy. In addition, the PAL algorithm does not use iterative construction, or suffer from bias mismatch. Because it addresses both input selection and network topology, it provides an end-to-end solution for applying neural networks to classification problems.
KEYWORDS: feature selection, network construction, architecture selection, neural networks, machine learning
1 INTRODUCTION Two important parameters must be selected when designing a neural network to solve a given classification problem. First, the number, type, and range of the inputs must be chosen. Since this is established when the training data is collected and often includes many irrelevant inputs, a subset of these inputs should be selected that optimizes performance. This is known as input (or feature) selection. Second, the network topology must be created. That is, the number and organization (e.g. interconnections) of the nodes comprising the neural network must be specified. Since both of these parameters significantly affect the network’s performance, it is essential to have some means to select them appropriately. We present an algorithm called Pair Attribute Learning (PAL), which addresses both input selection and network topology. The PAL algorithm selects features from a training set of instances that are then used to determine the topology of a neural network for solving a classification problem. The algorithm uses a novel search strategy based on features appearing in instance pairs. Features are chosen using a rank of statistical accuracy over the training set. The selected features drive the number of nodes in a single hidden layer network, and also dictate the connections on the input layer. The resulting network can then be trained using standard techniques, such as backpropagation. The PAL algorithm preprocesses the training data and constructs the network directly from the result – it does not require iterative constructive methods. In addition, the resulting networks are significantly less complex than those built using other techniques, while maintaining similar predictive accuracy. Experimental results on nine separate learning problems demonstrate that PAL constructed networks are 70% less complex on average than the best performing standard networks, while maintaining accuracy within 1.2%. When compared to a common heuristic network, the PAL constructed networks show a 38.8% average reduction in complexity, with a corresponding 3.1% increase in predictive accuracy. In addition, because the PAL algorithm addresses input selection and network topology simultaneously, it is a comprehensive solution for the application of a neural network on a particular problem. There has been a substantial amount of research done separately on the issues of input selection (Battiti 1994, Domingos 1997, John 1994, Mucciardi 1971) and network topology (Andersen 2001, Fahlman 1991, Lehtokangas 1999, Roy 1993, Wang 1994). Some of these are
1
summarized in Sections 2 and 3. A much smaller amount of work has also been done on algorithms that address both simultaneously (Steppe 1996). The remainder of this paper is organized as follows. Section 2 presents in detail the feature selection problem and summarizes the approaches that exist in the literature. Section 3 explores the issue of neural network topology and surveys some of the types of solutions that have been previously applied to this problem. Section 4 gives the details of the proposed algorithm. Several experiments are introduced in Section 5 along with the methods used to obtain the results. The results are analyzed in Section 6, and Section 7 concludes with a summary and an outline of planned future work.
2 FEATURE SELECTION For classification problems, it is helpful to visualize the set of all possible inputs as a hyper-dimensional space, where a single dimension represents each input. Each instance of the problem occupies a finite point in this space, and a point can be labeled with its corresponding output class value. The distribution of these instances within the space is essentially what the learning algorithm is tasked with discovering (Blum 1997). If the distribution is not random, then it will contain groups or patterns of instances, having the same output class, which can be described as a function of some of the inputs. These will be referred to as features of the input space. A feature is an area of the input space where certain inputs take a certain range or value, much like geographic features on a two dimensional map can be specified using coordinate values. Instances whose input values lie within the range of the feature are members of the feature. Because a feature is a function of some number of inputs, the order of a feature is defined as the number of inputs it uses. An input that is used in defining a feature is said to be relevant to that feature. The more relevant inputs a feature has, the higher the order of that feature. This implies that higher order features are more specific because they are more constrained (having more input requirements) and define smaller areas of the input space. As a result, higher order features will normally describe, or “cover”, fewer instances. Conversely, lower order features that use fewer input constraints define much larger areas in the input space, potentially covering more instances and are thus more general. For example, in three dimensions (with coordinates x, y, and z), consider a two dimensional circle in the x,y plane with the constraint that z = 0. This
2
circle will include a relatively small number of points when compared to the size of the space. However, if z is not constrained, the circle becomes a cylinder parallel to the z axis and encloses a much larger set of points in the space. For a given non-random distribution of instances, there exists many sets of features that can reproduce it to some desired level of accuracy. The learning algorithm must discover a set of features that promises the best performance on future novel instances. Biasing the search towards more general features increases the likelihood of future accuracy because these features are the most inclusive. Specific features are more exclusive and thus are less useful for generalizing. This can be illustrated in the extreme case where a set of features is chosen such that each training instance is covered by a single high order feature. This amounts to memorizing the training data and provides no means for generalizing on novel instances. 2.1 Feature Search Even for a small number of inputs the search for a good set of features to describe the instance distribution is extremely complex. The size of the input space increases exponentially in the number of inputs making an exhaustive search prohibitive. Learning algorithms that search for features must have some means for guiding (or limiting) the search through the input space if they are to be tractable. One means of reducing the complexity of the search for features is to reduce the size of the input space by eliminating an input altogether. An input can usually be eliminated if it is not strongly relevant to the features used to model the distribution. Each input removed significantly reduces the complexity of the input space. Selecting a minimal, relevant subset of the inputs can therefore reduce the scope of the feature search required by the learning algorithm, potentially improving training speed and accuracy. The selection of a subset of relevant inputs is often referred to in the literature as the “feature subset selection problem” (John, 1994). Some references use the terms feature, input, and attribute interchangeably. It should be emphasized that this paper distinguishes between a feature (as described in section 2.0), and an input. (The term input and the term attribute are used synonymously throughout this paper). In this sense, the search for features is simply adapting the network to solve the classification problem (by selecting features to model the instance distribution). In contrast, the selection of a relevant subset of inputs is primarily concerned with
3
removing irrelevant inputs from the representation of the problem and reducing the input space complexity. 2.2 Relevant Input Selection There have been many approaches to the selection of relevant inputs proposed in the literature. These can be functionally classified as filter or wrapper algorithms (John, 1994). A filter attempts to reduce the number of inputs independent of the learning algorithm. The filter is run in a pre-processing stage and uses some measure of relevance to determine the subset of inputs to pass to the learning algorithm. A wrapper is used in conjunction with the learning algorithm. The wrapper determines a candidate subset of inputs and then measures the relevance by running the actual learning algorithm on them.
2.2.1 Filters. The filtering method is not hindered by the computational complexity of the learning algorithm since it uses an independent measure of relevance. However, it is difficult to find a good measure of relevance that is computationally inexpensive. The more sophisticated the filter becomes, the closer it comes to a learning algorithm in its own right. Many of the filters that have been proposed use statistical measures of information content (Battiti, 1994). An irrelevant input provides no information with respect to the class of an instance and this can theoretically be measured using statistical techniques (Battiti, 1994; Ben-Bassat, 1978). Filtering methods can also potentially suffer from mismatched biases. If the filter’s bias is significantly different from the learning algorithm, the learning algorithm performance might degrade using the subset of inputs selected by the filter. The RELIEF algorithm proposed by Kira and Rendell (1992) is a filter that ranks inputs individually, based on a relevance score. This score is derived by taking random samples of the training set and finding the difference between the nearest same and opposite class neighbors. The k best (i.e. most relevant) inputs are selected to be used with a decision tree algorithm. A more thorough search for relevant inputs is conducted using the FOCUS algorithm from Almuallim and Dietterich (1991). This filter searches for a set of the lowest combination of inputs that can be used to cover the training set without contradiction. The selected inputs are then used in a decision tree algorithm. The algorithm searches through the set of input spaces by exhaustively looking at individual inputs, then pairs of inputs, then triples, etc. Obviously for 4
distributions where there are no completely irrelevant inputs, this algorithm will execute in exponential time with respect to the number of inputs. The algorithm is also susceptible to noise, since any point in the (original) input space with a contradiction will force the algorithm to fail to find a subset. Further work by the authors has been proposed to overcome these limitations. Cardie (1993) used a decision tree as a filter to select inputs for another machine learning algorithm (nearest neighbor). A C4.5 tree was run on the training data, and inputs that were not utilized by the algorithm were determined to be irrelevant. The remaining inputs were then used in the nearest neighbor algorithm. This method suffers from the bias mismatch previously discussed. In this case, the biases are explicitly different and this could prove problematic for certain problems, although improved performance was reported for the problems that were investigated.
2.2.2 Wrappers. Since wrapper techniques run the learning algorithm to measure the relevance of a subset of inputs, they are restricted by the computational complexity of the learning algorithm. However, because wrappers measure performance directly, there is no danger of a bias mismatch. Wrappers essentially extend the learning algorithm by including a search of input spaces with the search for features within an input space. The search for an input space (i.e. subset of inputs) must be guided or limited by the wrapper, just as the search for features must be guided or limited by the learning algorithm. Wrappers typically use standard computer search algorithms such as greedy or beam search to guide the exploration of input selection. The most common wrapper techniques are Backward Sequential Search (BSS) and Forward Sequential Search (FSS). BSS begins with all inputs and successively removes one at a time using a greedy decision process. FSS works in a similar fashion but begins with no inputs and successively adds them. Both techniques are usually implemented to stop the search when the performance on the next iteration declines. Aha and Bankert (1996) began with a random set of inputs and used a beam search to determine the next subset of inputs. The search was terminated when no better performing subsets could be found. The resulting subset was used with a nearest neighbor algorithm. Domingos (1997) extends FSS and BSS for nearest neighbor algorithms by including a means of measuring relevance in context. The algorithm selects subsets of inputs local to groups 5
of instances using FSS or BSS. The results were reported as having a significant improvement over the standard FSS or BSS methods.
3 NEURAL NETWORK CONSTRUCTION Neural networks, like other machine learning algorithms, essentially search through the input space for features that can be used to represent the distribution of instances for a given problem. The larger the size of the input space, the more complex this search becomes. Subsequently, techniques to reduce the size of the input space (i.e. input subset selection) can help improve the performance of neural networks. Most neural networks search for features in the input space by adjusting discriminant surfaces within the space (Principe, 2000). These surfaces are n-dimensional in the number of inputs and define linear boundaries of class membership. Because the discriminant surface is linear, groups of discriminants must be combined to describe convex regions (features) of the input space (Lippmann, 1987). The number of discriminants available is a function of the network topology, and the number of discriminants needed (to describe a feature) is dependent on the shape of the feature. This presents a problem when configuring the topology of a neural network because the shape of a feature is related to the distribution of the instances and is not known a priori. The position of the discriminant in the input space is determined by adaptable parameters in the network, just as in two dimensions the equation for a line is determined by two adaptable parameters (i.e. slope and y-intercept). The adaptable parameters take the form of weights on connections in the network. The greater the number of weights for a discriminant, the more degrees of freedom it has. By removing some of the weights (or forcing them to zero), the position of the discriminant is restricted and the complexity of placing the discriminant in the input space is reduced. 3.1 Multilayer Perceptrons A popular configuration used in the application of neural networks to classification problems is the Multilayer Perceptron (MLP). MLPs have been shown to be universal classifiers (Hassoun, 1995), and can be trained using a simple adaptive rule called backpropagation (Rumelhart, 1986). It is common to use a single hidden layer when constructing MLPs, to reduce
6
the complexity. It has been shown that restricting the network to a single hidden layer does not compromise the discriminating power of the network (Hassoun, 1995). The scope of this research is limited to MLPs consisting of a single hidden layer trained using backpropagation. Each node in the hidden layer of an MLP is a discriminant in the input space (Principe, 2000). The number of adaptable weights for a hidden layer node determines the number of degrees of freedom the network has to position the discriminant. As previously stated, the number of discriminants necessary to describe the features (i.e. model the distribution) is not known a priori. This makes it difficult to optimally select the number of hidden layer nodes (i.e. topology) of the network. If there are too few nodes to adequately describe the features, the network will have poor accuracy. If there are too many nodes in relation to the features present in the distribution, the network could describe the features too precisely, referred to as overfitting. A network overfits when it begins to learn spurious features that are not related to the underlying distribution, resulting in poor generalization and susceptibility to noise in the training data (Geman, 1992). 3.2 Constructive Techniques Techniques for applying neural networks to classification problems have been refined in recent years. There are many heuristics based on empirical research that can help construct a neural network with satisfactory results. Usually the hidden layer is set in relation to the number of inputs and outputs of the network (Lippmann, 1987). If there is domain knowledge about the problem, such as the expected number and shape of features, the hidden layer can be set accordingly. The network topology can then be adjusted based on experimental results. Unfortunately, training a network on a large problem can be prohibitively expensive and using trial and error to select the topology may not be feasible. To address this problem researchers have focused on two types of solutions. The first approach is to construct the network, usually using some iterative algorithm that starts with a small network and gradually increases the size until some desired accuracy is achieved. The second approach is to start with a very large network trained to the desired level of accuracy, and to reduce the size until some error threshold is exceeded. This is called pruning the network. Some examples of constructive and pruning algorithms are presented in the next sections.
7
3.2.1 Constructive algorithms. Many constructive techniques produce network configurations unlike the standard feedforward single hidden layer MLP (Fahlman, 1991; Andersen, 2001; Roy, 1992). Other constructive techniques are specific to a class of learning problems, and use alternative activations or adaptive rules (Kim, 1995; Martinez, 1994). Constructive algorithms that result in standard network configurations often use variations on backpropagation training, or novel iterative techniques (Moody, 1994; Opitz, 1997; Setiono, 1995; Lehtokangas, 1999; Wang, 1993; Steppe, 1996; Young, 1998). Fahlman and Lebiere (1991) proposed the Cascade-Correlation Learning Architecture, which iteratively constructs a hierarchical network structure. The algorithm begins with no hidden nodes and trains the network until “no significant error reduction occurs” during a set number of training cycles. The network weights are then frozen and a new node is added. The process is repeated until the residual error becomes acceptable. Cascade-correlation uses a much faster adaptive rule than standard backpropagation because the internal nodes are trained in isolation and the error is not propagated down the hierarchy. Lehtokangas (1999) adapted Cascade-Correlation to standard MLP architectures. This is called Constructive Backpropagation (CBP). The algorithms are similar except that CBP uses the standard backpropagation adaptive rule and the network is built using a single hidden layer. New nodes are added to the hidden layer without hierarchical interconnections. Because the network only trains the new node at each iteration, the computational complexity remains much less than a similar network trained simultaneously. Andersen (2001) used a decision tree type method of constructing a neural network, called Dynamic Multilayer Perceptron (DMP). A network with a single output node (assuming a dual positive/negative class problem) is first trained using the entire set of instances. If it misclassifies some positive instances, a new node is connected to precede the output node (the left child). Similarly, if it misclassifies some negative instances, a new node is inserted prior to the output node (the right child). A subset of the instances, including those misclassified by the output node, is used to train the new node(s). This repeats until all the instances are correctly classified. This produces a network that takes the form of a binary tree, and is guaranteed to converge for consistent training sets.
8
Roy, Kim, and Mukhopadhyay (1992) describe a constructive technique based on using linear programming to search for “masks” (i.e. features) to cover class regions. This is analogous to constructing a single hidden layer MLP where each hidden node represents a mask. In this implementation, the hidden nodes have a single connection to the output node of the class they cover. The number of masks used to define the classes determines the size of the hidden layer. The number of masks needed is determined using an iterative clustering algorithm and linear programming. Wang, Massimo, Tham and Morris (1993) use a canonical decomposition technique to determine how to modify the hidden layers of a two hidden layer MLP. This technique starts with a small two hidden layer network and iteratively grows the number of nodes until a performance criterion is satisfied. Other constructive techniques are non-iterative and attempt to analyze the training data to find the optimum number of nodes in a hidden layer. Suzuki (1995) proves an explicit equational representation for function approximation using three-layer neural networks that explicitly specifies the number of hidden layer nodes. Zheng and Billings (1995) use a measure of mutual information between the inputs and outputs to select a sub-optimal set of inputs to a radial basis function (RBF) network. The orthogonal least squares algorithm (OLS) is then used to determine the number of hidden layer nodes. Bichsel and Seitz (1988) use an analysis of neural networks as multistage encoders to arrive at an optimal configuration of the hidden layer, although the application results in a constructive technique that is iterative and similar to CBP. The majority of constructive algorithms applicable to supervised learning of classification problems require iterative techniques. Like heuristic or trial and error approaches, for large problems, training iterative networks becomes prohibitive. In addition, many of these constructive methods produce alternative topologies that preclude the use of widely available tools. Although a few non-iterative constructive techniques exist, they typically have constraints on the type of problems they can be applied to. The PAL algorithm presented in this paper is generally applicable to all classification problems and does not rely on iterative methods to determine the network topology.
3.2.2 Pruning algorithms. Pruning techniques can be used on individual weights (i.e. connections) or individual nodes. Some pruning methods are interactive (Sietsma, 1991), others operate after the training 9
phase (Mozer, 1989; Le Cun, Denker, and Solla, 1990; Hassibi, 1993), and some algorithms incorporate the pruning into the adaptive rule itself (Chauvin, 1989; Weigend, 1991; Plaut, 1986; Ishikawa, 1990; Kruschke, 1989; Whitley, 1990). Le Cun, Denker, and Solla (1990) proposed the Optimal Brain Damage (OBD) pruning method, which determines a weight’s saliency using the Hessian matrix. Weights are pruned beginning with low saliency until the network error rises above a predetermined threshold. A simple but effective weight pruning technique removes weights in order of magnitude, beginning with the smallest weights. Weights with very small magnitudes are near zero, and have little effect on the network. This reduces the complexity of the network with minimal effect on the accuracy. Another common pruning technique is to add a term to the weight update rule in the backpropagation algorithm itself, which drives the weight to zero. This is known as “weight decay”. The theory is that the training error that is backpropagated through the network will continually “refresh” the significant weights, letting the unimportant weights die out. Many variations on the form of the weight decay term have been proposed (Plaut, 1986; Ishikawa, 1990; Nowlan, 1992; Chauvin, 1989). Whitley and Bogart (1990) apply a genetic algorithm to search for a weight-pruned network. Individuals in the population represent variations of pruned networks. After the genetic operators are applied, the new population is given a short retraining time. Smaller networks are given longer retraining. The fitness function is the error of the individual after the retraining occurs. This biases the search to small networks, but not at the price of high inaccuracy. Pruning algorithms that operate on individual nodes work with some means of measuring a node’s relevance to determine which node is to be pruned. In some cases an exhaustive search may even be appropriate since the evaluation of the accuracy of a trained neural network is computationally inexpensive. Mozer and Smolensky (1989) use a node relevance term based on the difference between the network error with and without the node present. By using the partial derivative of a modified error function to approximate the relevance, the relevance can be calculated for each node using backpropagation, similar to the error used in training. Pruning algorithms are generally successful at reducing the complexity of some networks. However, the size of the network to be pruned must first be determined, and must be
10
large enough to easily adapt to the problem. This introduces the computational expense of first training a large network. There is also the issue of when to stop pruning (i.e. when a sufficient reduction in complexity has been achieved). In addition, pruning may only succeed in removing redundant elements, and not affect the internal representation adapted by the network, which may be hindering generalization (Reed, 1999).
4 PAIR ATTRIBUTE LEARNING We present a novel algorithm called Pair Attribute Learning (PAL) that addresses both feature selection and network topology. This method uses a filtering stage to select relevant features based on a statistical measure. The resulting features are used directly to construct a neural network. The network is trained using standard backpropagation and no further processing is required. 4.1 Relevant Inputs Fully connected single hidden layer MLPs using backpropagation adapt the weights on the connections between input nodes and hidden layer nodes. The weights determine the position of the discriminant (i.e. the hidden layer node) in the input space. It is possible for some weights to be adapted such that they are very close to zero (relative to other weights). In this case, the network determines that the input from the connection is irrelevant to the position of the discriminant in relation to the feature being described. Another possible outcome of adapting the weights is for the network to produce an irrelevant correlation. In this case the weight is adapted such that it is significantly non-zero, but does not affect the position of the discriminant in relation to the feature. In both of these situations it would be advantageous to remove the connection to the irrelevant input thereby reducing the complexity of placing the discriminant. An input may be found to be irrelevant only in the context of a specific feature and in this case should not be removed from other features. Many feature selection algorithms only search for inputs that can be safely removed from the problem completely. This approach does not consider that individual features may need only a small subset of the inputs, and these inputs may vary from feature to feature. The PAL algorithm does not explicitly search for irrelevant inputs to the problem. Instead it evaluates individual features and determines which inputs are relevant to that feature. Useful
11
features are selected based on a performance measure. These features are then used to construct a single hidden layer MLP such that each feature produces a corresponding hidden node with connections only to the inputs that were determined to be relevant to that feature. The algorithm is biased toward low order features resulting in the construction of hidden nodes with low order discriminants. This reduces the complexity of placing the discriminants while allowing the neural network to find the best fit for a given feature. The construction of the network is driven by the features discovered in the preprocessing stage. The resulting network typically has fewer connections to the input layer than a standard feed forward network with the same number of hidden nodes. The number of hidden nodes produced by the PAL algorithm is dependent on the distribution of the training data. If the distribution contains many small features, PAL will produce a network with a large number of hidden layer nodes. If there are only a few large features, PAL will construct a network with few hidden nodes. Heuristic methods to construct a network are typically based solely on the number of inputs and outputs and therefore would produce the same number of nodes in either case. 4.2 Search Strategy All feature selection algorithms must have some means to guide or limit the search through the input space because an exhaustive search is intractable for even a modest number of inputs. The PAL algorithm uses correlations on pairs of instances in the training set to generate the features to be explored. This constrains the search to only those features that appear in the training set. For this to be effective, the distribution of the training data must model the actual distribution of the learning problem (a constraint shared by most learning algorithms). The algorithm generates a feature by finding the correlation on inputs between a pair of instances that share the same class. Correlated inputs are simply inputs that have the same value (continuous values are handled using discretization as described in section 5.2.1). All correlated inputs are relevant in the context of the feature (since in this case the feature is defined as the correlated inputs), whereas uncorrelated inputs are not relevant. The algorithm attempts to explore all features that exist in the training data by iterating through successive pairs. Each feature is evaluated using a statistical measure based on the accuracy of the feature when used to predict the class of the training data. This is done by finding the percent of instances that correlate with the feature, within the feature’s class. A penalty term is derived for instances that
12
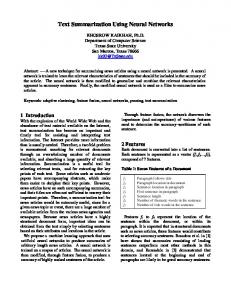
correlate with the feature but have a different class. Each feature is ranked based on the result and the top scoring features are selected for use in the construction of the network. The algorithm is biased toward more general features by selecting them over more specific features when both show a similar performance. This increases the likelihood that the network can generalize adequately, and is less susceptible to noise. 4.3 Network Construction Once a set of features is selected, a corresponding network is constructed. A node is placed in the hidden layer for each feature in the set. Each relevant input used in the feature is connected to the node with all other inputs left unconnected. The output layer is then fully connected. This produces a network with the input layer sparsely connected to the hidden layer, assuming the pre-processing produces low order features. The network can then be trained using standard techniques such as backpropagation. Figure 1 near here Figure 1 shows an example of a network constructed with the PAL algorithm. In this example, the classification problem has four inputs and two outputs. The first network (a) is a standard fully connected single hidden layer MLP with seven nodes in the hidden layer. A list of three features is shown under the second network (b). The features are given as an ordered list of 1’s and *’s corresponding to the four inputs. A 1 is shown for a relevant input, and * is shown for an irrelevant input. These features were used to construct the network (b) shown in the figure. 4.4 The PAL Algorithm Pseudocode for the feature selection phase of the Pair Attribute Learning algorithm is given in section 4.4.1. The pseuodocode consists of two main loops and a subroutine. The first loop iterates through all same-class pairs of instances to find features that are then ranked by the subroutine. The second main loop selects a subset of the collected features based on rank, to be used in the construction of the network. The subroutine ranks features using the percentage of instances (from the same class as the feature) that match the feature. A penalty term equal to the percentage of instances from different classes that match the feature, is subtracted off. A more detailed explanation of the function of each code block follows in section 4.4.2. 13
4.4.1 Pseudocode. begin Pair Attribute Learning (A) for all classes in the training data (B) (C)
for all j-1 instances in the class for all k instances in the class where k > j
(D)
if instance pair (j,k) has a correlated feature with order > 1
(E)
if the feature has never been encountered before
(F)
call subroutine to rank the feature add the feature to a list for later processing if the feature is ranked higher than 25 break for loop (C), and continue with the next j instance
(G) for all classes in the training data do (H) (I)
while there are more features in the list for this class select the feature with the highest rank for network construction if the cumulative rank of selected features is > 200 break while loop (H)
end Pair Attribute Learning begin subroutine to rank a feature (J)
let thisClass be the class of the feature let percentCorrect be the percentage of instances that belong to thisClass that are covered by the feature let percentIncorrect be the percentage of instances that don’t belong to thisClass that are (erroneously) covered by the feature if percentIncorrect > percentCorrect return that the rank of the feature is zero return the rank of the feature as percentCorrect - percentIncorrect
end subroutine to rank a feature
4.4.2 Explanation. The outermost for loop (A) in the first code block is used to iterate through each output class that exists in the problem. The algorithm does not use instance pairs that have a different
14
class for feature selection. (Obviously, this would not yield a useful correlation.) Only the instance pairs within the same class are used in the search for features. The next for loops (B) and (C) iterate through all possible unique instance pairs within the class by starting with the first instance and iteratively choosing all successive instances to form a pair. This repeats for the next instance such that the first pair is not used again, and so on. For each instance pair, the if statement block (D) is executed. This statement determines if the instance pair being evaluated shares a feature whose order is greater than one (i.e. more than one correlated input). If so, the if statement block (E) is executed, otherwise the next pair is selected. Single order features were not used because they were determined to be spurious for most interesting real world problems. However, these features would typically occur very frequently in the training set, requiring the computation of their rank. By enforcing a minimum order of two on evaluated features, an improvement in the runtime of the algorithm was realized. The if statement (E) is used to further optimize the algorithm by rejecting features that have previously been examined. Features that rank high will appear frequently in the instance pairs, so omitting repeated evaluations of these features provides a significant performance improvement. Once a unique feature with order greater than two is encountered, the statements in block (F) are executed. First, the feature is ranked using the statistical method shown in the subroutine to rank a feature. Second, the feature is added to a list to save for later processing. Third, if the feature is ranked higher than 25, successive pairs using the first instance are not examined. The algorithm resumes processing at the next iteration of for loop (B). This is another optimization to improve execution speed of the algorithm. If a high-ranking (determined empirically to be 25 or greater) feature is found using a certain instance, it means there is a high correlation with subsequent instances in the class. Therefore, it is likely that the instance is redundant, making it unnecessary to use it further in the feature search. The ranking represents the percentage of instances that match the feature (see below). Thus a rank of 25 means 25%, or 1 in 4, of the instances in the class will appear with this feature. To optimize the processing, it is desired to use a low rank threshold to break the for loop (C) as early as possible. However, breaking the loop too early using a low threshold has the adverse effect of possibly missing important features. In our experiments, we determined a rank threshold of 25 to give the best tradeoff between optimization and efficiency.
15
Once all instance pairs from all classes have been processed, for loop (A) terminates and the algorithm proceeds to the for loop (G). This iterates through each class in the training data, executing the while loop (H). This loop uses a greedy method to select features for the current class from the list of features produced in code block (A). When the cumulative rank of the selected features exceed 200, or no more features exist for the current class, the loop is terminated. The 200 cumulative rank threshold is an empirical value and was chosen to achieve a higher probability of covering all instances in the given class. If each rank percentage represented unique covered instances, a cumulative rank of 100 would mean a class was completely covered. However, because the algorithm does not record the particular instances covered by a feature, a situation may arise where two features cover a large number of the same instances (overlap). The sum of the ranks of selected features can therefore possibly be much higher than the actual percent of class coverage provided by the selected features. Using a higher cumulative threshold provides a greater chance for attaining total class coverage, at the cost of possible redundancy and greater complexity. The subroutine to rank a feature begins with code block (J). The rank of a feature rf is given by
rf =
1 nc
1
! m( f , x ) $ n $ n ! m( f , x )
x#c f
c x"c f
where f is the feature to be ranked, cf is the set of instances belonging to the class c of feature f, x is a training instance, m(f, x) is 1 if the feature f matches instance x and zero otherwise, nc is the number of training instances in class c, and n is the total number of training instances. The subroutine first calculates percentCorrect , the percentage of instances from the same class as the feature that are covered by the feature. It then finds percentIncorrect, the percentage of instances having a different class than the feature that are covered by the feature. This is used as a penalty term to help distinguish highly accurate general features (i.e. those that match a large number of instances), from highly inaccurate general features. The rank is calculated as the difference between percentCorrect and percentIncorrect or zero, whichever is greater, giving the rank a range of 0 – 100.
16
4.5 Time Complexity of the Algorithm The algorithm iterates through all possible pairs in the data set that share the same class. Each pair produces a feature, and each feature is ranked by checking it against all instances. This yields a time complexity of ' nk $
( %% 2 "" ! m k
&
#
(1)
where k is the number of output classes, nk is the number of instances in class k, and m is the total number of instances. For nk > 2 equation (1) reduces to
2
# k
nk " nk !m 2
(2)
The upper bound occurs when the data set has only one output class. This would not be a realistic learning problem, but can be used to find the bound on the time complexity. Substituting into equation (2) k = 1, which gives nk = m:
m3 ! m2 = O m3 2
( )
(3)
Although the bound on the time complexity is cubic in the worst case, the time complexity is slightly better than equation (3) assuming that the instances in the data set are evenly divided among the output classes, giving nk = m/k. Several optimizations to the algorithm reduce this time considerably in practice. One simple but effective optimization is to skip the evaluation of redundant features. The algorithm keeps track of features that have been evaluated and skips the evaluation phase if a feature is found to be redundant. A practical learning problem will have features that appear many times in the training data. Using this optimization the algorithm avoids making many redundant passes through the training set.
17
Another optimization is to have the algorithm discontinue searching for features if sufficient features have been found to model the distribution of a class. This means that after a predetermined level of predictive accuracy has been achieved with existing features, the algorithm terminates the feature search for that class. This has a significant benefit because good features cover many instances and therefore show up early in the search, allowing the algorithm to terminate after searching only a relatively few pairs. However, if the distribution can only be modeled using very high order features, the algorithm will be forced to examine most, or all of the pairs. Finally, for a given instance, if a feature has been found to rank higher than some threshold, the instance is no longer used to generate features. A good feature will cover many instances, and subsequent pairs using the given instance will thus be redundant. Allowing the algorithm to terminate a loop early in this case can significantly speed up execution time.
5 EXPERIMENTS We used two metrics to evaluate the neural networks in our experiments. First, we measured the accuracy of the network. This is determined by how well a network correctly classifies novel instances once it has been constructed and trained. Second, we measured the complexity using the number of connections contained in the network. This is reported as the average complexity over all runs of a ten-fold cross validation (see section 5.3.2). We compared the accuracy and complexity of the networks produced by the PAL algorithm against manually constructed fully-connected single hidden layer MLPs. This is a common configuration when manually constructing networks for learning problems with nongraphical input. We selected two sizes for the hidden layer of the manually constructed networks. First, we used a common heuristic that allocates two hidden layer nodes for every input node (Principe, Euliano and Lefabvre, 2000). This yields a hidden layer twice the size of the input layer. We refer to this in our discussion as the Double Input Network (DIN). Second, we exhaustively tested hidden layer sizes incrementally up to five times the size of the input layer. For cases where the input layer was small (less than five nodes) this was done in single node increments. For larger problems this was done using five node increments. The network size that achieved the best accuracy was recorded for use in our comparisons. We refer to this as the Best Iterative Network (BIN). Although in a few cases this technique resulted in a
18
network size similar to the heuristic DIN, in most cases the sizes were significantly different (see section 6). The BIN results represent the best accuracy possible given a fully connected single hidden layer MLP, since all (reasonable) sizes for the hidden layer were tested. Using the BIN and DIN networks provide a meaningful comparison because the PAL constructed networks can be derived from the same topology. Given a fully connected single hidden layer MLP with the same number of hidden layer nodes as a PAL network, an equivalent transform can be realized by pruning the appropriate connections. Comparing against these configurations demonstrates what performance gains we can practically achieve using automated PAL construction, versus networks constructed manually. Additionally, any constructive algorithm which produces a fully connected single hidden layer MLP is effectively represented in the comparison with the exhaustive iterative testing that produces the BIN.
5.1 Data Sets We evaluated the PAL algorithm using eight real-world learning problems and one artificial learning problem. The data sets used in the experiments are described below. The size of the data set is given for each problem, and is also listed in Table 1 in section 6. Blood – (Principe, 1999). This data has four blood measurements taken from patients, represented as real numbers. There are two output classes representing healthy or sick diagnoses. There are 209 instances in the data set. Cancer – (Blake and Merz, 1998). This data set is composed of nine physical measurements taken from breast cancer patients and stored as integer values in the range one through ten. The output classes correspond to benign and malignant diagnoses. There are 683 instances in the data set. Credit – (Blake and Merz, 1998). This data set has 15 inputs related to credit application screening. The inputs are a mixture of nominal and continuous values. The output classification is defined as accepted or rejected. The data set contains 653 instances. Echo – (Blake and Merz, 1998). This is a collection of data from patients who had a heart attack. The classification problem is to predict which patients survived one year after the heart attack. There are eight input attributes comprised of integer and continuous values. The data set contains 62 instances. Iris – (Blake and Merz, 1998). This is a very popular data set containing physical measurements from iris plants. There are four real inputs and three output classes representing three types of iris 19
plants. This is a very simplistic domain and has been widely used in the literature. The data set contains 150 instances. Lenses – (Blake and Merz, 1998). This data set contains four nominal attributes of patients who are being fitted for contact lenses. The possible output classes are soft, hard, or none, corresponding to the type of lenses that should be used (if any). The input space is extremely small and contains only 24 points in four-dimensional space. All 24 points (instances) are present in the data set. Mushroom – (Blake and Merz, 1998). This data set has 22 nominal input attributes that give physical attributes of a mushroom plant. The output classifications are poisonous or edible. This problem has a very large set of data samples - the data set contains 5,644 instances. Monk3 – (Blake and Merz, 1998). This is a data set artificially created for benchmarking learning algorithms. It has six nominal input attributes and an output classification of zero or one. The training data has 5% noise added. There are 554 instances in the data set. Zoo – (Blake and Merz, 1998). This data set contains 17 boolean-valued input attributes describing various characteristics of animals. There are seven output classes each representing a group of animals with similar traits. The data set contains 101 instances. 5.3 Methods It is difficult to do an objective comparison of neural networks because there are a large number of implementation parameters that can affect the performance of a network. For example, the initialization of the weights, the learning rate, the learning rule, and the method of determining convergence. Because this research is primarily concerned with comparing network topologies, all parameters were chosen to have conservative, typical settings. More importantly, these were kept constant throughout the experiments. The following sections detail the methods we used to build, train, and test the networks.
5.3.1 Input Processing. The inputs to the learning problems took several different forms depending on the nature of the physical attributes they represented. Nominal inputs could take one of a fixed set of discrete values that were pre-defined for the particular problem. These were then mapped on to the positive integers to be used by the algorithm. Numeric inputs could be any integer value, and continuous inputs could be any real number. Determining the correlation of two nominal, or numeric inputs simply requires determining if they have the same discrete value. This method is not effective for continuous
20
inputs because usually these types of inputs do not correlate exactly. One common method for handling continuous valued inputs is discretization. The real numbered values are mapped to a discrete number of nominal values. There are several sophisticated means for deriving the number of nominal values and the way in which the continuous values are mapped to them. For this research, we used a simple method consisting of ten equal discrete intervals on the normalized range of the continuous values. After discretization, continuous inputs were treated the same as nominal inputs.
5.3.2 Cross Validation. All results reported in this research were obtained using a modified form of ten-fold stratified cross validation (Kohavi, 95). For each learning problem, we partitioned the data into three sets, referred to collectively as a mix. Ten different mixes were used for testing on each problem, and the average results were reported. Each mix contained a training set, holdout set, and test set. The training set was used to train the neural network, the holdout set was used to determine when to stop the training (convergence), and the test set was used to obtain a performance metric. This ensured a more accurate benchmark of true performance because the network did not use the test set during training in any way. The size of the three sets was determined as a percentage of the original data and remained constant for all experiments: 67.5% for the training set, 7.5% for the holdout set, and 25% for the test set. Each set in a mix retained the same ratio of class samples as the original data (stratification), but the particular samples in a set varied among the mixes. This was done to provide the broadest coverage of training/holdout/test set permutations possible with the original data, while still reproducing the original distribution.
5.3.4 Network Training. We trained the networks using standard backpropagation with no momentum. The connection weights were first randomly initialized between –0.2 and 0.2 using a uniform distribution. The networks were then trained on-line (vs. batch mode) using a learning rate of 0.2. After every 100 epochs, the holdout set was tested and the summed squared error (SSE) recorded. If the SSE increased by 25% from the best SSE recorded to that point, the training was
21
stopped. This usually occurs when the network begins to overfit the training data while generalization suffers. Two other conditions were allowed to stop the training process. First, if the SSE went below .001, the accuracy was deemed sufficient and the training was stopped. Second, if the SSE did not decrease more than 2% over 500 epochs, the network was said to have converged, and the training was stopped. These stopping thresholds were determined empirically and kept constant throughout the experiments. We used the network corresponding to the best recorded (holdout) SSE, over the entire training run, to measure performance on the test set. This implies that even if the network began to overfit the training data, this would not be reflected in the test results because a previous version of the network was saved for use in the testing.
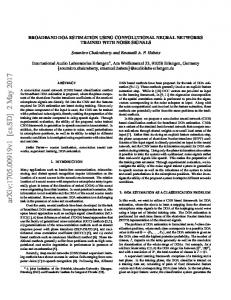
6 RESULTS The results of running the PAL algorithm on all nine data sets, along with the results from the BIN and DIN methods, are shown in the bar charts in Figures 2 and 3. Figure 2 shows the percent accuracy for each method on each data set. The BIN slightly outperformed the other methods on all but the mushroom data sets, where the PAL algorithm was the most accurate. The PAL algorithm was within 3.4% of the BIN method in every case. The DIN also had very similar performance to the BIN method, but suffered on the Lenses data set. The DIN method underperformed PAL on all but three of the problems. Figures 2 and 3 near here Figure 3 shows the complexity of the resulting network for each method as a percentage of the most complex network. The most complex network is shown as 100%. Table 1 gives the actual complexities (number of connections) produced by each method, as well as the number of inputs, output classes, and training instances for each learning problem. Table 1 near here The PAL algorithm produced significantly less complex networks than the BIN method in all cases. In three cases the DIN method produced slightly less complex networks than the
22
PAL algorithm. These were the Iris, Lenses, and Monk3 data sets. Of the three, the accuracy of the DIN method was only better than the PAL algorithm on the Iris data set. Overall, the PAL algorithm produced networks 70% less complex than the BIN method, and 38.8% less complex than the DIN method. The accuracy of the PAL networks was only 1.2% lower than the most accurate network (BIN), on average. These results demonstrate that using the PAL algorithm produces small, accurate networks without the computational overhead of iterative construction techniques, or the uncertainties of heuristic approaches. The most pronounced reductions in complexity can be observed for the learning problems with larger numbers of input or output nodes, such as the cancer, credit, echo, and zoo problems. In each of these cases, the PAL networks were significantly less complex than both the BIN and DIN networks while maintaining reasonable accuracy. The PAL algorithm is well suited for learning problems like this which have sharp features distributed over a large input space, since the algorithm is able to target these features directly. Learning problems with small, uniform input spaces such as iris and lenses, benefit less from the PAL algorithm. One shortcoming of the PAL algorithm is that it lacks a facility for removing redundant inputs. Since there is no explicit measure of correlation on inputs within a feature, all inputs that are correlated in an instance pair are used for the feature. Redundant inputs will then appear as connections in the constructed network, adding to the network complexity. The PAL algorithm potentially discovers all features that appear in the training set. Not every feature is useful for generalizing so some means of selecting the features to drive the network construction must exist. As explained in section 4, the PAL algorithm ranks the features based on predictive accuracy, but a heuristic had to be empirically determined to set the threshold for feature selection. The threshold value was chosen to ensure that enough features could be selected to cover each class, but this was not necessarily the optimum for a given problem. This is why for certain problems the PAL network is more complex than the DIN method. More features were selected in this case than were necessary, although the accuracy did not suffer significantly. An interesting result of running the BIN method was the variance of the network accuracy over all topology iterations. Most of the data sets had relatively small variances with one exception. The Monk3 data set had the largest variance. This was most likely due to the fact that the training data for the Monk3 set has 5% class noise added artificially. This has the effect
23
of “spreading” the instances in the input space and can sometimes cause a network to overfit the noise. Figure 4 shows the accuracy as a function of the number of nodes in the hidden layer for the Monk3 data set. Figure 4 near here
7 CONCLUSION AND FUTURE WORK Two important issues relating to the implementation of a neural network to solve a classification problem were examined in this paper, namely feature selection and network topology. The choices for certain parameters of the implementation, related to feature selection and topology, can significantly impact the performance of the network. There is presently a need for better methods to address these aspects of neural network design. The Pair Attribute Learning algorithm addresses both these issues simultaneously by using the results of a feature search to drive network construction. Features are extracted as correlations of instance pairs, and selected based on a statistical measure. A single hidden layer network is constructed with a hidden layer node inserted for each selected feature. The hidden layer node is only connected to inputs that are relevant in the feature. The output layer is fully connected, and the network is trained via standard backpropagation. Results from nine different experiments show that the PAL algorithm constructs networks that have on average a 70% reduction in complexity when compared to the best performing standard network topology. Although the PAL networks were significantly less complex, the predictive accuracy remained on average within 1.2% of the highest recorded accuracy. This is due to the low order features selected in the first phase of the algorithm that determine the hidden layer connections, and the minimization of redundant or extraneous hidden nodes. The results in this study focused on network topologies that were most similar to the automatically constructed PAL networks (i.e. fully connected single hidden layer MLPs). A wide variety of constructive algorithms exist that produce more exotic network configurations. It would be informative to test the performance of the PAL networks against these other algorithms with respect to accuracy, complexity, and computationally intensity. Future work could also include a comparison of pruning techniques, applied to both the manually constructed networks used in this study, and the results of other constructed networks. 24
Some parameters of the PAL algorithm, such as the cumulative rank threshold, were determined empirically over the nine data sets used in the experiments. Future work should focus on removing dependence on these parameters, such as dependent ranking to avoid overlap. Also, further work should extend the feature search to more general features by reducing instance pair correlations (e.g. removing spurious inputs). Other extensions to be explored include optimizing the algorithm to improve execution time, provisions for problems where class outputs are underrepresented by the selected features, and sparsely connecting the output layer.
25
References Aha, D. W., and Bankert, R. L. 1996. A Comparative Evaluation of Sequential Feature Selection Algorithms, in: Artificial Intelligence and Statistics V, edited by Fisher, D. and Lenz, J. H. New York, Springer-Verlag. Almuallim, H., and Dietterich, T. G. 1991. Learning with Many Irrelevant Features. Proceedings of the Ninth National Conference on Artificial Intelligence, 547-522. San Jose, California: AAAI Press. Andersen, T. L., and Martinez, T. R. 2001. A Dynamic Multi-Layer Perceptron Construction Algorithm. International Journal of Neural Systems, 11(2),145-166. Battiti, R. 1994. Using Mutual Information for Selecting Features in Supervised Neural Net Learning. IEEE Transactions on Neural Networks, 5(4). Ben-Bassat, M. 1978. Irrelevant Features in Pattern Recognition. IEEE Transactions on Computers, C-27(8). Bichsel, M. and Seitz, P. 1989. Minimum Class Entropy: A Maximum Information Approach to Layered Networks. Neural Networks, 2, 133-141. Blake, C.L. and Merz, C.J. 1998. UCI Repository of machine learning databases [http://www.ics.uci.edu/~mlearn/MLRepository.html]. Irvine, CA: University of California, Department of Information and Computer Science. Blum, A. L. and Langley, P. 1997. Selection of Relevant Features and Examples in Machine Learning. Artificial Intelligence, 97, 245-272. Blumer, A., Ehrenfeucht, A., Haussler, D., and Warmuth, M. K. 1987. Occam's Razor. Information Processing Letters, 24, 377--380. Campbell, C. 1997. Constructive Learning Techniques for Designing Neural Network Systems, in: Neural Network Systems, Techniques and Applications, edited by Leondes, C. T. San Diego, Academic Press. Cardie, C. 1993. Using Decision Trees to Improve Case-Based Learning. Proceedings of the Tenth International Conference on Machine Learning, 25-32. Amherst, Massachusetts: Morgan Kaufmann. Chauvin, Y. A. 1989. A Back-propagation Algorithm with Optimal Use of Hidden Units, in: Advances in Neural Information Processing Systems (1), edited by Touretzky, D. S., San Mateo, Morgan Kaufmann, 519-526. 26
Domingos, P. 1997. Context-Sensitive Feature Selection for Lazy Learners. Artificial Intelligence Review, 11, 227-253. Fahlman, S. E. and Lebiere, C. 1991. The Cascade-Correlation Learning Algorithm. Technical Report CMU-CS-90-100, Carnegie Mellon University. Geman, S., Bienenstock, E., and Doursat, R. 1992. Neural networks and the bias/variance dilemma. Neural Computation, 4, 1-58. Hassibi, B., and Stork, D. G. 1993. Optimal Brain Surgeon, in: Advances in Neural Information Processing Systems (5), edited by Hanson, S. J., Cowan, J. D., and Giles, C. L., San Mateo, Morgan Kaufmann, 164-171. Hassoun, M. H. 1995. Fundamentals of Artificial Neural Networks. Cambridge, The MIT Press. Henderson, E. K., and Martinez, T. R. 2002. Pair Attribute Learning: Network Construction Using Pair Features. Proceedings of the IEEE International Joint Conference on Neural Networks IJCNN ’02, pp. 2556-2561. Ishikawa, M. 1990. A Structural Learning Algorithm with Forgetting of Link Weights. Technical Report TR-90-7. Electrotechnical Laboratory, Tsukuba-City, Japan. Jain, A., and Zongker, D. 1997. Feature Selection: Evaluation, Application, and Small Sample Performance. IEEE Transactions on Pattern Analysis and Machine Intelligence, 19(2). John, G. H., Kohavi, R. and Pfleger, K. 1994. Irrelevant Features and the Subset Selection Problem. Machine Learning: Proceedings of the Eleventh International Conference, 121-129. Kim, J. H., and Park, S. K. 1995. The Geometrical Learning of Binary Neural Networks. IEEE Transactions on Neural Networks, 6(1). Kira, K., and Rendell, L. 1992. A Practical Approach to Feature Selection. Proceedings of the Ninth International Conference on Machine Learning, 249-256. Aberdeen, Morgan Kaufmann. Kohavi, R. 1995. A Study of Cross-Validation and Bootstrap for Accuracy Estimation and Model Selection. Proceedings of the 15th International Joint Conference on Artificial Intelligence, pp. 1137-1143. Kruschke, J. K. 1989. Creating Local and Distributed Bottlenecks in Hidden Layers of Backpropagation Networks, in: Proceedings of the 1988 Connectionist Models Summer School, edited by Touretzky, D., Hinton, G., and Sejnowski, T., San Mateo, Morgan Kaufmann, 120-126. Le Cun, Y., Denker, J. S., and Solla, S. A. 1990. Optimal Brain Damage. Advances in Neural Information Processing Systems, 2,598-605.
27
Lehtokangas, M. 1999. Modelling with Constructive Backpropagation. Neural Networks, 12:707-716. Lippmann, R. P. 1987. An Introduction to Computing with Neural Nets. IEEE ASSP Magazine, 3(4), 4-22. Martinez, T. R., Hughes, B., and Campbell, D. M. 1994.Priority ASOCS. Journal of Artificial Neural Networks, 1(3), 403-429. Mitchell, T. M. 1997. Machine Learning. Boston, McGraw-Hill. Moody, J. 1994. Prediction Risk and Architecture Selection for Neural Networks, in: From Statistics to Neural Networks: Theory and Pattern Recognition Applications, edited by Cherkassky, V., Friedman, J. H., and Wechsler, H., NATO ASI Series F, Springer-Verlag. Mozer, M. C. and Smolensky, P. 1989. Skeletonization: A Technique for Trimming the Fat From A Network Via Relevance Assessment, in: Advances in Neural Information Processing 1, edited by Touretzky, D. S., Denver, 107-115. Mucciardi, A. N. and Gose, E. E. 1971.A Comparison of Seven Techniques for Choosing Subsets of Pattern Recognition Properties. IEEE Transactions on Computers, C-20(9). Nowlan, S. J., and Hinton, G. E. 1992. Simplifying Neural Networks by Soft Weight-sharing. Neural Computation, 4(4), 473-493. Opitz, D. W., and Shavlik, J. W. 1997.Connectionist Theory Refinement: Genetically Searching the Space of Network Topologies. Journal of Artificial Intelligence Research 6, 177-209. Plaut, D. C., Nowlan, S. J., and Hingon, G. E. 1986. Experiments on Learning by Back Propagation. Technical Report CMU-CS-86-126, Carnegie-Mellon University, Pittsburgh. Principe, J. C., Euliano, N. R., and Lefebvre, W. C. 2000. Neural and Adaptive Systems: Fundamentals Through Simulations. New York, John Wiley & Sons, Inc. Reed, R. 1993. Pruning Algorithms – A Survey. IEEE Transactions on Neural Networks, 4(5). Reed, R. D., and Marks, R. J. II 1999. Neural Smithing – Supervised Learning in Feedforward Artificial Neural Networks. Cambridge, The MIT Press. Roy, A., Kim, L. S., and Mukhopadhyay, S. 1993. Polynomial Time Algorithm for the Construction and Training of a Class of Multilayer Perceptrons. Neural Networks, 6, 535-545. Rumelhart, D. E., Hinton, G. E., and Williams, R. J. 1986. Learning Internal Representations by Error Propagation, in: Parallel Distributed Processing: Explorations in the Microstructure of Cognition, edited by Rumelhart, D.E., and McClelland, J.L., MIT Press, 1, 318.
28
Setiono, R., and Hui, L. C. K. 1995.Use of a Quasi-Newton Method in a Feedforward Neural Network Construction Algorithm. IEEE Transactions on Neural Networks, 6(1). Sietsma, J., and Dow, R. J. F. 1991. Creating Artificial Neural Networks that Generalize. Neural Networks 4(1), 67-79. Steppe, J. M., Bauer, K. W. Jr., and Rogers, S. K. 1996. Integrated Feature and Architecture Selection. IEEE Transactions on Neural Networks, 7(4). Suzuki, S. 1998. Constructive Function-approximation by Three-layer Artificial Neural Networks. Neural Networks 11, 1049-1058 Wang, Z., Di Massimo, C., Tham, M. T., and Morris, A. J. 1994. A Procedure for Determining the Topology of Multilayer Feedforward Neural Networks. Neural Networks, 7(2), 291-300. Weigend, A. S., Rumelhart, D. E., and Huberman, B. A. 1991. Back-propagation, Weightelimination and Time Series Prediction, in: Proceedings of the 1990 Connectionist Models Summer School, edited by Touretzky, D., Elman, J., Sejnowski, T., and Hinton, G., San Mateo, Morgan Kaufmann, 105-116. Whitley, D. and Bogart, C. 1990. The Evolution of Connectivity: Pruning Neural Networks Using Genetic Algorithms, Proc. Int. Joint Conf. Neural Networks, 1, 134. IEEE, New York. Witten, I. H. and Frank, E. 1999. Data Mining. San Francisco, Morgan Kaufmann Publishers. Young, S., and Downs, T. 1998. CARVE – A Constructive Algorithm for Real-Valued Examples. IEEE Transactions on Neural Networks, 9(6). Zheng, G. L., and Billings, S. A. 1996. Radial Basis Function Network Configuration Using Mutual Information and the Orthogonal Least Squares Algorithm. Neural Networks, 9(9), 16191637.
29
A B C
Feature A: 1, 1, *, 1 Feature B: 1, *, 1, * Feature C: *, *, 1, 1 (a)
(b)
Figure 1 – (a) A fully connected network with four inputs, seven hidden layer nodes, and two outputs. (b) A network constructed with the PAL algorithm using the three listed features. Relevant inputs are denoted by a 1, irrelevant inputs by a *.
30
PAL BIN
on
k3
m oo hr
us M
M
o Zo
es
s
ns
Iri
Le
ho
t di re C
ce
C
an
oo Bl
Ec
r
DIN
d
Percent Accuracy
100 90 80 70 60 50 40 30 20 10 0
100 90 80 70 60 50 40 30 20 10 0
PAL BIN
M
on
k3
m hr
oo
o Zo M
us
ns
es
s Iri
Le
ho Ec
di re C
ce an
C
oo Bl
t
r
DIN
d
Percent Complexity
Figure 2 – Accuracy for PAL, BIN, and DIN on each data set
Figure 3 – Complexity for PAL, BIN, and DIN on each data set
31
Learning Problem Blood Cancer Credit Echo Iris Lenses Zoo Mushroom Monk3
BIN 54 143 425 150 700 350 1035 120 360
Complexity DIN 48 198 510 160 56 56 736 1056 96
PAL 18.1 12.1 84.2 83.8 83.7 62.7 341.6 67.3 119
Inputs 4 9 15 8 4 4 16 22 6
Parameters Outputs Instances 2 209 2 683 2 653 2 62 3 150 3 24 7 101 2 5644 2 554
Table 1 – Network complexities (number of connections) and general parameters for the nine learning problems used in the experiments.
32
Monk 3 100 98
Percent Accuracy
96 94 92 90 88 86 84 82
90
75
60
45
30
19
16
13
10
7
4
1
80
Nodes
Figure 4 –Accuracy versus hidden layer nodes for the Monk3 data set
33