Mohammad Imroze Khan, Bhibhudendra Acharya, Bikesh Kumar Singh & Jigyasa Soni
Content Based Image Retrieval Approaches for Detection of Malarial Parasite in Blood Images Mohammad Imroze Khan
[email protected]
Lecturer/Department of Electronics & Telecommunication National Institute of Technology Raipur, Raipur, 492010, India
Bhibhudendra Acharya
[email protected]
Assistant Professor/Department of Electronics & Telecommunication National Institute of Technology Raipur, Raipur, 492010, India
Bikesh Kumar Singh
[email protected]
Assistant Professor/Department of Electronics & Telecommunication National Institute of Technology Raipur, Raipur, 492010, India
Jigyasa Soni
[email protected]
M. Tech Student/Department of Electronics & Telecommunication Shri Shankracharya College of Engineering & Technology, Bhilai, 490020, India
Abstract Malaria is a serious global health problem, and rapid, accurate diagnosis is required to control the disease. An image processing algorithm to automate the diagnosis of malaria in blood images is proposed in this paper. The image classification system is designed to positively identify malaria parasites present in thin blood smears, and differentiate the species of malaria. Images are acquired using a charge-coupled device camera connected to a light microscope. Morphological and novel threshold selection techniques are used to identify erythrocytes (red blood cells) and possible parasites present on microscopic slides. Image features based on colour, texture and the geometry of the cells and parasites are generated, as well as features that make use of a priori knowledge of the classification problem and mimic features used by human technicians. A two-stage tree classifier using back propogation feed forward neural networks distinguishes between true and false positives, and then diagnoses the species (Plasmodium Falciparum, P. Vivax, P. Ovale or P. Malariae) of the infection. Malaria samples obtained from the various biomedical research facilities are used for training and testing of the system. Infected erythrocytes are positively identified with two measurable parameters namely sensitivity and a positive predictive value (PPV), which makes the method highly sensitive at diagnosing a complete sample, provided many views are analyzed. Keywords: Falciparum, Vivax, Ovale, Malariae and Giemsa
1. INTRODUCTION This guideline is used for all journals. These are the manuscript preparation guidelines used as a Malaria is caused by parasites of the species Plasmodium that are spread from person to person through the bites of infected female mosquitoes. It can also be transmitted through blood transfusions. If an infected person donates blood, the blood will contain malaria parasites. If the blood is put into another person's body, the parasites will also flow into his or her bloodstream. For the most serious form of malaria, the incubation period is eight to twelve days. In some rare forms of malaria, the incubation period can be as long as ten months.
International Journal of Biometrics and Bioinformatics (IJBB), Volume (5) : Issue (2) : 2011
97
Mohammad Imroze Khan, Bhibhudendra Acharya, Bikesh Kumar Singh & Jigyasa Soni
1.1 Facts and Figures Approximately, 40% of the world’s population, mostly those living in the world’s poorest countries, is at risk of malaria. A child dies of malaria every 30 seconds. Every year, more than 500 million people become severely ill with malaria. [1]. Between 300 million to 500 million people in Africa, India, Southeast Asia, the Middle East, the South Pacific, and Central and South America have the disease. The worldwide annual economic burden of malaria, calculated to include spending on prevention and treatment as well as loss of productivity due to illness, was estimated at US$ 500 million in 2005[2]. 1.2 Diagnosis of Malaria The definitive diagnosis of malaria infection is done by searching for parasites in blood slides (films) through a microscope. In peripheral blood sample visual detection and recognition of Plasmodium spp is possible and efficient via a chemical process called (Giemsa) staining.
(a)
(b)
FIGURE 1: (a) P. Falciparum
(c) (b) P. Vivax
(c) P. Malariae
(d) (d) P. Ovale
The staining process slightly colorizes the red blood cells (RBCs) but highlights Plasmodium spp parasites, white blood cells (WBC), and platelets or artifacts. The detection of Plasmodium spp requires detection of the stained objects. However, to prevent false diagnosis the stained objects have to be analyzed further to determine if they are parasites or not. [1] In the Fig.1:, there are four types of human malaria – Plasmodium Falciparum, P. Vivax, P. Malariae, and P. Ovale. P. Falciparum and P. Vivax are the most common. P. Falciparum is by far the most deadly type of malaria infection. 1.3 Clinical Presumptive Diagnosis The appearance of clinical symptoms is usually the reason that urges the ill patient in industrialized non endemic countries to turn to the physician. Clinicians in western countries need to be well aware of the possibility of imported malaria cases. Diagnosis in these cases may be made difficult by the possibility that the exposure to the infective bite may date back to a long time before clinical symptoms appear, especially in the case of P. vivax or P. malariae infections. The accurate geographical history should be a routine in every interrogation of every patient even in the malaria-free world. Finally, it is to be stressed that P. falciparum malaria in non immune subjects coming from non endemic western countries may be extremely severe, with high case fatality rates if correct diagnosis and treatment is not carried out promptly. 1.4 Laboratory Diagnosis Once malaria is suspected on clinical grounds, it is mandatory to obtain the laboratory confirmation of the presence of malaria parasites in the patient’s organism, whenever possible. The diagnosis of malaria may in fact be pursued by the direct demonstration of the parasite whole cell or of parasite’s nucleic acid or products in the blood (direct diagnosis) or by the demonstration of the patient’s immune response to the infection (indirect diagnosis or immune diagnosis). Direct diagnosis: The Laboratory material needed for light microscopical observation of thin and thick films for malaria diagnosis are given below: • Optic microscope with 100x oil immersion objective
International Journal of Biometrics and Bioinformatics (IJBB), Volume (5) : Issue (2) : 2011
98
Mohammad Imroze Khan, Bhibhudendra Acharya, Bikesh Kumar Singh & Jigyasa Soni
• • • • • • • • • •
Electric supply of adequate mirrors for sun light Stain stock solution Buffered distilled/de-ionized water Graduated cylinders Staining recipients Clean glass slides Cover slips (optional) Disinfectant alcoholic solution Sterile pricking needles Gauze or cotton
1.5 Light Microscopic Observation The direct microscopic observation of stained blood specimens requires specific instrumentation and reagents (microscope, microscopic slides, pricking needle, staining reagents, water, electric or solar light, etc. and a trained professional to obtain to a correct diagnosis. Information on basic microscopy, the basic staining procedures and on the most common mistakes is given together with the morphological clues to make an adequate qualitative (stage and species diagnosis) and quantitative (parasitaemia) diagnosis of malaria infection at the district level. 1.6 Fixation and Staining Procedures Thin and thick films may be allowed to dry in the air protected by dust, or actively dried by waving it. It is important to avoid abrupt exposure to heath (fire, sunlight) that may lead to fixation and fissure the preparations. Fixation may be achieved by heat and alcoholic solutions. Methanol (methyl alcohol) is the most widely used fixative for malaria thin films. Contact with methanol should be maintained for 10-20 seconds. If both thin and thick films are on the same slide, it is mandatory to avoid the contact of methanol (or even of its fumes!) with the thick film to avoid fixation. Giemsa staining procedure: To achieve optimal results, it is important that the Giemsa staining solution is prepared with distilled or de-ionized water buffered to pH 7.2. The Giemsa staining solution is prepared by diluting Giemsa stain with buffered water. A ratio 1:10 and 1:20 is usually used for staining thin and thick films respectively, that is 2 to 1 drops of Giemsa per ml of buffered water. Grossly, 5 ml of the solution is necessary to stain each single slide. The Giemsa stain is then poured onto the slide (or the slide is immersed in the staining trough) and contact is maintained for 30-40 minutes depending on the local climatic conditions. The staining solution is then removed by gentle but accurate rinsing with buffered distilled water and the slide is then drained on filter paper and allowed to dry in air. When the clinical situation requires immediate action, thick films may be stained with a Giemsa accelerate procedure. The qualitative morphological results are however far worse than the usual ones. Briefly, the thick smear is allowed to dry under a heat source of up to 50°C (even sunlight is suitable if slides are protected from dust) and then stained for 8 minutes with a 10% Giemsa solution (2 drops/ml) before rinsing and drying. Giemsa staining is the most commonly used method for both thin and thick films all over the world for the quality of the stain and, of greater importance, its stability in tropical climates. 1.7 Basic Microscopy The microscope is an essential component of the malaria diagnostic laboratory, even in field condition. The care and maintenance of the microscope is thus of the outmost importance. A basic knowledge of the main features of a microscope is also required (World Health Organization, 1991). A monocular microscope is best suited for a natural solar light source, but the quality and the ease of observation is greatly improved when a binocular microscope (requiring electric light supply) is used. A routine microscope usually has three objectives (10x, 40x, 100x magnifications). The 100x objective is also referred to as an “immersion objective” and has to be used to observe blood smears. The binoculars also have their own magnification (6x or
International Journal of Biometrics and Bioinformatics (IJBB), Volume (5) : Issue (2) : 2011
99
Mohammad Imroze Khan, Bhibhudendra Acharya, Bikesh Kumar Singh & Jigyasa Soni
7x are preferred for malaria diagnosis), the total magnification resulting from the multiplication of both lenses. The following practical suggestions may be of help for a better use of this invaluable diagnostic tool: • Place the slide on the stage; • Keep the diaphragm completely open and raise the condenser to reach the brightest field; • Using the coarse adjustment lower the stage (or lift the objective, depending on the microscope used) to the maximum distance from the objective revolver; • Place one drop of immersion oil on the slide; • Using the coarse adjustment, lift the stage to allow the oil drop to touch the lens of the objective; • Using the fine adjustment, sharply focus by slightly lowering the stage again; • Modulate iris diaphragm to obtain optimal illumination; • Clean the objective lenses with soft gauze or lens tissue. • Use Xylene (always avoid strong alcohol solutions or acetone as these substances may dissolve the glue used to fix the objective lenses) only from time to time to remove traces of dried oil. 1.8 Morphological Species and Stage Diagnosis [6] Complete knowledge of the morphological features of the different blood stages of the different Plasmodia species represents the essential basis of a correct laboratory diagnosis confirmation of malaria infection. It is to be stressed that a correct diagnosis may be done only after attentive and careful observation of a number of microscopic fields (at least 100 microscopic fields should be observed before a thick film may be classed as negative) and of a number of different morphologic characteristics that draw a well defined picture of the species. A crescent-shaped gametocyte in peripheral blood does not obligatorily mean that a P. falciparum infection is the cause of the actual clinical complaint and, however, does not rule out the possibility of mixed infection.
2. TEST ALGORITHM This guideline is used for all journals. These are the manuscript preparation guidelines used as a The design is essentially an image classification problem, and thus takes the form of a standard pattern recognition and classification system in Fig. 2:. It consists of five stages: 1. Image Acquisition (Done using high resolution Digital Camera) 2. Image Analysis 3. Image Segmentation 4. Feature Generation 5. Classification of Parasite and result verification 2.1 Image Analysis Image analysis usually starts with a pre-processing stage, which includes operations such as noise reduction. 2.1.1
Test Algorithm Using Filtering Approach
2.1.1.1 Median Filtering: [15] In microscopic image processing, it is usually necessary to perform high degree of noise reduction in an image before performing higher-level processing steps, such as edge detection. The median filter is a non-linear digital filtering technique, often used to remove noise from images or other signals. The idea is to examine a sample of the input and decide if it is representative of the signal. This is performed using a window consisting of an odd number of samples. The values in the window are sorted into numerical order; the median value, the sample in the center of the window, is selected as the output. The oldest sample is discarded, a new sample acquired, and the calculation repeats.
International Journal of Biometrics and Bioinformatics (IJBB), Volume (5) : Issue (2) : 2011
100
Mohammad Imroze Khan, Bhibhudendra Acharya, Bikesh Kumar Singh & Jigyasa Soni
FIGURE 2: Block schematic of the parasite detection system
Algorithm: The median filter considers each pixel in the image in turn and looks at its nearby neighbors to decide whether or not it is representative of its surroundings. Instead of simply replacing the pixel value with the mean of neighboring pixel values, it replaces it with the median of those values. The median is calculated by first sorting all the pixel values from the surrounding neighborhood into numerical order and then replacing the pixel being considered with the middle pixel value. (If the neighborhood under consideration contains an even number of pixels, the average of the two middle pixel values is used.) 2.1.1.2. Non Linear Filtering: SUSAN For a real time system using time varying image sequences, speed is an important criterion to be considered. Also there has to be a compromise between maximizing signal extraction and minimizing output noise: the so-called “Uncertainty Principle” of edge detection. I have implemented a new approach to low-level image processing - SUSAN (Smallest Univalue Segment assimilating Nucleus) Principle [16], which performs Edge and Corner Detection and Structure Preserving Noise Reduction. Canny edge detector, which has become one of the most widely used edge finding algorithms, is found to be ten times slower than this SUSAN approach. The results are stable for Canny but the edge connectivity at junction is poor and corners are rounded. The fact that SUSAN edge and corner enhancement uses no image derivative, explains why the performance in the presence of noise is good. The integrating effect of the principal together with its non-linear response gives strong noise rejection. Algorithm: The following steps are performed at each image pixel: • Place a circular mask around the pixel in question. • Calculate the number of pixels within the circular mask which have similar brightness to the nucleus. These define the USAN. • Subtract USAN size from geometric threshold to produce edge strength image. • Use moment calculations applied to the USAN to find edge direction. • Apply non-maximum suppression thinning and sub-pixel estimation, if required. Hence SUSAN allows image edges, corners and junctions to be accurately and quickly found and a related method for reducing noise whilst preserving image structure. The localization of the features is independent of the mask size used and noise suppression is shown to be good. 2.1.2 Test Algorithm Using Edge Detection Approach Edge detection is one of the most commonly used operations in image analysis. An edge is defined by a discontinuity in gray level values. In other words, an edge is the boundary between an object and the background. The shape of edges in images depends on many parameters: The geometrical and optical properties of the object, the illumination conditions, and the noise level in the images. The importance of the classification is that it simplifies several problems in Artificial Vision and Image Processing, by associating specific processing rules to each type of edges. The classification is based on the behavioral study of these edges with respect to the following differentiation operators. From each category in the classification, at least one algorithm has been chosen for implementation.[15]
International Journal of Biometrics and Bioinformatics (IJBB), Volume (5) : Issue (2) : 2011
101
Mohammad Imroze Khan, Bhibhudendra Acharya, Bikesh Kumar Singh & Jigyasa Soni
Gradient edge detectors: This contains classical operators and uses first directional derivative operation. It includes algorithms such as: Sobel (1970), Prewitt (1970) etc. Zero Crossing: This uses second derivative and includes Laplacian operator and second directional derivative. Laplacian of Gaussian (LoG): This was invented by Marr and Hildreth (1980) who combined Gaussian filtering with the Laplacian. This algorithm is not used frequently in machine vision. Gaussian Edge Detectors: This is symmetric along the edge and reduces the noise by smoothing the image. The significant operator here is Canny that convolves the image with the derivative of Gaussian for Canny. 2.2 Image Segmentation For the actual recognition stage, segmentation should be done before it to extract out only the part that has useful information. The goal of the segmentation process is to define areas within the image that have some properties that make them homogeneous. The definition of those properties should satisfy the general condition that the union of neighboring regions should not be homogeneous if we consider the same set of properties. After segmentation, the discontinuities in the image correspond to boundaries between regions can be easily established. 2.2.1 Test Algorithm Using Thresholding Thresholding can be applied locally, i.e. within a neighborhood of each pixel, or globally. Due to highly varying defect sizes, it will be impossible to find one neighborhood size that works for all. Thus, following global thresholding techniques are implemented to test their achievability. Otsu: Otsu's method is still among the most referenced methods in segmentation [17]. It is based on minimizing within-class variances of foreground and background pixels. Entropy: Kapur et al. explained foreground and background of an image as different signals [18]. Therefore, optimal threshold is the one maximizing the sum of the two class entropies as shown in following (1). (1)
2.2.2 Test Agorithm Using Region Based Segmentation 2.2.2.1 Watershed Segmentation [15] Separating touching blood cells in an image is a difficult issue in the project. The watershed transform could minimize this problem. The watershed transform finds "catchment basins" and "watershed ridge lines" in an image by treating it as a surface where light pixels are high and dark pixels are low. In watershed based segmentation, each local minima of a gray-scale image I is regarded as a surface has a hole and the surface is immersed out into water. Then, starting from the minima of lowest intensity value, the water will progressively fill up different catchment basins of image (surface) I. Conceptually the algorithm then builds a dam to avoid a situation that the water coming from two or more different local minima would be merged. At the end of this immersion process, each local minimum is totally enclosed by dams corresponding to watersheds of image (surface) I. 2.2.2.2 Marker-Controlled Watershed Segmentation [15] Watershed transform can separate touching cells but not overlapping cells. For this Markercontrolled watershed segmentation is used instead. It follows this basic procedure: 1. Compute a segmentation function. This is an image whose dark regions are the object one is trying to segment. 2. Compute foreground markers. These are connected blobs of pixels within each of the objects. 3. Compute background markers. These are pixels that are not part of any object.
International Journal of Biometrics and Bioinformatics (IJBB), Volume (5) : Issue (2) : 2011
102
Mohammad Imroze Khan, Bhibhudendra Acharya, Bikesh Kumar Singh & Jigyasa Soni
4. Modify the segmentation function so that it only has minima at the foreground and background marker locations. 5. Compute the watershed transform of the modified segmentation function 2.2.3 Test algorithm Using Morphology 2.2.3.1. Morphological Granulometry and Gradient [20] Here gray scale granulometries based on opening with disk shape elements are used. Non flat disk shaped structural element are used to enhance the roundness and compactness of the red blood cells and flat disk shaped structural element are used to segment overlapping cells. The method makes use of the knowledge of size of the red blood cells making use of granulometries. 2.2.3.2. Top-Hat and Bottom-Hat Transforms [15] The Top-hat is defined as the image minus the opening of the image. The Bottom-hat is defined as the closing of the image minus the image. 2.3 Feature Extraction Feature selection is one of the most important tasks in data mining area, with methods which allows determining the most relevant features for pattern recognition. A suitable subset of features is found when it permits synthesizing the similarity of the pattern within its class and dissimilarity amongst other different classes. The goal of feature selection is to reduce the dimensionality of vectors associated to patterns selecting a subset of attributes smaller than the original. The classifier performance is often improved eliminating redundant features. Hence the purpose of feature generation is to compute new variables from the image array that concentrate information to separate classes. The classifier has two functions: it must determine whether or not a detected cell is truly positive for malaria, and what the species of the infection is. Features are created with these functions in mind. They provided information with which the classifier distinguished between parasites and other artifacts in the blood, and allowed the classifier to differentiate between parasites of different species. The final performance of the classifier directly depended on the success of the feature generation stage. Two sets of features had been chosen for development. The first set is based on image characteristics that have been used previously in biological cell classifiers, which include geometric features (shape and size), colour attributes and grey-level textures [18, 19]. 2.3.1
Test Algorithm Using First Order Features (Mean, Standard Deviation, Skewness, Kurtosis, Energy and Entropy) [15] Texture is generated from the grayscale image matrices of the red, green and blue components, as well as the intensity component from the hue-saturation-intensity image space. First order features, based on the image histograms are used.
International Journal of Biometrics and Bioinformatics (IJBB), Volume (5) : Issue (2) : 2011
103
Mohammad Imroze Khan, Bhibhudendra Acharya, Bikesh Kumar Singh & Jigyasa Soni
1. Average gray level or mean 2. Average contrast or standard deviation 3. Third moment or skewness 4. Kurtosis 5. Energy 6. Entropy or Randomness Where, P (b) is the first-order histogram estimate, Parameter b is the pixel amplitude value. L is the upper limit of the quantized amplitude level. Finally, σ is the standard deviation. Geometric features like size information such as the area and equivalent radius are also utilized. 2.3.2. Test Algorithm Using Moment Invariant Features [21] Moment invariants have been frequently used as features for image processing, remote sensing, shape recognition and classification. Moments can provide characteristics of an object that uniquely represent its shape. Invariant shape recognition is performed by classification in the multidimensional moment invariant feature space. Several techniques have been developed that derive invariant features from moments for object recognition and representation. These techniques are distinguished by their moment definition, such as the type of data exploited and the method for deriving invariant values from the image moments. These moment invariant values are invariant with respect to translation, scale and rotation of the shape. Seven of these shape descriptor values are computed from central moments through order three that are independent to object translation, scale and orientation. Translation invariance is achieved by computing moments that are normalised with respect to the centre of gravity so that the centre of mass of the distribution is at the origin (central moments). Size invariant moments are derived from algebraic invariants but these can be shown to be the result of a simple size normalisation. From the second and third order values of the normalised central moments a set of seven invariant moments can be computed which are independent of rotation. The moments used to construct the moment invariants are defined in the continuous but for practical implementation they are computed in the discrete form. Given a function f(x, y), these regular moments are defined by the following (2).
M pq = ∫∫ x p y q f ( x, y )dxdy
(2)
Where, Mpq is the two-dimensional moment of the function f(x,y). The order of the moment is (p + q) where p and q are both natural numbers. For implementation in digital from this becomes (3):
M pq = ∑ x p ∑ y q f ( x, y ) x
(3)
y
To normalise for translation in the image plane, the image centroids are used to define the central moments. The co-ordinates of the centre of gravity of the image are calculated using the previous equation and are given by (4):
x=
M 10 M 00
and
y=
M 01 M 00
(4)
The central moments can then be defined in their discrete representation as (5):
µ pq = ∑ ( x − x ) p ∑ ( y − y ) q x
(5)
y
The moments are further normalised for the effects of change of scale using the following (6):
η pq = µ pq / µ00 λ
International Journal of Biometrics and Bioinformatics (IJBB), Volume (5) : Issue (2) : 2011
(6)
104
Mohammad Imroze Khan, Bhibhudendra Acharya, Bikesh Kumar Singh & Jigyasa Soni
Where the normalisation factor: γ = (p + q / 2) +1. From the normalised central moments a set of seven values can be calculated and are defined as: φ1 = η20 + η02 φ2 = (η20 - η02)2 + 4η211 φ3 = (η30 - 3η12)2 + (η03 - 3η21)2 φ4 = (η30 + η12)2 + (η03 + η21)2 φ5 = (3η30 - 3η12)(η30 + η12)[(η30 + η12)2– 3(η21 + η03)2] + (3η21 - η03)(η21 + η03) × [3(η30 + η12)2 – (η21 + η03)2] φ6 = (η20 - η02)[(η30 + η12)2 – (η21 + η03)2] + 4η11(η30 + η12)(η21 + η03) φ7 = (3η21 - η03)(η30 + η12)[(η30 + η12)2 - 3(η21 + η03)2] + (3η12 - η30)(η21 + η03) × [3(η30 + η12)2 – (η21 + η30)2] These are the seven invariant moments, φI, 1 ≤ I ≤ 7. Results of these moment calculations are given in the result section. The images are cropped, rotated and subjected to noise results show that the values of these moments do not vary. Hence any microscopic image that has not captured the image properly will not affect the features calculated for those images because moment s are invariant to rotation, translation and convolution, but are highly sensitive to local variation.
3. TEST ALGORITHM The design follows the same steps as that of a pattern recognition problem. But the best part of the algorithm is the usage of the most appropriate algorithm for each stage. The test algorithms illustrated above give an insight about the algorithm to be used for each stage. The process is given below. 1. Image Acquisition and database collection 2. Image Analysis 3. Image Segmentation 4. Feature Generation 5. Classification of Parasite and result verification
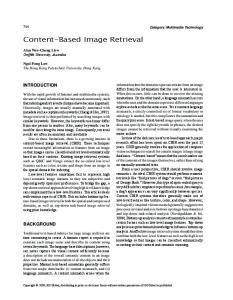
FIGURE 3: Plasmodium Falciparum
3.1 Image Acquisition and Database Collection Oil immersion views (10x1000), of Giemsa stained blood films were captured using a binocular microscope mounted with a digital camera. Captured images were 460 pixels X 307 pixels bitmap images. Fig. 3 shown above the sample slide of P. Falciparum. The database consists of 110 images. 3.2 Image Analysis Out of the all specified image filtering based approaches, it is found hat median filtering gives the most appropriate results. Hence the image is first filtered using a 5×5 median filter [15], followed by a morphological area closing filter using a disk-shaped structuring element (SE) of radius 6 pixels. The morphological filter removes some parasite detail from the image, and so the morphologically-filtered image is only used for functions where parasite detail is not important, such as erythrocyte segmentation. In all other cases, the median-filtered image is used.
International Journal of Biometrics and Bioinformatics (IJBB), Volume (5) : Issue (2) : 2011
105
Mohammad Imroze Khan, Bhibhudendra Acharya, Bikesh Kumar Singh & Jigyasa Soni
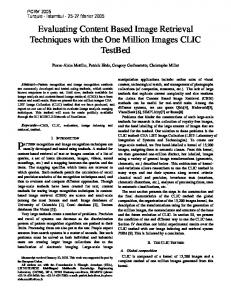
3.4 Image Segmentation Techniques have been proposed earlier that make use of thresholding or morphology to segment an image. In this section we have presented a technique that takes benefit of morphological operation and thresholding at appropriate positions in the whole process to maximize the productivity of the algorithm. In order to use morphological methods for image segmentation, the shape and size of the objects in the image must be known. The most commonly used morphological procedure for estimating size distribution of image components is the Granulometry. The size and eccentricity of the erythrocytes are also required for the calculation of some feature values (as these can be indicative of infection). The shape of the objects (circular erythrocytes) is known a priori, but the image must be analyzed to determine the size distribution of objects in the image and to find the average eccentricity of erythrocytes present. A pattern spectrum showing the size distribution of objects in a sample can be calculated using Granulometry [15]. The next stage of the process identifies and segments potential parasites and erythrocytes from the image background. To extract the infected erythrocytes, it is first necessary to identify them from the combination of parasites and erythrocytes in the image, and then segment them from the background. This algorithm relies primarily on thresholding. The key to successfully segmenting an image using thresholding is threshold selection. The histogram of the complemented, green component of the sample image (fig.4) is a bimodal distribution typical of all the images considered.
FIGURE 4: Bimodal histogram of Plasmodium Falciparum
The threshold level is automatically selected using a modified version of the method that maximizes the separability of the resultant classes of the grey-level histogram [17]. The principle mode is due to the grayscale intensities of the image background, and the second mode is due to those of the erythrocytes in the image. Two threshold levels need to be determined from the histogram: one for erythrocytes, and one for parasites. The first threshold is selected to separate the erythrocytes from the background of the image. This essentially means separating the two modes of the image histogram. The first threshold is selected to separate the erythrocytes from the background of the image. This essentially means separating the two modes of the image histogram. The resulting thresholded binary mask of erythrocytes then has all holes with an equivalent radius less than an empirically determined average erythrocyte radius removed. A morphological opening using a disk-shaped SE with a radius 40% of the mean erythrocyte radius is applied to smooth the objects in the image, and any objects with an equivalent radius of less than half the mean erythrocyte radius are removed. The problem with this binary image of erythrocytes is that clusters of cells are not separated. The next step is to select the second threshold to find parasites present in the image. A global threshold level, taking the threshold as the first local minimum in the histogram after the mode due to erythrocytes, is not sensitive enough. This is a common problem experienced with global threshold selection, caused by inconsistent intensities in the image. The solution is to find local threshold levels. The erythrocytes, having already been identified, provide excellent image regions in which to find these, especially since valid parasites are only found inside erythrocytes. The threshold is then found by taking the first minimum after the principal mode of the histogram incorporating only the erythrocytes. While this method has greater sensitivity, it is at the expense of a reduced specificity. There are also cases, particularly with P. Ovale, where the global threshold is able to
International Journal of Biometrics and Bioinformatics (IJBB), Volume (5) : Issue (2) : 2011
106
Mohammad Imroze Khan, Bhibhudendra Acharya, Bikesh Kumar Singh & Jigyasa Soni
detect parasites that are missed by the local thresholds. This is due to colorization of the infected cells, which shifts the principle mode of the local histograms of the affected cells. For this reason, both local and global thresholds are used, and the union of the two binary images is used as the parasite marker image. Invalid objects in the marker image (objects detected with the global threshold that lie outside any erythrocyte) are removed by taking the intersection of the parasite marker image with the binary mask of erythrocytes. The erythrocyte mask is dilated first, to ensure that ‘blister’ forms of the parasites, that appear to bulge out of the edge of the cells, are not removed. Other artifacts in the blood containing nucleic acid, particularly white blood cell nuclei, are also detected by this thresholding. They are removed by excluding all objects greater than an empirically determined size (chosen to exclude all objects greater than the largest trophozoite that one would expect to find.) The infected cells are identified by morphologically reconstructing the erythrocyte mask with the valid parasite marker. Binary reconstruction simply involves extracting the connected components of an image (the mask) that are marked by another image (the marker), where cells are clustered together, if an infected cell forms part of the group, then the entire aggregation is reconstructed. To separate these clusters so that the infected cell can be isolated and extracted, a modification of the morphological technique used in Di Ruberto et al. [20] is used. A morphological opening filter, using a disk-shaped SE with radius equal to the mean erythrocyte radius less the standard deviation, is applied to the grayscale, morphologically filtered green component of the image to remove any objects smaller than an erythrocyte. The morphological gradient—the difference between a dilation and erosion of the image—is then calculated using a diamond-shaped SE with unity length. The segmentation method is applied to each object in the reconstructed binary image of erythrocytes individually. Those objects that do not exceed the area of a circle with radius equal to the mean erythrocyte radius plus the standard deviation are regarded as being single cells, and are unmodified. Unlike the method in Di Ruberto et al. [20], where the morphological gradients are used to generate marker images for the watershed algorithm, the objects deemed to be overlapping erythrocytes are segmented as follows. First, the intersection of the morphological gradient image and the dilated cell cluster is taken. This image is then transformed to a binary image by thresholding any value greater than zero. A series of morphological operations, namely a closing operation, thinning, and spur-removal are then applied to generate a contour of the segmented erythrocytes. The contours are filled, and the segmented mask is again reconstructed with the valid parasite marker image to result in a segmented mask of infected cells. The erythrocytes that have been identified as possibly infected are then extracted from the image and passed to the next stage of the algorithm for feature generation. The binary mask of the erythrocyte, as well as a binary mask (obtained by local threshold selection based on the image histogram as detailed above) of parasite-like objects present in the cell, is also passed to the next stage.
4. FEATURE GENERATION AND CLASSIFICATION 4.1 Feature Generation Two sets of features are used for development. The first set will be based on image characteristics that have been used previously in biological cell classifiers, which include geometric features (shape and size), color attributes and grey-level textures. It will be advantageous to apply expert, a priori knowledge to a classification problem. This will be done with the second set of features, where measures of parasite and infected erythrocyte morphology that are commonly used by technicians for manual microscopic diagnosis are used. It’s desirable to focus on these features, because it is already known that they are able to differentiate between species of malaria.
International Journal of Biometrics and Bioinformatics (IJBB), Volume (5) : Issue (2) : 2011
107
Mohammad Imroze Khan, Bhibhudendra Acharya, Bikesh Kumar Singh & Jigyasa Soni
4.2 Feature Classification The final classification of an erythrocyte as infected with malaria or not, and if so, the species of the parasite, falls to the classifier. The classifier is a two-stage tree classifier, with an infection classified as positive or negative at the first node, and the species assigned at the second node as shown in fig. 5. The design of a tree classifier has the following steps: the design of a tree structure (which has already been assigned), the selection of features to be used at every node, and the choice of decision rule at each node [22]. The same type of classifier is used at both nodes. Taking into account the fact that there is no guarantee that the classes are linearly separable, back propagation feed forward (BFF) neural networks is selected. The features selected for the first classifier are those that describe the colour and texture of the possible parasites. The features used by microscopists to differentiate malaria species are selected for the second classifier. The training goal is to minimize squared errors, and training is stopped when the error of a validation set increased. This is done to avoid overtraining.
FIGURE 5: Structure of the tree classifier
5. RESULTS AND ANALYSIS The performance and accuracy of the algorithm are analyzed using two measures: sensitivity, the ability of the algorithm to detect a parasite present; and positive predictive value (PPV), the success of the algorithm at excluding non-infected cells. These values are expressed in terms of true positives (TP), false positives (FP) and false negatives (FN) as stated in equation 7:
TP TP + FN TP & PPV = TP + FP Sensitivity =
(7)
The algorithm has been tested on various malaria parasites. The results are summarized in the table no. 1 at various stages of Image Processing as shown in fig. 6.
(a)
(b)
(c)
(d)
(e)
(f)
(g)
(h)
FIGURE 6: The algorithm results. (a)Grayscale image,(b)Filtered image, (c)Threshold RBC image, (d)Holes removed image, (e)Smoothed and dilated image, (f)Detected parasite image, (g)Infected RBC group, (h)Separated parasite affected RBC
International Journal of Biometrics and Bioinformatics (IJBB), Volume (5) : Issue (2) : 2011
108
Mohammad Imroze Khan, Bhibhudendra Acharya, Bikesh Kumar Singh & Jigyasa Soni
Test Image 1 2 3 4 5 6 7 8 9 10
Algorithm 1
Plasmo Vision
Algorithm 2
Manual microscopy
RBC
Parasites
RBC
Parasites
RBC
Parasites
RBC
Parasites
18 18 7 15 39 15 21 44 23 29
21 1 10 4 5 72 114 3 86 16
16 21 9 14 40 13 13 17 22 43
0 0 3 2 3 3 2 2 2 10
10 13 6 8 36 9 11 12 14 20
0 0 9 4 3 2 2 2 2 10
15 12 12 9 36 17 11 13 14 19
0 0 9 4 3 2 2 2 2 10
Table 1: Results of 10 blood images consisting of 158 Red blood cells
Algorithm
Sensitivity (%)
PPV
Average Execution time (sec)
Algorithm 1 Algorithm 2 Plasmo - Vision
74 90 85.5
88 80 81
11.02 30 3.44
Table 2: The results of all the algorithms tested
6. CONCLUSION The proposed automated parasite detection algorithm has many advantages compared to other diagnostic techniques. It avoids the problems associated with rapid methods, such as being species-specific and having high per-test costs, while retaining many of the traditional advantages of microscopy, viz. species differentiation, determination of parasite density, explicit diagnosis and low per-test costs. Apart from overcoming the limitations of conventional methods of parasite detection, the proposed algorithm is optimized to overcome limitations of image processing algorithms used in the past. Among the tested test algorithms, ‘SUSAN edge detection technique’ gave good localization of edges but formed a thick border making cell separation difficult. ‘Otsu’s algorithm’ gave accurate separation of RBCs where as local and global thresholding segmented the parasites. Touching cells were separated successfully using ‘Marker controlled watersheds’, while it did not work for overlapping cells. ’Clump splitting algorithm’ solved the difficulty. Results prove that the algorithm developed in this project has better sensitivity than the algorithm proposed by Di Ruberto and has far better execution speed than the algorithm proposed by Silvia and is applicable to many other blood cell abnormalities other than malaria in contrast to the algorithm developed by Jean Phillipe. This is because the percentage of pathological differences in various diseases has very less effect on this robust algorithm. The algorithm detects the species of parasite and also gives the count of RBCs and the parasites with a sensitivity of 85.5% and a positive predictive value of 81%.
7. REFERENCES [1]
World Health Organization. What is malaria? http://www.who.int/mediacentre/factsheets/fs094/en/.
Facts
sheet
[2]
Foster S, Phillips M, Economics and its contribution to the fight against malaria. Ann Trop MedParasitol 92:391–398, 1998.
[3]
Makler MT, Palmer CJ, Alger AL, “A review of practical techniques for the diagnosis of malaria”. Ann Trop Med Parasitol 92(4):419–433, 1998.
[4]
Bloland PB (2001) Drug resistance in malaria, WHO/CDS/CSR/DRS/ 2001.4. World Health Organization, Switzerland, 2001.
International Journal of Biometrics and Bioinformatics (IJBB), Volume (5) : Issue (2) : 2011
no
94.
109
Mohammad Imroze Khan, Bhibhudendra Acharya, Bikesh Kumar Singh & Jigyasa Soni
[5]
Gilles H.M. “The differential diagnosis of malaria. Malaria. Principles and practice of malariology (Wernsdorfer W.H., McGregor I eds)”, 769-779, 1998.
[6]
F. Castelli, G.Carosi, Diagnosis of malaria, chapter 9, Institute of Infectious and Tropical Diseases, University of Brescia (Italy).
[7]
Baird J.K., Purnomo, Jones T.R. Diagnosis of malaria in the field by fluorescence microscopy of QBC ® capillary tubes. Transactions of the Royal Society of Tropical Medicine and Hygiene; 86: 3-5, 1992.
[8]
Anthony Moody, Rapid Diagnostic Tests for Malaria Parasites, Clinical Microbiology Reviews,0893-8512/02/$04.00_0 DOI: 10.1128/CMR.15.1.66–78.2002, p. 66–78, Jan. 2002.
[9]
Brown A.E., Kain K.C., Pipithkul J., Webster H.K. “Demonstration by the polymerase chain reaction of mixed Plasmodium falciparum and P. vivax infections undetected by conventional microscopy”. Transactions of the Royal Society of Tropical Medicine and Hygiene; 86: 609-612, 1992.
[10]
Jean-Philippe Thiran, Benoit Macq, “Morphological Feature Extraction for the Classification of Digital Images of Cancerous Tissues”. IEEE Transaction on Biomedical Engineering, Vol. 43, no. 10, October 1996.
[11]
Di Ruberto, A. Dempster, S. Khan, and B. Jarra. “Automatic thresholding of infected blood images using granulometry and regional extrema”. In ICPR, pages 3445–3448, 2000.
[12]
Silvia Halim, Timo R. Bretschneider, Yikun Li, “Estimating Malaria Parasitaemia from Blood Smear Images”. 1-4244-0342-1/06/$20.00 ©IEEE, ICARCV 2006.
[13]
Selena W.S. Sio, Malaria Count, “An image analysis-based program for the accurate determination of parasitaemia, Laboratory of Molecular and Cellular Parasitology”, Department of Microbiology, Yong Loo Lin School of Medicine, National University of Singapore. May 2006.
[14]
F. Boray Tek, Andrew G. Dempster and Izzet Kale, “Malaria Parasite Detection in Peripheral Blood Images”, Applied DSP & VLSI Research Group, London, UK, Dec 2006.
[15]
Rafeal C. Gonzalez, Richard E. Woods, Digital Image Processing, 2nd Edition, Prentice Hall, 2006.
[16]
S. M. Smith, J. M. Bardy, “SUSAN - A New Approach to Low Level Image Processing”, International Journal of Computer Vision, Volume 23, and Issue 1 Pages: 45 – 78, may 1997.
[17]
N. Otsu, “A threshold selection method from gray-level histograms”. IEEE Transactions on Systems, Man and Cybernetics, 9(1):62.66, 1979.
[18]
J.N. Kapur, P.K. Sahoo, and A.K.C. Wong, “A new method for gray-level picture thresholding using the entropy of the histogram”. Graphical Models and Image Processing, 29:273.285, 1985.
[19]
T.W. Ridler and S. Calvard, “Picture thresholding using an iterative selection method”. IEEE Transactions on Systems, Man and Cybernetics, SMC-8:630.632, 1978.
[20]
Di Ruberto C, Dempster A, Khan S, Jarra B, “Analysis of infected blood cell images using morphological operators”. Image Vis Comput 20(2):133–146, 2002.
[21]
M. K. Hu, “Visual pattern recognition by moment invariants”," IRE Trans. Information Theory, vol. 8, pp. 179{187, 1962
[22]
Mui JK, Fu K-S, “Automated classification of nucleated blood cells using a binary tree classifier”. IEEE Trans Pattern Anal Machine Intell 2(5):429–443, 1980
International Journal of Biometrics and Bioinformatics (IJBB), Volume (5) : Issue (2) : 2011
110