This article has been accepted for publication in a future issue of this journal, but has not been fully edited. Content may change prior to final publication. IEEE TRANSACTIONS ON VEHICULAR TECHNOLOGY
1
Context Aware Driver Behaviour Detection System in Intelligent Transportation Systems (ITS) Saif Al-Sultan, Ali H. Al-Bayatti and Hussien Zedan
Abstract—Vehicle Ad hoc Networks (VANET) emerged as an application of Mobile Ad hoc Networks (MANET), which use Dedicated Short Range Communication (DSRC) to allow vehicles in close proximity to communicate with each other, or to communicate with roadside equipment. Applying wireless access technology in vehicular environments has led to the improvement of road safety and a reduction in the number of fatalities caused by road accidents, through the development of road safety applications and facilitating information sharing between moving vehicles regarding the road. This paper focuses on developing a novel and non-intrusive driver behaviour detection system using a context-aware system in VANET to detect abnormal behaviours exhibited by drivers, and to warn other vehicles on the road so as to prevent accidents from happening. A five-layer contextaware architecture is proposed which is able to collect contextual information about the driving environment, perform reasoning about certain and uncertain contextual information and react upon that information. A probabilistic model based on Dynamic Bayesian Networks (DBN) for real time inferring four types of driving behaviour (normal, drunk, reckless and fatigue) by combining contextual information about the driver, vehicle and the environment is presented. The dynamic behaviour model can capture the static and the temporal aspects related to the behaviour of the driver, thus, leading to robust and accurate behaviour detection. The evaluation of behaviour detection using synthetic data proves the validity of our model and the importance of including contextual information about the driver, the vehicle and the environment. Index Terms—Context-aware system, VANET, dynamic Bayesian networks, driver behaviour, safety application.
I. I NTRODUCTION T the present time cars and other private vehicles are being used daily by large numbers of people. The biggest problem regarding the increased use of private transport is the rising number of fatalities that are occurring as a consequence of accidents on the roads; the associated expense and related dangers have been recognised as a serious problem that is being confronted by modern society. According to the UK department of transport’s report for road casualties in Great Britain for the first quarter of 2011, there were 24,770 people killed or seriously injured due to road accidents. This number represents a small decrease of 5 per cent, as compared to the
A
Copyright (c) 2013 IEEE. Personal use of this material is permitted. However, permission to use this material for any other purposes must be obtained from the IEEE by sending a request to
[email protected]. S. Al-Sultan is with the Software Technology Research Laboratory, De Montfort University, Leicester, LE2 7EW, UK, (e-mail:
[email protected]). A. H. Al-Bayatti is with the Software Technology Research Laboratory, De Montfort University, Leicester, LE2 7EW, UK, (e-mail:
[email protected]). H. Zedan is with the Software Technology Research Laboratory, De Montfort University, Leicester, LE2 7EW, UK, (e-mail:
[email protected]).
previous 12 months period [1]. Driver errors due to affected by fatigue, being drunk, or reckless driving are the main factors responsible for most road accidents. Wireless communications and mobile computing have led to the enhancement of and improvement in the intelligent transportation systems (ITS) that focus on road safety applications [2], [3]. As a core component of ITS, Vehicle Ad hoc Networks (VANET) have emerged as an application of Mobile Ad hoc Networks (MANET), which uses Dedicated Short Range Communication (DSRC) to allow nearby vehicles to communicate either with each other or with roadside equipments. These forms of communication offer a wide range of safety applications to improve road safety, traffic efficiency and provide a clean environment. VANET safety applications are considered represent a vital step towards enhancing road safety and improving traffic efficiency by preventing accidents from occurring; for example, Intersection collision avoidance, Warning about violating traffic signal and Approaching emergency vehicle warning etc [4]. Many researchers have been working in the area of driver monitoring and detection over recent decades, and therefore multiple systems have been proposed to monitor and detect the status of drivers. Some researchers have tried to monitor the behaviour of the vehicle or the driver in isolation, while others have focused on monitoring a combination of the driver, the vehicle and the environment, so as to detect the status of the driver in an attempt to prevent road accidents. However, there is still no comprehensive system that can effectively monitor a driver’s behaviour, the vehicle’s state and environmental changes to perform effective reasoning regarding uncertain contextual information (driver’s behaviour), so as to alert other vehicles on the road by disseminating warning messages in time to the relevant vehicles in the vicinity, including implementing practical corrective actions to avoid accidents. In this work we propose a five-layer context-aware architecture for a driver behaviour detection system in VANET that can detect four types of driving behaviour in real time driving: normal, fatigued, drunken and reckless driving; it will then alert the driver and other vehicles on the road by operating in vehicle alarms and sending corrective action respectively. The functionality of the architecture is divided into three phases, which are the sensing, reasoning and acting phase. In the sensing phase, the system collects information about the driver, the vehicle state and environmental changes. The reasoning phase is responsible for performing reasoning about uncertain contextual information, so as to deduce the behaviour of the driver. The behaviour of the driver is considered as uncertain context (High level contextual information) therefore, effective
Copyright (c) 2013 IEEE. Personal use is permitted. For any other purposes, permission must be obtained from the IEEE by emailing
[email protected].
This article has been accepted for publication in a future issue of this journal, but has not been fully edited. Content may change prior to final publication. IEEE TRANSACTIONS ON VEHICULAR TECHNOLOGY
reasoning techniques about uncertain contextual information must be performed. Driver behaviour is developed over the course of driving; therefore, we have designed a Dynamic Bayesian Networks model to perform a probabilistic reasoning to infer the behaviour of the driver. Our model combines information from different kinds of sensors so as to capture the static and temporal aspects of behaviour and perform probabilistic inference to deduce the driver’s current driving style. The acting phase is responsible for operating in vehicle alarms and sending corrective actions to other vehicles, via wireless technology provided by VANET. The reminder of this paper is organised as follows. Section II introduces the work that have been done in the field of driver behaviour detection. Our definition to the normal and abnormal driving behaviours is given in section III. The proposed context-aware architecture for driver behaviour detection is explained in section IV. Section V proposes the reasoning mechanism based on dynamic Bayesian network to collect and analyse the behaviour of the driver. System validation is shown in section VI and the conclusion is given in section VII. II. R ELATED W ORK Several researchers have examined the development of driver monitoring and detection systems using range of methods. Some have attempted to measure the driver’s state or the vehicle’s behaviour to detect fatigued and drunk drivers. Meanwhile, other researchers have tried to monitor the driver, vehicle and the environment in order to detect the state of the driver. The main researches are summarised below. [5] focused on building a context-aware smart car by developing a hierarchical model that is able to collect, reason about and react, to contextual information about the driver, vehicle and environment, in order to provide a safe and a comfortable driving environment. However, this system is restricted to warning the driver and controlling the vehicle and does not warn other vehicles on road by sending warning messages. [6] proposed a context-aware system used to collect and analyse contextual information about the driver, vehicle and the environment in real-time driving. It also collects information from questionnaires completed by the drivers in order to create driving situations. The Bayesian network is used to reason about this contextual information, which is relatively uncertain information, by using a learning process to observe and predict the future behaviour of the driver. The system was able to predict the future behaviour of the driver and can not detect the current state of the driver and warn other vehicles on the road. [7]–[9] attempted to detect the fatigue level of the driver using a video camera to extract different cues such as eye state , eyelid movement, gaze movement, head movement and facial expression to measure the fatigue level and warn the driver via in-vehicle alarms. [10] developed a programme that works on a mobile phone and which contains an accelerometer and orientation sensors placed in the vehicle to detect a drunk driver in real time. The programme compares current accelerations with typical drunk driving patterns. When the programme indicates that
2
the driver is influenced by alcohol, warning messages are generated to alert the driver and a message sent to inform police. [11] developed a drunk and drowsy driver detection system combining breath and alcohol sensors in a single device. This device is able to measure the degree of alertness of the driver to detect charged water clusters in the driver’s breath to detect the presence of alcohol using breath and alcohol sensors. [12] proposed a system for drowsy driver detection in real time driving by collecting information about the driver’s behaviour, such as the speed of the vehicle, the vehicle’s lateral position, yawing angle, steering wheel angle and the vehicle’s lane position. Their system uses artificial neural networks to combine different indications of drowsiness and to predict whether a driver is drowsy and to issue a warning if required. [13] developed a non-contact system to prevent driver drowsiness by detecting the eyes of the driver and checking whether they are opened or closed using a CCD camera. The system is based on capturing the face of the driver and using image processing techniques to check if the eyes are closed for long intervals. If the eyes are closed, the driver is drowsy and the system will issue a warning to the driver. The driver behaviour detection systems described above focus on the detection of driver’s status (drunk, affected by fatigue, drowsy) by monitoring the driver or the vehicle and issuing a warning messages to the driver to prevent road accidents. Whilst these systems have achieved good results in terms of improving road safety, they are limited to alerting the driver or controlling the vehicle itself. Moreover, they have not considered the behaviour of the driver as a high-level contex (uncertain context). This study attempts to construct a comprehensive system that is able to detect normal and abnormal driving behaviour using a context-aware system to collect and analyse contextual information about the driver, the vehicle’s state and environmental changes and to perform reasoning about certain and uncertain context. The driver and other vehicles are then alerted by operating an in-vehicle alarm and sending warning messages containing corrective actions via wireless technology provided by VANET, thus providing a flexible, yet more accurate proactive driver behaviour detection system. III. OVERVIEW OF D RIVER ’ S B EHAVIOUR Several definitions of driver behaviour have been proposed in the literature. [14] defined normal driving behaviour as the majority of behaviour exhibited by each driver during their daily driving, while abnormal driving behaviour refer to the behaviour of driver while influenced by mental or physical factors. [15]–[17] referred to the task of driving as a complex dynamic environment and defined driving as the interaction between the driver, the vehicle and the environment (surrounding road information and traffic). [18] defined aggressive driving as when the driver commits a combination of moving traffic offences that may cause a danger to other drivers or property. Aggressive drivers are those who exceed the speed limit, follow the front vehicle too closely, perform unsafe lane change and fail to obey traffic control rules, for example traffic
Copyright (c) 2013 IEEE. Personal use is permitted. For any other purposes, permission must be obtained from the IEEE by emailing
[email protected].
This article has been accepted for publication in a future issue of this journal, but has not been fully edited. Content may change prior to final publication. IEEE TRANSACTIONS ON VEHICULAR TECHNOLOGY
signals. [19] defined normal behaviour as a situation in which driver is concentrating on driving. [20] defined driver behaviour as a sequence of actions, each of which is associated with the specific state of the driver, vehicle and the environment and which can be characterised by a set of contextual information. [21] referred to driver behaviour as a sequence of internal states of the driver, each of which may be observed by capturing associated observable features (contextual information). [22] stated that the driver has a large number of internal mental states and that a transitions from one state to another occurs during driving. In this study the behaviour of the driver is defined from the perspective of context awareness as follows: Driver behaviour is a complex and dynamic interaction between three entities: the driver, the vehicle and the environment. It is described as a transition between a sequence of states (for example normal, affected by fatigue, drunk or reckless), over the course of driving a driver will be in a particular state, which he or she may remain in for a period of time and then potentially changing to a different state. Each state can be characterised by capturing a large amount of contextual information of relevance to the interacting entities. The behaviour of the driver is considered to be normal (safe) if his or her actions associated with the current state will not lead to an accident; it is otherwise considered to be unsafe (abnormal). The behaviour of the driver can be represented as follows: B = {St=1 , St=2 , ......, St=n } Where (B) is the behaviour of the driver, (S) is the state and (t) is the time, the states of the driver were classified into four classes normal driving (Sn ), drunk driving (Sd ), fatigued driving (Sf ) and reckless driving (Sr ). As the definition each state may be characterised by capturing observable context (C), the state may be referred to as: (St=i ) = {C1 , C2 , C3 , ......, Ck } In conclusion, the behaviour of the driver is considered as the current unobservable state (St=i ) that can be characterised by capturing a set of observable context (Cj ) where (St=i ) is the state at time = i and (Cj ) is the context that need to be captured to characterise the state. Based on the previous definitions [15]–[23] of the driving behaviour, we have defined four categories of driving behaviour which are as follows: 1) Normal behaviour: Behaviour is considered to be normal when driver concentrates on the driving task. This can be characterised by controlling the speed of the vehicle, avoiding sudden acceleration, driving without alcohol intoxication, maintaining a proper position between lane markers and the driver having his or her eyes open while driving. When the driver matches the above mentioned criteria, behaviour is considered to be normal. 2) Drunk behaviour: This refers to driving whilst intoxicated by alcohol and is characterised by a set of observable actions such as sudden acceleration, driving without maintaining the proper lane position, driving with out controlling the speed and usually having closed eyes for more than 80% for a period of time.
3
3) Fatigue Behaviour: [24] defined fatigue as an evolving process that increase during driving and which is associated with a loss of effectiveness in driving. [24]– [26] stated that a driver driving after a period of 17 hours with no sleep behaves exactly as a driver who has 0.05% intoxication of alcohol. A driver driving after a period of 24 hours with no sleep bahaves exactly as one who has 0.1% intoxication of alcohol. Based on this argument, fatigue driving was defined as driving that exhibits the same characterisitics as drunk driving, but instead of there is no alcohol intoxication in the driver blood. 4) Reckless behaviour: [27] defined the reckless driver as a driver who drives at high speed, high degree of acceleration and put other traffic participants at risk. The driver is classified as driving in this category when there is no alcohol intoxication, the driver’s eyes are opened but the following behaviours are exhibited: driving with sudden acceleration, not maintaining the proper lane position and not controlling the vehicle’s speed. IV. C ONTEXT- AWARE BASED O N B OARD U NIT A RCHITECTURE Context-aware systems are those systems that are capable of adapting their operations to the current context without user interaction, and are thus aimed at augmenting usability and effectiveness by taking into account the environment’s contextual information [28]. Context-aware systems incorporate the following three main subsystems [29]: • Sensing subsystem: The phase for gathering contextual information by sensors. • Reasoning (Thinking) subsystem: The phase for employing reasoning techniques to contextual data in order to obtain high-level contextual information (for example user situation). • Acting subsystem: Depending on the current situation, the systems provide services to users. Our architecture as shown in Fig. 1 is divided into three main Phases: a sensing phase, reasoning phase and application phase, which represent the three main subsystems of a contextaware system: the sensing, reasoning and acting subsystems. Sending corrective actions or operating the in-vehicle alarms in the third layer depends on the result of the second layer which in turn depends on receiving the information of the first layer. A. Sensing phase The sensing phase is responsible for gathering contextual information about the driver, vehicle and the environment and transferring the collected information into a machine executable form to be processed in the next phase. It is divided into two layers as fellows: • Sensors Layer: This layer is responsible for acquiring the context data. It consists of a set of different sensors integrated into the driving environment in which the system operates. Different types of sensors provide
Copyright (c) 2013 IEEE. Personal use is permitted. For any other purposes, permission must be obtained from the IEEE by emailing
[email protected].
This article has been accepted for publication in a future issue of this journal, but has not been fully edited. Content may change prior to final publication. IEEE TRANSACTIONS ON VEHICULAR TECHNOLOGY
4
executable form. Several types of modelling algorithms can be used to abstract the received sensory data (for example ontology modelling). The received data may come from different types of sensors such as camera, GPS and speed sensor. This component transfers the data into a form that can be processed by the reasoner. B. Reasoning phase
Fig. 1.
•
Driver behaviour detection system architecture
different types of information according to the system requirements. Two types of data sources (sensors) gather context data. The internal data sources (physical sensors) refer to the set of sensors within the vehicle, such as cameras, speed sensor, GPS, alcohol and the accelerometer sensor, which provide information about the vehicle’s speed, acceleration information, the direction of driver’s eyes, position in lane and the level of alcohol in the driver blood. It also incorporates information from external data sources (virtual sensors) including Traffic Management Centres (TMCs); which provide information relating to traffic, weather and road conditions, based on the website, dynamic message signs and highway auditory radio data [2]. External data sources also include information about other vehicles (i.e. speed, current position and direction) collected through received hello messages. Raw data retrieval layer: The purpose of applying this layer is to separate low-level sensing details from the sensors for the upper layer of the system as well as abstract contextual information received from the sensor layer. This layer contains the following two components: – Data acquisition unit: Responsible for controlling and coordinating all the sensors in the sensors layer. – Context interpreter: The modelling process is done in this component in terms of transferring the data received from the data acquisition unit into a machine
This phase is responsible for extracting the situation of the driver and calculating corrective actions for other vehicles on the road. There are two types of contextual information; certain information which is obtained from a single sensor, and uncertain contextual information, which can not be acquired by a single sensor and which may be incomplete or inexact. The behaviour of the driver is categorised as uncertain contextual information (high-level contextual information). In this phase the behaviour detection algorithm performs reasoning about uncertainty (driver behaviour) by combining data acquired from different sensors to detect the state of the driver during real time driving. The corrective action algorithm is responsible for calculating the appropriate corrective action to other vehicles on the road. The reasoning phase consists of two layers as follows: • Reasoning Layer: This layer is responsible for extracting the current state of the driver (for example normal, fatigued, drunk or reckless) and generates corrective actions for other vehicles to avoid road accidents. This layer comprises the following components: – Processor: The OBU processor is responsible for managing all the components of the OBU and controlling all the tasks and activities it performs. The processor performs the following two algorithms: ∗ Behaviour detection algorithm: This algorithm is designed to reason about uncertain contextual information to detect the current behaviour of the driver using a Dynamic Bayesian Network algorithm to combine the data collected from a sensing layer and to detect the type of behaviour. If the behaviour of the driver is normal no action is needed. In case of abnormal driving behaviour (for example drunk, fatigued or reckless), the processor performs the corrective action algorithm. In this paper we will focus on the driver behaviour detection algorithm. ∗ Corrective action algorithm: The aim of performing this algorithm is to chose the appropriate in-vehicle alarm and to calculate the proactive corrective action for other vehicles on the road according to their positions, velocities and directions with the use of predefined digital road maps and the information collected from the adaptive hello messages. The corrective action algorithm will be out of the scope of this paper. – Control unit 1: This unit is responsible for controlling in-vehicle alarms such as seat vibration and audio alarm to attract the driver’s attention. This
Copyright (c) 2013 IEEE. Personal use is permitted. For any other purposes, permission must be obtained from the IEEE by emailing
[email protected].
This article has been accepted for publication in a future issue of this journal, but has not been fully edited. Content may change prior to final publication. IEEE TRANSACTIONS ON VEHICULAR TECHNOLOGY
•
unit receives the signal from the processor in case of abnormal driving behaviour. – Control unit 2: After receiving the signal from the processor indicating abnormal driving behaviour, this unit sends signals to the DSRC/WAVE device to transmit corrective messages to other vehicles on the road, or to the roadside unit. – DSRC/WAVE network device: The OBU contains a DSRC/WAVE network device based on IEEE 802.11p [30]. It is responsible for connecting the vehicle to other vehicle’s OBUs or with the roadside unit through the wireless radio frequency based on IEEE 802.11p. The OBU can send or receive messages via this network device. – Power supply: The power supply is responsible for providing power to the OBU. It is rechargeable and provides power to the OBU without any constraints. – User interface: This contains the audio and video interface that allows the user to interact with the services provided by the OBU. Storage Layer: In this layer, the data base stores predefined digital maps of the road and the historical data (past driving situations).
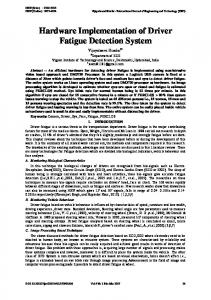
C. Application Phase This phase represents the acting subsystem in a contextaware system. It is responsible for disseminating a warning messages that includes corrective actions for other vehicles on the road. It also operates in-vehicle alarms to warn the driver to prevent the occurrence of accidents and to decrease the number of potential fatalities. Fig. 2 depicts the mechanism of detecting the behaviour of the driver and calculating corrective action for other vehicles on the road. The vehicle sense contextual information about the vehicle, driver and the environment from sensors which include both physical and logical sensors such as speed, accelerometer, TMC, adaptive hello message, cameras, GPS and alcohol sensors which are connected to the OBU. After collecting this information from the sensors the interpreter transfer the different kinds of data to a form that can be processed by the processor by applying one of the modelling techniques such as ontology modelling [31]. This will be out of the scope of this paper. The OBU processor perform the Dynamic Bayesian Network algorithm to perform reasoning about an uncertain contex (driver behaviour) by combining data received from the interpreter using the probabilistic inference. If the output of the inference is normal driving behaviour that satisfies all normal driving criteria, no action will be taken by the processor and the vehicle will sense new information. If the output of the inference is abnormal driving behaviour, such as being drunk, fatigued or reckless, the processor performs the algorithm of calculating the corrective action for other vehicles on the road and choosing the appropriate in-vehicle alarm according to the position of other vehicles and their velocity and direction. After calculating corrective actions for other vehicles and choosing the in-vehicle alarm, the processor
5
Fig. 2.
Driver behaviour detection system mechanism
will send a signal to control unit 1 and control unit 2 to operate an in-vehicle alarm and send the corrective message to other vehicles through the DSRC network device. This process is based on a context-aware system and is a self organising process in which information sensing, reasoning and acting upon this information occurs instantly. V. DYNAMIC BAYESIAN N ETWORK DRIVER BEHAVIOUR DETECTION MODEL
As mentioned in the definition driver behaviour, this refers to a transition between a set of states during the course of driving. For example, the alcohol level in the driver’s blood may be low at the beginning of the driving, but will become higher if the driver is drinking whilst driving; the level of fatigue may also increase during driving [24]. This fact indicates that in addition to the observable context at the current time slice, the driver’s state at the previous time slice is also considered an indicator for the state at the current time slice. Moreover, the driver may exhibit different behaviours at different times. It is therefore very important to capture the temporal aspect of behaviour and to integrates the evidences over time. As a result, the accurate and effective detection of different types of behaviour requires different types of context to be combined. This information may be incomplete or inaccurate due to the inaccurate reading of some sensors and the fact that different variables need to be combined. Several information fusion methods have been proposed such as Fuzzy logic, the Dampester-Shapher theory, Neural networks and the kalman filter. These methods do not provide efficient expressive capabilities to capture incomplete data, uncertainties, dependencies between the variables and the temporal aspect exhibited by the behaviour. This system uses Dynamic Bayesian Networks to combine data from different types of sensors to deduce driver behaviour due to the following reasons. First, they are considered to be the most reliable method for dealing with
Copyright (c) 2013 IEEE. Personal use is permitted. For any other purposes, permission must be obtained from the IEEE by emailing
[email protected].
This article has been accepted for publication in a future issue of this journal, but has not been fully edited. Content may change prior to final publication. IEEE TRANSACTIONS ON VEHICULAR TECHNOLOGY
6
inaccurate data and unobservable physical values. Second, they are able to model time series data. Third, they are efficient at combining uncertain contextual information from a wide range of sensors to deduce high level contextual information (Reason about uncertain context) and are able to combine prior data with current data [32]–[39]. Dynamic Bayesian Network (DBN) is a directed acyclic graph that represents the conditional independence between a set of random variables and which deals with uncertain information and probabilistic inference upon receiving evidences. It consists of a set of nodes that represent the random variables and a set of arcs representing the conditional independences between variables. It is considered as a set of Static Bayesian Networks interconnected by sequential time slices. The relationship between two neighbouring time slices can be modelled using the first order Hidden Markov model which means that the random variables at time slice (t) are affected by the variables at time slice (t) and by the variables at time slice (t-1) only [35], [37], [40], [41]. A DBN can → − be defined as a pair of (S, S ), where S is a static Bayesian → − network that defines the prior P(Z1), and S defines P(Zt | Zt−1 ) which is a two-slice temporal Bayesian network as shown in the following equation [42]: P (Zt |Zt−1 ) =
N Y
P (Zti |P a(Zti ))
(1)
i=1
Where N is the number of nodes in the network, Zit is the ith node at time slice t and Pa(Zit ) are the parents of Zit . The first step in designing a DBN is to identify the hypothesis variables and group them into mutually exclusive events. The second step is to identify the information variables which denote something about the hypothesis. After defining the hypothesis variable and information variables, the next step is to create the directed links between the variables in the networks which reflect the conditional independences between variables to construct the static Bayesian network at time t=1. Finally the conditional probability table for each node in the network and the conditional probability over time have to be created given its parent [43]. In this system the DBN is treated as a singly connected static Bayesian networks in which the hypothesis node at time slice (t) depends on the observations at time slice (t) and the hypothesis node at time slice (t-1) only.
There are two periods during the day (3-5 PM and 3-5 AM) during which human reach their peak level of fatigue [24], [32], [35]. The circadian rhythm was considered as one of the causes that affect the hypothesis nodes. Circadian rhythm node is affected by two nodes, time and time zone node. – Driving environment: Noise and temperature are considered to have a high influence on the driving environment, which can in turn cause fatigue. Fatigue is more likely to occur when there noise and high temperature occur inside or outside the vehicle [32], [35]. The driving environment node was selected as one of the effects that cause the hypothesis nodes. •
Group 2: Information variables that result from specific behaviour, including: vehicle related information (vehicle speed, position between lane markers, acceleration) and driver-related information (the state of the driver’s eyes and the level of alcohol in the driver’s blood). – Controlling the speed: Drunk and fatigued drivers struggle to control their speed due to the mental state of the affected driver. According to the definition of the reckless driver use in this study, the driver may violate the speed limit [10]. – Position in the lane: [10] stated that the drunk driver has a problem in maintaining the lane position (vehicle position between lane markers). – Acceleration: The driver is considered to use normal behaviour whilst driving with normal acceleration and considered to exhibit abnormal behaviour, such as being drunk, fatigued or reckless while driving with sudden acceleration [10]. – State of the Driver’s eyes : The eyes of the fatigued driver are usually measured by PERCLOS, which is considered to be the most accurate measure of driver fatigue. PERCLOS is the measure of eyes that are 80% covered by the eyelid for a period of time [8], [9], [32], [44], [45]. Eye movements affect eyelid movements which in term can be mesurred via PERCLOS and AECS. – Intoxication: This refers to the amount of alcohol in the driver’s blood. This node has two states (less than 0.05% and more than 0.05%). The driver is considered to be drunk driver if there is alcohol intoxication of more than 0.05% [11], [46].
A. Defining network variables (nodes) The hypothesis node in this network is the state node, which includes four mutually exclusive states: Fatigue , Normal , Drunk and Reckless. This reflects the state of the driver at the current time. The information variables were divided into two groups, the first representing variables that may affect the behaviour and the second group the information that results from a specific behaviour type as follows: • Group 1: Information variables that affect the behaviour including: circadian rhythm and the driving environment. – Circadian rhythm: refer to the human sleep-awake cycle, which is considered a cause of driver fatigue.
B. Network Graph After deciding the variables included in the network, the next step is to decide the conditional independence between them (drawing the directed acyclic graph). Fig. 3 depicts the static Bayesian network structure at time (t=1) and the conditional independence between the variables. The DBN is shown in Fig. 4, where the hypothesis node at time slice (t) is affected by the information variables at time slice (t) and the hypothesis node at time slice (t-1) only.
Copyright (c) 2013 IEEE. Personal use is permitted. For any other purposes, permission must be obtained from the IEEE by emailing
[email protected].
This article has been accepted for publication in a future issue of this journal, but has not been fully edited. Content may change prior to final publication. IEEE TRANSACTIONS ON VEHICULAR TECHNOLOGY
Fig. 4.
7
The dynamic Bayesian network structure
TABLE II N ETWORK VARIABLES AND THEIR STATES
Fig. 3.
Static Bayesian network structure at time t=1
Node name
State 1
State 2
Time
Fatigue
Active
Time zone
Change
No change
Circadian
Fatigue
Awake
Noise
High
Normal
Temperature
High
Normal
Environment
Good
Bad
Vehicle heading
Right
Wrong
Lane maintenance
Good
Bad
Acceleration
Sudden
Moderate
Controlling speed
Good
Bad
Intoxication
Less than limit
More than limit
Eyes movements
Normal
Abnormal
Eyelid movements
Normal
Abnormal
PERCLOS
Normal
Abnormal
AECS
Slow
Normal
TABLE I H YPOTHESIS NODE STATES Hypothesis node
State 1
State 2
State 3
State 4
State
Fatigue
Drunk
Reckless
Normal
C. Parameterising the network Parameterising the network (choosing the values of conditional probability table) is the step which the prior probability of the root nodes and the conditional probabilities of the links in the network are determined. First, all the nodes in the network and their possible states must be specified before the value (probability) for each state is chosen. Table I and II illustrate the state space for each node. Deciding the value for each node is important for the network to be useful. Defining the probability of each node in the network refers to the probability of node X being in state
A when the evidence is received. The following two methods may be used to obtain the probabilities of the states for each node in the network: • Obtaining the values by performing statistical analysis of a huge amount of training data. Training data are obtained by performing several tests in a test bed specifically designed for the system and collecting the output for each test. • Parameterising the network can be done using several published papers and researches that are related or similar to the system. It was too difficult to acquire a large amount of training data for this study as no test bed is equipped with all the sensors required for the model. No previous study provides the data required to parameterise the system. Hence, in this model the values for conditional probability tables and the
Copyright (c) 2013 IEEE. Personal use is permitted. For any other purposes, permission must be obtained from the IEEE by emailing
[email protected].
This article has been accepted for publication in a future issue of this journal, but has not been fully edited. Content may change prior to final publication. IEEE TRANSACTIONS ON VEHICULAR TECHNOLOGY
8
TABLE III P RIOR PROBABILITY FOR T IME NODE
TABLE IX C ONDITIONAL PROBABILITIES FOR L ANE MAINTENANCE NODE GIVEN ITS PARENT
Time
Probability
Fatigue
0.26
Active
0.74
TABLE IV P RIOR PROBABILITY FOR T IME ZONE NODE Time zone
Probability
Change
0.17
No change
0.83
Lane maintenance / States
Fatigue
Normal
Reckless
Drunk
Good
0.49
0.975
0.41
0.49
Bad
0.51
0.025
0.59
0.51
TABLE X C ONDITIONAL PROBABILITIES FOR ACCELERATION NODE GIVEN ITS PARENT
Acceleration States
TABLE V P RIOR PROBABILITY FOR N OISE NODE
/
Fatigue
Normal
Reckless
Drunk
Moderate
0.3
0.925
0.374
0.3
Sudden
0.7
0.075
0.626
0.7
Noise
Probability
High
0.15
TABLE XI C ONDITIONAL PROBABILITIES FOR C ONTROLLING SPEED NODE GIVEN
Normal
0.85
ITS PARENT
TABLE VI P RIOR PROBABILITY FOR T EMPERATURE NODE Temperature
Probability
High
0.15
Normal
0.85
Controlling speed / States
Fatigue
Normal
Reckless
Drunk
Good
0.46
0.975
0.48
0.46
Bad
0.54
0.025
0.52
0.54
TABLE XII C ONDITIONAL PROBABILITIES FOR I NTOXICATION NODE GIVEN ITS PARENT
TABLE VII C ONDITIONAL PROBABILITIES FOR C IRCADIAN NODE GIVEN ITS PARENTS Time / States
Time zone
Circadian
Probability
Fatigue
Change No change Change No change
Awake Awake Fatigue Fatigue
0.1 0.4 0.9 0.6
Change No change Change No change
Awake Awake Fatigue Fatigue
0.3 0.95 0.7 0.05
Active
TABLE VIII C ONDITIONAL PROBABILITIES FOR E NVIRONMENT NODE GIVEN ITS
/
Fatigue
Normal
Reckless
Drunk
Less than limit
0.99
1
0.975
0.1
More than limit
0.01
0
0.025
0.9
TABLE XIII C ONDITIONAL PROBABILITIES FOR E YES MOVEMENTS NODE GIVEN ITS PARENT
Eyes movements / States
Fatigue
Normal
Reckless
Drunk
Normal
0.05
0.99
0.99
0.05
Abnormal
0.95
0.01
0.01
0.95
TABLE XIV C ONDITIONAL PROBABILITIES FOR E YELID MOVEMENTS NODE GIVEN
PARENTS
Noise / States
Temperature
Environment
Probability
High
High Normal High Normal
Good Good Bad Bad
0.06 0.2 0.94 0.8
High Normal High Normal
Good Good Bad Bad
0.27 0.85 0.73 0.15
Normal
Intoxication States
transition distributions between time slices from a wide range of published papers and reports were maintained [10], [12], [24], [25], [32], [35], [37], [46]–[48]. This enabled all the probabilities required to parameterise the Dynamic Bayesian network model to be obtained. Tables III - XVIII illustrate the conditional probabilities for each node in the network. Having specified the nodes, the conditional independence
ITS PARENT
Eyelid movements / Eyes movements
Normal
Abnormal
Normal
0.95
0.01
Abnormal
0.05
0.99
TABLE XV C ONDITIONAL PROBABILITIES FOR AECS NODE GIVEN ITS PARENT AECS / Eyelid movements
Normal
Abnormal
Slow
0.05
0.97
Normal
0.95
0.03
between them, the conditional probability table (CPT) for each node in the graph and configured the static Bayesian network at time (t=1), the next stage involve preforming the inference process to calculate the conditional probability for the hypothesis node over time after receiving a set of evidences via
Copyright (c) 2013 IEEE. Personal use is permitted. For any other purposes, permission must be obtained from the IEEE by emailing
[email protected].
This article has been accepted for publication in a future issue of this journal, but has not been fully edited. Content may change prior to final publication. IEEE TRANSACTIONS ON VEHICULAR TECHNOLOGY
9
TABLE XVII C ONDITIONAL PROBABILITIES FOR S TATE NODE AT TIME ( T ) GIVEN ITS PARENTS Circadian
Environment
State (t-1)
Fatigue
Normal
Reckless
Drunk
Awake
Good
Fatigue Normal Reckless Drunk
0.7 0.1 0.1 0.1
0.1 0.7 0.1 0.1
0.1 0.1 0.7 0.1
0.1 0.1 0.1 0.7
Awake
Bad
Fatigue Normal Reckless Drunk
0.8 0.4 0.3 0.2
0.1 0.4 0.1 0.1
0.05 0.1 0.5 0.1
0.05 0.1 0.1 0.6
Fatigue
Good
Fatigue Normal Reckless Drunk
0.7 0.5 0.4 0.4
0.1 0.4 0.1 0.05
0.1 0.05 0.4 0.05
0.1 0.05 0.1 0.5
Fatigue
Bad
Fatigue Normal Reckless Drunk
0.8 0.6 0.4 0.3
0.1 0.3 0.1 0.05
0.05 0.05 0.4 0.05
0.05 0.05 0.1 0.6
TABLE XVI C ONDITIONAL PROBABILITIES FOR S TATE NODE AT TIME ( T-1) GIVEN ITS
VI. E VALUATION
PARENTS
Circadian
Environment
State
Probability
Awake
Good
Fatigue Normal Reckless Drunk
0.05 0.31 0.31 0.33
Awake
Bad
Fatigue Normal Reckless Drunk
0.27 0.25 0.25 0.23
Fatigue
Good
Fatigue Normal Reckless Drunk
0.27 0.25 0.25 0.23
Fatigue
Bad
Fatigue Normal Reckless Drunk
0.51 0.16 0.16 0.17
TABLE XVIII C ONDITIONAL PROBABILITIES FOR PERCLOS NODE GIVEN ITS PARENT PERCLOS / Eyelid movements
Normal
Abnormal
Normal
0.95
0.02
Abnormal
0.05
0.98
sensors to detect the behaviour of the driver. Inference is the process of combining the low level data collected by different sensors and deducing high-level contextual information (for example driver behaviour). The proposed model combines data about the driver, vehicle and the environment to deduce the driver behaviour. The behaviour of the driver depends on the sensory data, with different sensor readings leading to different driving behaviours.
This section evaluates the performance of the proposed driver behaviour detection system, using synthetic data. Given the parameterised Dynamic Bayesian network, the driver behaviour inference process starts upon reception of evidences via sensors. As shown in figure 4, the network consists of 10 evidence nodes (root nodes and leaves nodes), each of which has two possible states. The total number of all the possible combinations of evidences is 210 . As, the circadian node is affected by the time and time zone nodes, and the environment node is affected by the noise and temperature nodes, we will treat the circadian and the environment nodes as evidence nodes during this evaluation. The eyes movements node is treated as an evidence node as it affects the eyelid movements node, which in term affects the PERCLOS and AECS nodes. After considering the circadian, environment and the eyes movement as evidence nodes the total number of all possible combinations attained is 27 which is equal to 128 possible inputs. Here, we have instantiated all the possible combinations of inputs and the system has been able to detect the state of the driver (fatigue, drunk, reckless and normal) over time accurately, applying all possible combinations. It is impossible to detail all the possible combinations here; only samples of the combinations of evidence are shown in table XIX, this illustrates the states of the evidence nodes, the inference results (Hypothesis node’s state) and the degree of belief. (Eyes movements = EM, Controlling speed = CS, Acceleration = A, Intoxication = I, Lane maintenance = LM, Circadian = C and Environment = E). It can be seen from the table XIX that the system is able to detect four driving behaviours, which are fatigue, drunkenness, recklessness and normal driving behaviour. The system is able to detect normal driving behaviour in all possible states for the circadian and the environment nodes (ref no. 1-4 in table XIX). The detection of drunken driving is more accurate when the
Copyright (c) 2013 IEEE. Personal use is permitted. For any other purposes, permission must be obtained from the IEEE by emailing
[email protected].
This article has been accepted for publication in a future issue of this journal, but has not been fully edited. Content may change prior to final publication. IEEE TRANSACTIONS ON VEHICULAR TECHNOLOGY
10
TABLE XIX S AMPLES OF THE COMBINATIONS OF EVIDENCE No.
EM
CS
A
I
LM
C
E
State
Belief
1
Normal
Good
Moderate
Lessthanlimit
Good
Awake
Good
Normal
0.9816
2
Normal
Good
Moderate
Lessthanlimit
Good
Fatigue
Bad
Normal
0.9709
3
Normal
Good
Moderate
Lessthanlimit
Good
Awake
Bad
Normal
0.9687
4
Normal
Good
Moderate
Lessthanlimit
Good
Fatigue
Good
Normal
0.9787
5
Abnormal
Bad
Sudden
Morethanlimit
Good
Awake
Good
Drunk
0.9984
6
Abnormal
Good
Sudden
Morethanlimit
Good
Awake
Good
Drunk
0.9984
7
Abnormal
Bad
Sudden
Morethanlimit
Bad
Awake
Good
Drunk
0.9984
8
Abnormal
Bad
Moderate
Morethanlimit
Good
Awake
Good
Drunk
0.9984
9
Abnormal
Good
Sudden
Morethanlimit
Bad
Awake
Good
Drunk
0.9984
10
Abnormal
Good
Moderate
Morethanlimit
Good
Awake
Good
Drunk
0.9984
11
Abnormal
Bad
Moderate
Morethanlimit
Bad
Awake
Good
Drunk
0.9983
12
Abnormal
Good
Moderate
Morethanlimit
Bad
Awake
Good
Drunk
0.9983
13
Normal
Bad
Sudden
Morethanlimit
Good
Awake
Good
Drunk
0.8361
14
Normal
Good
Sudden
Morethanlimit
Good
Awake
Good
Drunk
0.8170
15
Normal
Bad
Sudden
Morethanlimit
Bad
Awake
Good
Drunk
0.7474
16
Normal
Bad
Moderate
Morethanlimit
Good
Awake
Good
Drunk
0.7448
17
Normal
Good
Sudden
Morethanlimit
Bad
Awake
Good
Drunk
0.7206
18
Normal
Good
Moderate
Morethanlimit
Good
Awake
Good
Drunk
0.7178
19
Normal
Bad
Moderate
Morethanlimit
Bad
Awake
Good
Drunk
0.6255
20
Normal
Good
Moderate
Morethanlimit
Bad
Awake
Good
Drunk
0.5923
21
Abnormal
Bad
Sudden
Lessthanlimit
Good
Awake
Good
Fatigue
0.9287
22
Abnormal
Bad
Sudden
Lessthanlimit
Bad
Awake
Good
Fatigue
0.9279
23
Abnormal
Good
Sudden
Lessthanlimit
Bad
Awake
Good
Fatigue
0.9276
24
Abnormal
Good
Sudden
Lessthanlimit
Good
Awake
Good
Fatigue
0.9274
25
Abnormal
Bad
Moderate
Lessthanlimit
Good
Awake
Good
Fatigue
0.9272
26
Abnormal
Bad
Moderate
Lessthanlimit
Bad
Awake
Good
Fatigue
0.9266
27
Abnormal
Good
Moderate
Lessthanlimit
Bad
Awake
Good
Fatigue
0.9254
28
Abnormal
Good
Moderate
Lessthanlimit
Good
Awake
Good
Fatigue
0.8292
29
Normal
Bad
Moderate
Lessthanlimit
Bad
Awake
Good
Reckless
0.9932
30
Normal
Bad
Sudden
Lessthanlimit
Bad
Awake
Good
Reckless
0.9915
31
Normal
Good
Sudden
Lessthanlimit
Bad
Awake
Good
Reckless
0.9905
32
Normal
Bad
Sudden
Lessthanlimit
Good
Awake
Good
Reckless
0.9857
33
Normal
Good
Moderate
Lessthanlimit
Bad
Awake
Good
Reckless
0.9232
34
Normal
Bad
Moderate
Lessthanlimit
Good
Awake
Good
Reckless
0.8840
35
Normal
Good
Sudden
Lessthanlimit
Good
Awake
Good
Reckless
0.7046
eyes of the driver are closed, as this provide a combination of intoxication and other evidences (ref no. 5-12 in table XIX), as compared with the case where the eyes are opened combined with intoxication and other evidences (ref no. 13-20 in table XIX). When we instantiated a single evidence regarding eyes movement the fatigue level of the driver (ref no. 28 in table XIX) was found to be less accurate than when we instantiated more than one evidence in combination with eyes movements evidence (ref no. 27 in table XIX). In the same situation with case of reckless driving behaviour; when we instantiated a single evidence such as sudden acceleration (ref no. 35 in table XIX) the detection accuracy was less than when we instantiated more than one evidence (ref no. 29-34 in table XIX). Fig. 5 depicts a comparison between all the possible combinations of evidence, which lead to assessment of fatigue behaviour. As seen in the figure, four curves represent the
level of fatigue in all possible states of circadian and the environment nodes. The level of driver fatigue, in the case of Circadian= awake and environment= good is the lowest level in the chart. While, in the case of Circadian= fatigue and environment = bad the fatigue reaches its highest level. This demonstrates the effects of the environment and the circadian rhythm on the driver’s level of fatigue. This further validates our driver behaviour detection system model. Fig. 6 shows a comparison between all the possible combinations of evidence, which lead to assessment of reckless behaviour. Four curves in the figure characterise the belief of reckless behaviour in all possible states for the circadian and environment nodes. Reckless behaviour is more highly present when the environment = good and circadian = awake, which again validates our driver behaviour detection model. Fig. 7 illustrates a comparison between all the possible combinations of evidence, which lead to assessment of drunken
Copyright (c) 2013 IEEE. Personal use is permitted. For any other purposes, permission must be obtained from the IEEE by emailing
[email protected].
This article has been accepted for publication in a future issue of this journal, but has not been fully edited. Content may change prior to final publication. IEEE TRANSACTIONS ON VEHICULAR TECHNOLOGY
11
with real data so as to represent real-time cases. VII. C ONCLUSION
Fig. 5.
A comparison between all possible evidence of fatigue behaviour
Fig. 6.
A comparison between all possible evidence of reckless behaviour
Fig. 7.
A comparison between all possible evidence of drunk behaviour
A promising area of VANET, safety applications are attracting more and more consideration. Monitoring and detecting the behaviour of drivers is vital to ensuring road safety by alerting the driver and other vehicles on the road in cases of abnormal driving behaviours. Driver behaviour is affected by many factors that are related to the driver, the vehicle and the environment and over the course of driving a driver will be found to be in a particular state, the driver can then stay in this state for a period of time or shift to another state. Hence, it is important to capture the static and the dynamic aspects of behaviour and take into account the contextual information that relates to driver behaviour. In this paper we have presented a driver behaviour detection system in VANET from the view point of context awareness. Our contributions are threefold: (1) a five-layer context-aware architecture, which can detect the behaviour of the driver is presented by capturing information about the driver, vehicle and the environment; (2) a DBN algorithm for inferring driver behaviour from different kind of sensors under uncertainty has been formulated, so as to capture the static and dynamic aspects of the behaviour; (3) definitions for normal and abnormal driving behaviours are given. The evaluation result has demonstrated the detection accuracy of the proposed model under uncertainty and the importance of including a great amount of contextual information within the inference process. Our future work comprises designing a corrective action algorithm to calculate the appropriate corrective actions for other vehicles on the road. Modelling techniques for transferring the data collected from sensors into a machine processable format will also be developed. R EFERENCES
behaviour. As shown in the figure, there are four curves demonstrating the drunken behaviour in all possible states of circadian and environment nodes. The belief of drunk behaviour is approximately the same in all cases. It reaches its highest degree when circadian = fatigue and the environment = bad. The above mentioned inference results reveal the fact that the presence of more than one evidence guarantees the occurrence of a specific behaviour, and explain the importance of combining different types of contextual information in order to deduce the behaviour of a driver. These results show the utility of the proposed driver behaviour detecting system. All data used in the evaluation of our system are synthetic data, since, there was no testbed equipped with all sensors required for collecting the data for the proposed model. If a testbed or real vehicle equipped with required sensors were available, the conditional probability tables for the network can be re-parameterised based on the real data. Using one of the available learning algorithms such as expectationmaximisation algorithm can lead to parameterise the network
[1] U. D. for Transport. (2011) Reported road casualties in great britain: Quarterly provisional estimates q1 2011. [Online]. Available: http://www.dft.gov.uk/statistics/releases/ road-accidents-and-safety-quarterly-estimates-q1-2011 [2] S. Olariu and M. C. Weigle, Vehicular Networks: From Theory to Practice. Chapman & Hall/CRC, 2009. [3] Y. Qian and N. Moayeri, “Design of secure and application-oriented vanets,” in Proc. IEEE VTC, May 2008, pp. 2794 –2799. [4] N. H. T. S. Administration, “Vehicle safety communications project task 3 final report, identify intelligent vehicle safety applications enabled by dsrc,” U.S. Dep. of Trans., Tech. Rep. DOT HS 809 859, 2005. [5] J. Sun, Y. Zhang, and K. He, “Providing context-awareness in the smart car environment,” in Proc. IEEE CIT, Jul. 2010, pp. 13 –19. [6] A. Rakotonirainy, “Design of context-aware systems for vehicle using complex systems paradigms,” in Proc. Workshop on saf. and cont. in conj. with CONTEXT, Paris, France, 2005, pp. 464–475. [7] M. S. Devi and P. R. Bajaj, “Driver fatigue detection based on eye tracking,” in Proc. IEEE ICETET, Nagpur, Maharashtra, Jul. 2008, pp. 649 –652. [8] H. Singh, J. S. Bhatia, and J. Kaur, “Eye tracking based driver fatigue monitoring and warning system,” in Proc. IEEE IICPE, New Delhi, India, Jan. 2011, pp. 1 –6. [9] Z. Zhu and Q. Ji, “Real time and non-intrusive driver fatigue monitoring,” in Proc. IEEE ITSC, Oct. 2004, pp. 657 – 662. [10] J. Dai, J. Teng, X. Bai, Z. Shen, and D. Xuan, “Mobile phone based drunk driving detection,” in Proc. IEEE PervasiveHealth NO PERMISSIONS, Munich, Germany, Mar. 2010, pp. 1 –8. [11] M. Sakairi and M. Togami, “Use of water cluster detector for preventing drunk and drowsy driving,” in Proc. IEEE Sensors, Kona, HI, Nov. 2010, pp. 141 –144.
Copyright (c) 2013 IEEE. Personal use is permitted. For any other purposes, permission must be obtained from the IEEE by emailing
[email protected].
This article has been accepted for publication in a future issue of this journal, but has not been fully edited. Content may change prior to final publication. IEEE TRANSACTIONS ON VEHICULAR TECHNOLOGY
[12] D. Sandberg and M. Wahde, “Particle swarm optimization of feedforward neural networks for the detection of drowsy driving,” in Proc. IEEE IJCNN, Hong Kong, China, Jun. 2008, pp. 788 –793. [13] H. Ueno, M. Kaneda, and M. Tsukino, “Development of drowsiness detection system,” in Proc. IEEE Veh. Navig. Info. Sys. Conf., Yokohama, Japan, Aug. 1994, pp. 15 –20. [14] T. Imamura, H. Yamashita, Z. Zhang, M. R. bin Othman, and T. Miyake, “A study of classification for driver conditions using driving behaviors,” in Proc. IEEE SMC, Oct. 2008, pp. 1506 –1511. [15] N. Oliver and A. P. Pentland, “Driver behavior recognition and prediction in a smartcar,” in Proc. SPIE Aerosense-Enhanced Synt. Visi., 2000, pp. 280–290. [16] D. Mitrovic, “Reliable method for driving events recognition,” IEEE Trans. Intell. Transp. Syst., vol. 6, no. 2, pp. 198 – 205, Jun. 2005. [17] N. Oliver and A. P. Pentland, “Graphical models for driver behavior recognition in a smartcar,” in Proc. IEEE Intell. Veh. Symp., Dearborn, MI, 2000, pp. 7–12. [18] N. H. T. S. Administration. (2012) Define aggressive driving. [Online]. Available: http://www.nhtsa.gov/people/injury/enforce/aggressdrivers/ aggenforce/define.html [19] M. Miyaji, M. Danno, and K. Oguri, “Analysis of driver behavior based on traffic incidents for driver monitor systems,” in Proc. IEEE Intell. Veh. Symp., Eindhoven, Netherlands, Jun. 2008, pp. 930 –935. [20] M. Helander, “Applicability of drivers’ electrodermal response to the design of the traffic environment,” J. appl. Psyc., vol. 63, pp. 481–488. [21] A. Pentland and A. Liu, “Modeling and prediction of human behavior,” Neural computation, vol. 11, no. 1, pp. 229–242, Jan. 1999. [22] H. Berndt, J. Emmert, and K. Dietmayer, “Continuous driver intention recognition with hidden markov models,” in Proc. IEEE ITSC, Beijing, China, Oct. 2008, pp. 1189 –1194. [23] T. Wakita, K. Ozawa, C. Miyajima, K. Igarashi, K. Itou, K. Takeda, and F. Itakura, “Driver identification using driving behavior signals,” in Proc. IEEE ITSC, Sep. 2005, pp. 396 – 401. [24] P. Jackson, C. Hilditch, A. Holmes, N. Reed, N. Merat, and L. Smith, “Fatigue and road safety: A critical analysis of recent evidence,” UK Department for Transport, Tech. Rep., 2011. [25] T. A. Commission. (2012) Reducing fatigue - a case study. [Online]. Available: http://www.tac.vic.gov.au [26] D. Dawson and K. Reid, “Fatigue, alcohol and performance impairment,” Nature, vol. 388, p. 235, 1997. [27] T. Bar, D. Nienhuser, R. Kohlhaas, and J. M. Zollner, “Probabilistic driving style determination by means of a situation based analysis of the vehicle data,” in proc. IEEE ITSC, Washington, DC, Oct. 2011, pp. 1698 –1703. [28] M. Baldauf, S. Dustdar, and F. Rosenberg, “A survey on context-aware systems,” Int. J. Ad Hoc Ubiq. Compu., vol. 2, no. 4, pp. 263–277, 2007. [29] S. Loke, Context-Aware Pervasive Systems: Architectures for a New Breed of Applications. Auerbach Publications, 2006. [30] M. M. Al-Doori, A. H. Al-Bayatti, and H. Zedan, “Context aware architecture for sending adaptive hello messages in vanet,” in Proc. ACM CASEMANS, Copenhagen, Denmark, 2010, pp. 65–68. [31] H. Chen and T. Finin, “An ontology for context-aware pervasive computing environments,” Know. Eng. Rev., vol. 18, pp. 197–207, 2003. [32] Q. Ji, P. Lan, and C. Looney, “A probabilistic framework for modeling and real-time monitoring human fatigue,” IEEE Trans. Syst., Man, Cybern. A, vol. 36, no. 5, pp. 862 –875, Sep. 2006. [33] G. Rigas, C. D. Katsis, P. Bougia, and D. I. Fotiadis, “A reasoning-based framework for car driver’s stress prediction,” in Proc. IEEE Medit. Cont. Auto. Conf., Ajaccio, France, Jun. 2008, pp. 627 –632. [34] K. Livescu, O. Cetin, M. Hasegawa-Johnson, S. King, C. Bartels, N. Borges, A. Kantor, P. Lal, L. Yung, A. Bezman, S. Dawson-Haggerty, B. Woods, J. Frankel, M. Magami-Doss, and K. Saenko, “Articulatory feature-based methods for acoustic and audio-visual speech recognition: Summary from the 2006 jhu summer workshop,” in Proc. IEEE ICASSP, vol. 4, Honolulu, HI, Apr. 2007, pp. 621–624. [35] G. Yang, Y. Lin, and P. Bhattacharya, “A driver fatigue recognition model based on information fusion and dynamic bayesian network,” Info. Scie., vol. 180, no. 10, pp. 1942–1954, May 2010. [36] V. Pavlovic, J. M. Rehg, T. Cham, and K. P. Murphy, “A dynamic bayesian network approach to figure tracking using learned dynamic models,” in Proc. IEEE Comput. Visi., vol. 1, 1999, pp. 94 –101. [37] X. Li and Q. Ji, “Active affective state detection and user assistance with dynamic bayesian networks,” IEEE Trans. Syst., Man, Cybern. A, vol. 35, no. 1, pp. 93 – 105, Jan. 2005. [38] C. Bettini, O. Brdiczka, K. Henricksen, J. Indulska, D. Nicklas, A. Ranganathan, and D. Riboni, “A survey of context modelling and reasoning techniques,” Perva. Mobi. Comput., vol. 6, no. 2, pp. 161–180, 2010.
12
[39] H. Wu, “Sensor fusion for context-aware computing using dempstershafer theory,” Ph.D. dissertation, Robotics Institute, Carnegie Mellon Univ., Dec. 2003. [40] Y. Zhang, Q. Ji, and C. Looney, “Active information fusion for decision making under uncertainty,” in Proc. IEEE Info. Fusi., vol. 1, Annapolis, USA, 2002, pp. 643 –650. [41] Z. Ghahramani, “An introduction to hidden markov models and bayesian networks,” Int. J. Patt. Recog. AI, vol. 15, pp. 9–42, 2001. [42] K. P. Murphy, “Dynamic bayesian networks: representation, inference and learning,” Ph.D. dissertation, Univ. of California, 2002. [43] F. V. Jensen and T. D. Nielsen, Bayesian Networks and Decision Graphs, 2nd ed. Springer Publishing Company, 2007. [44] I. Daza, N. Hernandez, L. Bergasa, I. Parra, J. Yebes, M. Gavilan, R. Quintero, D. Llorca, and M. Sotelo, “Drowsiness monitoring based on driver and driving data fusion,” in Proc. IEEE ITSC, Washington, DC, Oct. 2011, pp. 1199 –1204. [45] L. M. Bergasa, J. Nuevo, M. A. Sotelo, R. Barea, and M. E. Lopez, “Real-time system for monitoring driver vigilance,” IEEE Trans. Intell. Transp. Syst., vol. 7, no. 1, pp. 63 –77, Mar. 2006. [46] W. Qing and Y. WeiWei, “A driver abnormality recondition model based on dynamic bayesian network for ubiquitous computing,” in Proc. IEEE ICACTE, vol. 1, Chengdu, China, Aug. 2010, pp. 320–324. [47] E. L. Co, K. B. Gregory, J. M. Johnson, and M. R. Rosekind, “Crew factors in flight operations xi: A survey of fatigue factors in regional airline operations,” NASA, Moffett Field, California, NASA Ames Research Center, Tech. Rep., 1999. [48] D. H. Harris, “Visual detection of driving while intoxicated,” Human Factors: J. Hum. Fact. Ergo. Soci., vol. 22, no. 6, pp. 725–732, 1980.
Saif Al-Sultan received the B.Sc. degree from the University of Technology, Baghdad, Iraq, in 2004. He is currently a Doctoral Researcher with the Software Technology Research Laboratory, De Montfort University, Leicester, UK. His current research interests include context-aware system, VANET and intelligent transportation systems.
Ali H. Al-Bayatti received his B.Sc. from the University of Technology, Baghdad, Iraq, in 2005 and and the Ph.D. degree from the Software Technology Research Laboratory, De Montfort University, Leicester, UK in 2009. Dr. Ali Al-Bayatti is currently a Research Fellow and Head of Intelligent Transportation theme at Software Technology Research Laboratory, De Montfort University. He leads the Intelligent Transportation theme where his research deals with vehicular (e.g. Vehicular Ad hoc Networks) and smart technologies (e.g. Context-aware Systems) that promote collective intelligence. Applications range from promoting comfort, to enabling safety in critical scenarios. The goal of his research is to improve the effectiveness, efficiency, mobility and safety of transportation systems. His current research interests include Intelligent transportation, Vehicular Ad hoc Networks, Mobile Computing, Wireless Computing, Context-aware Systems; Pervasive Computing and Computer/Mobile Security.
Copyright (c) 2013 IEEE. Personal use is permitted. For any other purposes, permission must be obtained from the IEEE by emailing
[email protected].
This article has been accepted for publication in a future issue of this journal, but has not been fully edited. Content may change prior to final publication. IEEE TRANSACTIONS ON VEHICULAR TECHNOLOGY
13
Hussein Zedan He was graduated from Bristol University with a PhD in Mathematics and has worked there as both a Research Scientist and a Lecturer. This is followed by academic career in Oxford University (as a Research Fellow and University Lecturer), the University of York (as a Reader, Professor and HoD) and finally he was brought to set up an R&D laboratory, known as Software Technology Research Laboratory, at De Montfort University. He is currently the Technical Director of a University Technology Centre (UTC) in Software Evolution, which is funded by Software Migration Ltd. (SML). He has published 4 books and over 190 technical papers and articles in highly reputable journals and international conferences. Hussein Zedan is a Professor of Software Engineering with over 30 years experience as an academic, consultant and practitioner in Computer Science and IT industry. His principal areas of technical expertise are: software engineering techniques involving object technology; rapid application development (RAD) and component-based development; Grid technology; Computer Security; trust and Critical Systems and Context Aware System.
Copyright (c) 2013 IEEE. Personal use is permitted. For any other purposes, permission must be obtained from the IEEE by emailing
[email protected].