(PRD) has already been performed in [5], where it is shown that a 30% error ratio in the QRS detection algorithm may affect the performance as 21% in PRD.
Context-aware Multi-lead ECG Compression Based on Standard Image Codecs Maria G. Martini
Alessandro Polpetta and Paolo Banelli
WMN, MINT Centre DIEI University of Perugia Faculty of Computing, Information Systems and Mathematics Via Duranti Kingston University London Perugia, Italy KT12EE, UK Email: {alessandro.polpetta, paolo.banelli} @ diei.unipg.it Email: m.martini @ kingston.ac.uk
Abstract—The use of telemedicine capabilities to manage aged and cardiac chronically ill patients is going to become a common practice. Usefulness and diagnostic value of classical ECG monitoring and recording can be enhanced by jointly collecting and analysing data detected by other sensors (e.g. movement detectors) which enable to associate specific cardiac events with the patient’s environment and activity at the time epoch the cardiac event appears. In this scenario, characterized by a continuous growth of data volume to be stored and transmitted, data compression plays a crucial role. In this paper we propose a compression method aimed at preserving and exploiting the different diagnostic importance of different ECG segments, making smart use of context information, i.e. information about the patient’s condition. Specifically, we focus on a 2D compression method that exploits the features of JPEG2000 compression and we propose a novel paradigm for context-adaptive compression of ECG data. Index Terms—ECG, Holter, compression, video coding, quality assessment, medical sensor networks
I. I NTRODUCTION The use of telemedicine capabilities to manage aged and cardiac chronically ill patients is becoming more and more clinically relevant and economically cost-effective. There are two different ways in which electrocardiogram (ECG) data can be transmitted in a telecardiology environment: real-time and store-and-forward (prerecorded) transmission. Store-and-forward ECG transmission has been widely used in earlier telecardiology systems where real-time ECG interpretation and/or supervision was not crucial [1]. An example of store-and-forward ECG transmission would be that of a General Practitioner (GP) recording an ECG at patient’s home, followed by transmission to a cardiologist for analysis and interpretation. Store-and-forward ECG transmission is extensively used due to its simplicity and efficiency. In some scenarios real-time transmission is essential, whereas in others a delay of a few minutes is tolerated. The compression and transmission characteristics should thus be adapted to the considered scenario. Several studies have shown that 12-lead ECG performed within an ambulance increases the critical available time to administer thrombolytic therapy effectively, stopping a heart
attack in progress and preserving heart muscle function. Storeand-forward ECG transmission is also possible from the ambulance to the hospital, although in this case the delay should be limited, since quasi-real-time ECG monitoring by a cardiologist in a hospital allows a reduction in the time needed for patients evaluation once he arrives at the hospital. Cardiologists can gain useful insight into a patient’s condition when they are able to correlate the patient’s symptoms and activities. For this purpose, a Holter Monitor, a portable electrocardiogram recorder worn by the patient for a period of 24-72 hours, is often used. Preferably, the monitor is not cumbersome to the patient and it should be designed to be as small and light as possible. The simultaneous use of other sensors for the detection and analysis of other conditions related the patient (e.g. movement detectors) and the joint analysis of data collected from the different sensors can improve the diagnostic value of the ECG data collected, by enabling the association of specific cardiac events to the patient’s status at the time the event takes place. The storage requirements for such different long signals are very large. Furthermore, if the collected data need to be transmitted to a specialist for analysis, the data-rate of the data collected by the multiple sensors should be made compatible with the characteristics of the available networks. For these reasons, signal compression is often employed. At the same time, the decompressed signal must contain enough detail for the cardiologist to be able to identify irregularities. Lossless compression is typically used for biosignals, due to the requirement to keep the possibly critical information available in the signal. However, a compression method which, although lossy from the information-theoretic point of view, is able to keep the diagnostic information would be beneficial. For an ECG signal, each of the component waveforms has a specific significance in diagnosis of various cardiovascular diseases. Medical experts focus on features such as duration, amplitude and shape of individual segments in the ECG signal. Most of these features can be distinguished in the time domain [2]. Some of the key diagnostic features of ECG signals are reported in [3]. Generally, the goal of ECG data compression is to reduce
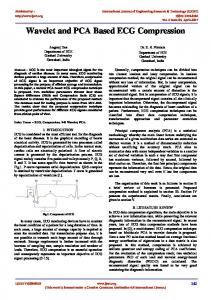
the bit-rate by preserving at the same time the signal quality for clinical evaluation. To achieve this goal, many ECG data compression methods have been proposed over the last four decades. Two-dimensional (2-D) approaches to heartbeat signal compression have recently been proposed [4] [5] [6] [7] in order to exploit both sample-to-sample and beat-to-beat correlation. In this case, an ECG signal is first cut and beat-aligned to form a 2-D array. Then, 2-D data compression is applied [4]. In this paper we propose a multi-channel compression method based on the importance of the different ECG components for diagnosis and on context information, i.e. information about the disease to diagnose: in some cases, ECG monitoring is performed for screening for a specific cardiac risk [3], [2] and different features of the ECG signal have a different importance depending on the risk to assess or disease to diagnose. We focus on a 2D compression method and in particular on the JPEG2000 compression standard. Such a standard allows the possibility to encode data in regions of interest (ROI) differently with respect to the background, i.e. it enables a non-uniform distribution of the available bit budget between a selected region (ROI) and the rest of the image (background). This is achieved by an appropriate scaling of the wavelet coefficients. The positive aspects of using a standard method for compression include availability of the (same) compression software in different medical centres and easy interoperability among systems. The remainder of this paper is organised as follows. Section II reports insights on the diagnostic quality of different portions of the ECG signal; Section III outlines the multi-lead scenario considered in this article and the adopted methodology is described in Section IV. Quality assessment methods considered are defined in Section V. Finally, simulation results are reported in Section VI. II. D IAGNOSTIC QUALITY OF ECG SIGNALS A schematisation of an ECG wave is reported in Fig. 1. Each beat in an ECG signal consists of several waves, named P through U, with several intervals of the beat named after the waves. The abnormal characteristics of these components may indicate the type of disorder affecting the patient. When diagnosing a patient, a specialist takes into account characteristics such as the length of an interval, the polarity, amplitude or elevation/depression of a beat component. Surface 12-lead electrocardiogram (ECG) is crucial for the rapid identification of patients with acute coronary syndrome. The early and accurate identification of the infarct-related artery from the ECG can help physicians to predict the location of myocardium at risk and guide the decisions regarding the urgency of revascularization and reperfusion strategy in emergency management. In particular, a detailed analysis of ECG patterns of ST-segment change would change the manner in which reperfusion therapy is managed [8]. Different portions of the ECG signal provide insights on
Fig. 1.
Schematisation of an ECG wave.
different possible pathologies and when compression is performed this aspect should be taken into account. For example, the QRS complex of an ECG cycle occupies a relatively low percentage of the whole cycle, but it is the most important portion from a diagnostic point of view for many diseases. If this portion suffers from high error and other ECGcycle portions do not have errors, an artificially low numerical result in distortion will occur. Hence, a given distortion in one portion does not inevitably have the same influence as the same distortion in another portion. As another example, in [2] the criteria for abnormal Q waves are reported as follows based on previous studies: • Q wave > 1/3 (> 1/4 according to some authors) of the ensuing R wave in depth and/or > 0.04 s in duration in at least two leads except aVR ; • Q wave > 3mm in depth and/or > 0.04 s in duration in at least two leads except aVR . Such criteria have been reformulated in [2] in terms of criteria based only on the Q wave. Similarly, the diagnostic value of the U wave for other specific diseases is highlighted in [9]. The importance of specific portions of the heart cycle for pre-participation screening of young competitive athletes for prevention of sudden cardiac death is highlighted in [3]. For these reasons our compression approach focuses on the provision of different compression ratios for different portions of the heart cycle, where the ROI is selected according to context information (disease / cardiac event to detect, status of the patient). III. P ROBLEM S TATEMENT We propose an ECG compression approach that can compress one or more leads of an ECG system. Although a standard 12-lead ECG system shows the heart electrical activity
in 12 different leads, some of them do not carry information. Indeed only 8 leads are necessary to perfectly reconstruct all the information of a complete 12-leads ECG system, as long as the leads III, aVL , aVR , aVF can simply be obtained by the two main leads I and II, with the following equations: III = II − I
(1)
aVL = (I − III)/2
(2)
aVR = (I + II)/2
(3)
aVF = (II + III)/2
(4)
For this reason we can compress the signals obtained from a 12-lead ECG system simply by compressing the two limbleads I and II and the six chest-leads V1 , V2 , V3 , V4 , V5 and V6 . We will thus refer in the following to a 8 channels ECG, which is from this point of view equivalent to a 12-lead ECG. In order to compress jointly the available channels, we propose to exploit a 2-D compression methods, by organising the data from the different leads in a 2-D array. Due to the considerations in Section II, we propose to identify regions of the resulting image as ROIs, according to the ROIs in the ECG cycle pattern. To this end we propose the use of the JPEG2000 standard [10], which is based on wavelet coding, it provides its own ROI tools capabilities, and it is nowadays considered the standard that, for a given quality, allows the highest compression ratios with respect to any other image compression standard. IV. M ETHODOLOGY As already proposed in [4], the structure of ECG signals suggests the possibility of constructing a 2-D array from a 1D ECG signal. To this end, the QRS complex of each heartbeat is first detected in order to cut the ECG signal into different segments, which are finally aligned with one another to form a 2-D data array. For 1-D heartbeat data, the proposed algorithm is implemented in the following steps: • QRS detection; • conversion of the original signal to the desired bit resolution and sampling rate N [samples / beat cycle], where N is the width of the 2-D data array; • construction of a 2-D ECG data array; • identification of regions of interest according to the context information; • compression of the image with an image compression codec (e.g. JPEG2000) according to the identified ROIs; • processing of the compressed image and re-organisation of the data in the form of 1-D ECG signal; The algorithm’s performance is assessed via simulations, in order to characterize the trade-off between compression and distortion in each different ROI. We proceed in the following with a more detailed description of each stage.
A. ECG Detection and Segmentation We first segment the ECG signals by detecting the QRS complex in order to map a beat cycle into a row of the image. To this end, QRS detection can be performed by automatic detection algorithms available in the technical literature. However, in order to have results independent of a specific QRS detection algorithm, we will use in the following the relevant annotations provided in the MIT database [11]. Noteworthy, an evaluation of the impact of QRS detection on the resulting quality in terms of percentage root-mean-square difference (PRD) has already been performed in [5], where it is shown that a 30% error ratio in the QRS detection algorithm may affect the performance as 21% in PRD. Once two QRS complexes are detected, a heartbeat cycle is identified as the part of the signal between the position 150 ms before the first QRS complex detection and the position 150 ms before the second one.
B. Period Normalization The set of ECG segments can be rearranged into an M × N matrix where the M rows are filled with consecutive ECG cycles, and where N is the length of the normalized period of each ECG cycle. However, the length of each heartbeat segment generally changes with time, whereas the rows of an image have the same length. Two alternative solutions to properly organise heartbeats in an image consist in matching all the row lengths either by zero-padding or by time-stretching the segmented ECG cycles with an opportune signal resampling. In this paper we adopt the latter solution, since our goal is to compress with different CR and quality different portions of the heartbeat, and it is important to have alignment among the different significant portions in subsequent heartbeats. Moreover the first approach could lead to unacceptable results when the patient beat cycles are very irregular. Specifically for the resampling strategy we resorted to spline interpolation. Given such an approach, the image size can be adapted to the maximum cycle length or to its mean value. Thus, in the remainder of the paper, depending on the different sampling rate of the original ECG signal in the two data-base we used, we will consider images of size 512×512 or 352×352, which correspond, in the case of 8 ECG channels, to 44 heart beats, i.e. about 40s. In [7] it is shown that the period transformation described above will not cause distortion in the normalized segments of the recovered waveforms. However, it is important to note that in order to recover the original time duration of each segment by a reverse interpolation, it is necessary to know the specific resampling ratio that has been used, which needs to be stored or transmitted as a further side information. Thus, a number of parameters equal to the number of image rows (number of heart cycles in the single channel case) have to be included in each compressed frame, with a small penalty on the effective compression ratio.
C. ECG Leads arrangement For multi-lead ECG, we can arrange the signals obtained by each lead of the system in two different ways. • Inserting in an image a number of heart cycles from each lead equal to M/Nleads followed by the ones of the subsequent leads; • Inserting the information about the first heartbeat from all the Nleads (e.g. 8 leads), then the information about the second heartbeat from all the Nleads (e.g. 8 leads) and so on. Following data arrangement in a matrix of proper size, we can then apply any 2-D data compression technique. D. ROI identification and ROI based compression Thanks to the proposed data organization in a 2-D array, ROIs in subsequent heartbeats result to be aligned in the image. Hence, a specific ROI in the ECG signal almost results in a rectangular ROI in the image, with height equivalent to the height of the image. Consequently, image compression can be performed taking the shape of such ROIs into account, together with the context information that tells us how much the compression should be ”unbalanced” in favor of a specific ROI. In the example reported in Section VI, we split the image in two portions, where each portion has half the columns of the original image. The first portion contains the QRS complex, and alternatively the first or the second sub-image is considered as the ROI. In this case, the two sub-images, one of which the ROI, can also be compressed as independent images. The JPEG2000 codec OpenJPEG v1.3 has been used for simulations, by applying different compression ratios on the different portions of images obtained with ECG data. V. Q UALITY ASSESSMENT Ideally we would like to compress the signal losslessly, but in many applications this is not an option. Thus, given a fixed bit budget, in the view of the considerations in Section II, it makes sense to spend more bits to represent those parts of the signal that belong to a specific ROI and, thus, reconstruct them with higher fidelity, while allowing other parts to suffer a larger distortion. Consequently, also the performance assessment of the proposed methodology should take this approach into account. In general, the main goal for any compression procedure consists in reducing as much as possible the bit-rate of the signal by keeping an acceptable quality or, equivalently, by improving as much as possible the quality for a fixed assigned bit-rate. Thus, the two most important parameters are the compression ratio and the quality of the signal. Specifically, in our scenario, we can define two different compression ratios, expressed by: CRecg =
number of bits in the original ECG signal number of bits in the compressed data
(5)
CR =
number of bits in the original image . number of bits in the compressed data
(6)
The two ratios are different due to the signal pre-processing of the ECG data, which is requested to fit each heartbeat in the image matrix (including resampling). As already mentioned, some side information should be added to the compressed data, including the original dynamic range and the original heartbeat lengths which are requested to reconstruct the signal. However, the bit-rate of such side information is negligible with respect to the data-rate of the compressed signal. Since with our proposed algorithm we will compress different portions of the ECG signal with different compression ratios, we will consider not only the overall compression ratio, but also the compression ratios of specific portions of the signal. For instance, when the signal is split in two different portions, as in the examples shown in Section VI, we can define: CRI =
R/2 R1
(7)
CRII =
R/2 R2
(8)
R , (9) R1 + R2 where R is the size of the image in raw format (in bits), R1 is the size of the compressed data associated to the first portion of the image and R2 is the size of the compressed data associated to the second portion of the image. Note that all these compression ratios are related each other according to CRT OT =
CRT OT CRI . (10) 2CRI − CRT OT Ideally, quality measures should account for diagnostic information in the reconstructed ECG signal. However, diagnostic information is quite subjective and dependent on the patient/application. Indeed, depending on the main risk a patient is subject to, some information can be more important than other. Regardless of ongoing research in the area, standard quantitative measures that account for clinically important ECG signal characteristics have not been widely established and the most widely used measure for quality assessment of ECG compression is the percentage root-mean-square difference (PRD). The PRD measure is defined as: v u PL u e(n))2 n=1 (x(n) − x × 100 (11) P RD = t P L 2 n=1 (x(n) − x) CRII =
where x(n) is the original signal, x e(n) is the reconstructed signal, x is the signal mean and L is the PRD observation window. We will consider this expression in the results shown in section VI as the reference case.
Some papers consider a different PRD definition, neglecting the term x in 11, which however is preferable because it makes the PRD definition independent of the dc level of the original signal. Some articles that show results that are based on the MITBIH arrhythmia database, conversely adopt a fixed 1024-offset [12] [4] [5], i.e. they substitute the value 1024 to x in 11. However, when the mean x is remarkably different from 1024, results are significantly biased and misleading (see e.g. [5]). Since our algorithm focuses on compression of different portions of the signal with different compression ratios, we also define
P RDni ,ni+1 =
sP
n
i+1 e(n))2 n=ni (x(n) − x P × 100 ni+1 2 n=ni (x(n) − x)
(12)
as the PRD calculated in a specific portion of the signal from sample ni to sample ni+1 . Since in the examples shown in Section VI we split each heartbeat in two parts, we will also consider the two following metrics: P RDI = P RD1,⌊N/2⌋
(13)
P RDII = P RD⌊N/2⌋+1,N
(14)
representing the PRD calculated in the first and second portion of the signal, respectively. Note that the PRD calculation depends on the energy of the signal: if the compression error is evenly distributed over the ECG samples, the portions of the signal with higher energy will have a lower PRD. This will be observed in section VI. VI. S IMULATION R ESULTS This section shows CR and PRD results for ECG signals recorded in the MIT-BIH Arrhythmia database [11] and in the St. Petersburg Institute of Cardiological Technics (SPICT) 12lead Arrhythmia Database. Specifically, we consider the record 117 from the MIT-BIH Arrhythmia database in the first set of simulations shown in Figures 2-4, and the record I01 from the SPICT Arrhythmia database for the simulation results shown in Figures 5-7. Figure 2 shows the PRD versus the compression ratio CRI of the ROI (QRS), by setting a fixed target compression ratio equal to 16:1, and by accordingly varying the compression ratio CRII of the second part of the image. As CRI increases, CRII decreases in order to keep the global CRT OT constant. The considered compression ratios for the different portions of the image/ECG signal are conveniently reported in Table I, which clarifies that at the left hand side of Figure 2 the compression ratios are more unbalanced in the two portions of the image and the improvement in the first portion is higher, at the expense of a poorer quality in the second portion. Note that, when the image compression ratio is 16:1, the actual ECG compression ratio, including data processing and overhead, is 13.5:1. Moreover, we report the comparison between two
different frame formats (512 × 512 and 256 × 512). We can observe that for larger frames (i.e. 512 × 512, where the two portions 512 × 256 are encoded separately) slightly better performances can be achieved, at the expense of a double delay. When delay is not an issue, considering larger frames is thus beneficial, since the redundancy of a higher number of heartbeats can be considered jointly. Fig. 2 also shows that when the compression ratio is the same for the two regions (CRI = CRII = CRT OT = 16), independent coding of the two regions provides worse results on the QRS complex region, but better results on the remainder of the signal, with respect to a whole image compression. This is due to the fact that the TQ interval has a low frequency content and it can be better compressed if it is considered independently from the rest of the heartbeat. TABLE I C OMPRESSION RATIOS CONSIDERED IN F IGURE 2
A B C D E F G
CRI 10 11 12 13 14 15 16
CRII 40 29.3 24 20.8 18.7 17.1 16
CRT OT 16 16 16 16 16 16 16
However there are also situations where the second portion of the heart cycle is more important for diagnostic purposes [9], which lead us to fix the second part of the image as the actual ROI, which request to be less compressed than the rest of the image. For instance, Figure 3 reports the PRD versus the compression ratio CRII of the second portion of the image, when the ROI is represented by the U wave. Also in this case we chose a target global CR equal to 16:1, and we report in Table II the corresponding CRs for the two portions of the image (ECG signal). Also in this scenario, the improvement in PRD in the region of interest (including U waves), that is located in the second half of the image, is evident. TABLE II C OMPRESSION RATIOS CONSIDERED IN F IGURE 3
A B C D E F G
CRI 40 29.3 24 20.8 18.7 17.1 16
CRII 10 11 12 13 14 15 16
CRT OT 16 16 16 16 16 16 16
In Figure 4 we plot a portion of the ECG waveform (MITBIH arrhythmia record 117) when CRI = 10, CRII = 40 (CRT OT = 16), which corresponds to the left margin of Figure 2 (i.e. combination A in Table I), to a frame size 512 × 512, and to the first ROI (QRS complex). Figure 4 also shows the error signal to highlight that the error is remarkably lower in the ROI than in the remaining part of the signal.
20 (512)
PRD PRD(512)
18
ref
PRD(256) (256) PRDref
16 14 PRD
PRD
II
12 10 8 PRDTOT 6 4 2 10
PRDI 11
12
13 CR
14
15
16
I
Fig. 2. PRD versus CRI . First ROI. Comparison between image formats 512 × 512 and 256 × 512 is also represented.
PRD
11
TOT
PRD
Results reported in the following refer to the joint compression of multi-lead ECG data. Figure 5 reports the image representation of the I01 record from the St. Petersburg Institute of Cardiological Technics 12lead Arrhythmia Database, in the case of raster scan of the 8 independent channels and in the interlaced case. The images, with resolution 352×352, report 44 heartbeats of an 8 channels ECG (I01 record). On the left, images before compression are shown. Fig. 5[a] shows the image with channels inserted in raster scan, whereas Fig. 5[b] shows the image with interleaved channels. On the right, the compressed images, with CRI = CRII = 16, are reported. Figures 6 and 7 report PRD values for the I01 record. As above, the image is split in two parts, here with size 352 × 176 each. The first part (including the QRS complex) is assumed to be the region of interest and it is compressed with a lower compression ratio. PRD values are reported versus the (image) compression factor CRI for the first region of interest (including the QRS complex). The different combinations of compression ratios in the two areas of the signal are reported in Table III.
I
10
TABLE III C OMPRESSION RATIOS CONSIDERED IN F IGURES 6 AND 7
PRDII PRD
9
TOT,ref
PRD
I,ref
8
A B C D E
PRD
PRD
II,ref
7 6
CRI 12 13 14 15 16
CRII 24 20.8 18.7 17.14 16
CRT OT 16 16 16 16 16
5 4 3 10
11
12
13 CR
14
15
16
II
117 record signal (quantization level) Error Signals (quantization level)
Fig. 3.
PRD versus CRII . Second ROI.
Error CR = 10 ; CR = 40 I
10
II
ErrorREF CRTOT = 16
5 0
As in the previous case, the global compression ratio is 16:1, whereas in this case the actual ECG compression ratio CRecg , including data processing and overhead, is 8. The worse performance with respect to the 117 Arrhythmia record is due to the different characteristics of the signal considered here. In the case of images obtained with all the independent channels, the delay is significantly reduced with respect to the single channel case. Comparing Fig. 6 and Fig. 7, it is easy to assert that the case of raster scan of the 8 independent channels provides better results with respect to the interlaced case since the images obtained (see Fig. 5[a]) offer a more uniform pattern for the JPEG2000 encoder.
−5 −10 99
C ONCLUSIONS 99.2
99.4
99.6 time(s)
99.8
99.6 time(s)
99.8
100
100.2
200 100 0
−100 −200 −300 99
99.2
99.4
100
100.2
Fig. 4. Record 117, compressed with CRI = 10, CRII = 40 (CRT OT = 16); Firts ROI (QRS complex). The error signal is also reported.
Focusing on a 2D compression method and in particular through the exploitation of the features of JPEG2000 compression, we have proposed a novel paradigm to encode with different characteristics portions of the signal with different diagnostic importance, based on the available information on the patient conditions. Results show that such a method allows performance improvement in the regions of interest, in terms of PRD versus compression ratio. Useful insights about the quality achieved in different portions of the signal with different compression ratios are also reported.
PRD
TOT
9
PRD
I
8.5
PRD
II
PRDTOT,ref
8
PRDI,ref
PRD
7.5
[a]
[b]
PRDII,ref
7 6.5 6 5.5 5 4.5 12
13
14 CR
15
16
I
[c]
Fig. 7. PRD values for the I01 record versus the (image) compression factor CRI for the first region of interest. Raster scan case.
[d]
Fig. 5. Images reporting 44 heartbeats of an 8 channels ECG (I01 record). [a] Channels inserted in the image in raster scan - original image; [b] channels inserted in the image in raster scan - compressed image, CRI = CRII = 16; [c] channels interleaved - original image; [d] channels interleaved - compressed image, CRI = CRII = 16.
11 PRDTOT PRDI
10
PRD
II
PRDTOT,ref
PRD
9
PRDI,ref PRD
II,ref
8
7
6
5 12
13
14 CR
15
16
I
Fig. 6. PRD values for the I01 record versus the (image) compression factor CRI for the first region of interest. Interlaced case.
ACKNOWLEDGEMENTS This work was partially supported by British Council and MIUR in the British-Italian partnership programme: ”Reconfigurable Healthcare for Intelligent Cardio Vascular Disease (CVD) Monitoring and Management”. R EFERENCES [1] A. Alvaro, S. Olmos, R. S. H. Istepanian, and J. Garcia, “Enhanced real-time ECG coder for packetised telecardiology applications,” IEEE Trans. Information Technology in Biomedicine, vol. 10, no. 2, pp. 229– 236, April 2006.
[2] T. Konno, M. Shimizu, H. Ino, M. Yamaguchi, H. Terai, K. Uchiyama, K. Oe, T. Mabuchi, T. Kaneda, and H. Mabuchi, “Diagnostic value of abnormal Q waves for identification of preclinical carriers of hypertrophic cardiomyopathy based on a molecular genetic diagnosis,” European Heart Journal, vol. 25, pp. 246–251, 2004. [3] D. Corrado, C. Basso, M. Schiavon, A. Pelliccia, and G. Thiene, “Preparticipation screening of young competitive athletes for prevention of sudden cardiac death,” Journal of the American College of Cardiology, vol. 52, no. 24, pp. 1981–1989, 2008. [4] H. Lee and K. M. Buckley, “ECG data compression using cut and align beats approach and 2-D transforms,” IEEE Transactions on Biomedical Engineering, vol. 46, no. 5, pp. 556–564, May 1999. [5] H.-H. Chou, Y.-J. Chen, Y. C. Shiau, and T.-S. Kuo, “An effective and efficient compression algorithm for ECG signals with irregular periods,” IEEE Transactions on Biomedical Engineering, vol. 53, no. 6, pp. 1198– 1205, June 2006. [6] E. Alexandre, A. Pena, and M. Sobreira, “On the use of 2-D coding techniques for ECG signals,” IEEE Trans. on Information Technology in Biomedicine, vol. 10, no. 4, pp. 809–811, Oct. 2006. [7] J. J. Wei, C. J. Chang, N. K. Chou, and G. J. Jan, “ECG data compression using truncated singular value decomposition,” IEEE Trans. on Information Technology in Biomedicine, vol. 5, no. 4, Dec. 2001. [8] K. H. Chenga et al., “Electrocardiographic algorithms for predicting the complexity of coronary artery lesions in ST-segment elevation myocardial infarction in ED,” American Journal of Emergency Medicine, vol. 26, pp. 10–17, 2008. [9] J. A. Vila, Y. Gang, J. M. Rodriguez-Presedo, M. Fernandez-Delgado, S. Barro, and M. Malik, “A new approach for TU complex characterisation,” IEEE Transactions on Biomedical Engineering, vol. 47, no. 6, pp. 764–772, June 2000. [10] D. S. Taubman and M. W. Marcellin, JPEG 2000: Image Compression Fundamentals, Standards and Practice. Kluwer International Series in Engineering and Computer Science, 2002. [11] G. Moody, “MIT-BIH arrhythmia database, overview (2nd ed.),” Massachusetts Institute of Technology, Cambridge, Aug. 1992. [12] A. Bilgin, M. W. Marcellin, and M. I. Altbach, “Compression of electrocardiogram signals using JPEG2000,” IEEE Transactions on Consumer Electronics, pp. 833–840, 2003.