or the UDOO board [12]. Event Collector. Complex Event. Detector. Complex Event. Publisher. Data Sources. Value-add Info. DOLCE Rules. Events. Complex.
Context-Aware Stream Processing for Distributed IoT Applications Adnan Akbar, Francois Carrez, and Klaus Moessner
Juan Sancho, Juan Rico
Institute for Communication Systems (ICS) University of Surrey, UK Email:{adnan.akbar, f.carrez, k.moessner}@surrey.ac.uk
Internet of Everything Lab ATOS, Spain Email:{juan.sancho.external, juan.rico}@atos.net
Abstract—Most of the IoT applications are distributed in nature generating large data streams which have to be analyzed in near real-time. Solutions based on Complex Event Processing (CEP) have the potential to extract high-level knowledge from these data streams but the use of CEP for distributed IoT applications is still in early phase and involves many drawbacks. The manual setting of rules for CEP is one of the major drawback. These rules are based on threshold values and currently there are no automatic methods to find the optimized threshold values. In real-time dynamic IoT environments, the context of the application is always changing and the performance of current CEP solutions are not reliable for such scenarios. In this regard, we propose an automatic and context aware method based on clustering for finding optimized threshold values for CEP rules. We have developed a lightweight CEP called µCEP to run on low processing hardware which can update the rules on the run. We have demonstrated our approach using a real-world use case of Intelligent Transportation System (ITS) to detect congestion in near real-time. Index Terms—Clustering, Complex event processing, contextaware, intelligent transportation system, internet of things, machine learning, real-time
I. I NTRODUCTION Internet of things (IoT) is based on the vision of connecting everyday objects to internet in order to form a cyber-physical system, where every object will be represented by its virtual representation enabling the control of physical world remotely [1]. In this regard, the low cost and wide distribution of IoT devices have not only increased the opportunities for innovative applications but have also increased the number of devices connected to the internet. According to CISCO, by the end of 2020, there will be almost 50 billion devices connected to internet [2]. As a consequence, the complexity and the amount of data generated by these devices is also increasing. Many of these applications are distributed in nature and require real-time processing of data such as transportation systems or supply chain logistics. Such applications require methods which are capable of interpreting patterns, apply them to current situations and take accurate decisions with minimal time latency. Data is in the form of real time events requiring a paradigm shift in the methodology for analyzing and inferring high level knowledge. Real time data analysis in such cases means that data have to be analyzed before the data are stored. As an example, let’s consider an Intelligent Transportation
System (ITS) for detecting a congestion; if all the data is gathered in a central platform and then analyzed, it would detect the congestion long after it has already happened and resulting in no added value in order to meet their ambitions. Instead, such applications require distributed and near realtime solutions which can analyze the data on the fly and can infer high-level knowledge in near real-time. To extract high-level knowledge from this large amount of data in real-time, an Event Driven Architecture (EDA) called Complex Event Processing (CEP) has been proposed in recent years [3]. The research area of CEP includes processing, analyzing and correlating event streams from different data sources using distributed message-based systems to extract high-level or actionable knowledge in near real-time [4]. The core of the CEP is a rule-based engine which can extract casual and temporal patterns using pre-defined rules. CEP provides the processing capability of big data engines which enables it to analyze the data and extract patterns on the run in near real-time with distributed architecture. One of the major difference from traditional big data engines is that CEP can handle multiple events which are seemingly unrelated and can correlate them to provide a desired and meaningful output. The use of CEP is increasing in many IoT applications due to its ability to process large volumes of events in realtime. ITS is one of the main application which has seen the significant impact with the wide spread usage of IoT. The increasing number of traffic sensors in cities along with the recent concept of crowd sensing [5] has resulted into the amount of data generated to a level where conventional data analysis methods are proving to be a limiting factor. The ability of CEP to process data streams in real-time makes it ideal candidate for ITS as demonstrated by various works found in literature [6][7]. Similarly, there are other applications found in literature where CEP provides solution to manage and analyze data streams in near real-time such as supply chain management systems [8] and smart buildings [9]. In order to detect complex events, systems based on CEP require rules which have to be given manually by the system administrators, who are expected to have the required background knowledge; unfortunately sometimes is neither available nor so precise. The manual setting of rules and patterns limits the use of CEP only for domain experts and poses a weak point. And even though with prior expertise
and knowledge, experts are prone to make errors in choosing optimized parameters for dynamic systems. Systems based on CEP deploy static rules and there is no means to update the rules automatically. In real-time dynamic IoT applications, the context of the application is always changing and the performance of CEP will deteriorate in such scenarios. For example, a high temperature reading in summers will have different meaning as compared to the same reading in winters. Similarly, a high traffic density during the day is a normal event as compared to the same event happening late at night. Hence, a system based on CEP for extracting high-level knowledge should incorporate the current context into account and adapt its rules accordingly. In our work, we propose a distributed approach based on lightweight CEP called Micro Complex Event Processing (µCEP) which is developed to run on embedded devices with limited processing power and is able to update the rules on the fly. We propose a novel approach for finding optimized parameters for CEP rules using machine learning methods which is adaptive with respect to current context. Our propose architecture is able to infer complex events from raw data streams in a distributed manner by running on low processing boards and is able to provide adaptive solutions at the same time. A real-world example of ITS is used to elaborate our approach. In short, following contributions are made in this paper: • We propose and developed a distributed architecture for inferring complex events from raw data streams using lightweight complex event processing which is able to update rules automatically; • We propose and developed a novel method based on machine learning for calculating optimized parameters for CEP rules and update it according to the current context. The remainder of the paper is organized as follows. In section 2, we formally define the problem using a real-world example of ITS and highlight the drawbacks in current CEP based solutions. Section 3 explains our proposed architecture with the brief description of components involved. Section 4 is focused on the implementation and description of initial results. Finally, section 5 presents the conclusion and future work. II. P ROBLEM D EFINITION In this section, we formalize the problem with the help of a real-world use-case scenario of ITS. In the city of Madrid, thousands of heterogeneous traffic sensors have been deployed on different locations across the city. These sensors provide real-time information about the traffic flow in the city such as average traffic speed, average traffic intensity, type of traffic or type of road etc. CEP has the potential to provide a distributed solution for analyzing, correlating and inferring high-level knowledge from this large amount of data in near real-time. The core of CEP is a rule-based engine which requires rules for extracting complex patterns. These rules are based on different threshold values. For example, traffic speed can be
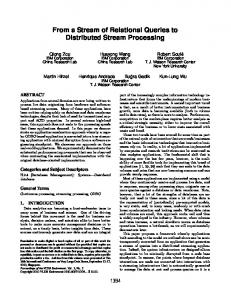
analyzed using a simple rule as “if current speed is less than a threshold speed then generate slow speed event”. The setting of these rules require system administrators to have prior knowledge about the system which is not always available and poses a weak aspect. Secondly, every road segment has a different response. There might be a road segment with speed restrictions as compared to a free flow road segment so the threshold values will be different for both road segments. In this way, at city level there will be hundreds of road segments and it is almost impossible for the administrators to understand the behavior of individual road segment. In current systems based on CEP, rules set by system administrators are static and there are no means to update them automatically. It can effectively degrade the performance of application as IoT mainly consist of dynamic environments where the context of application is always changing. For example in the event of bad weather or rain, traffic will move slowly and the rules which are set for normal conditions can generate a false alarm of congestion. Threshold values will be different in such conditions. In addition, the response of the road is also changing with respect to time. A road might have a different behavior in morning rush hours as compared to quite night hours. In short, following drawbacks have been identified in current technologies based on CEP: • Threshold values have to be set manually and there is no automatic way to find the optimal threshold values. • Threshold values set are static and once set, CEP system is unable to update it during run-time. • Current solutions are not context-aware and adaptive by nature. III. P ROPOSED A RCHITECTURE In our work, we propose to to exploit historical data in order to find optimized threshold values for CEP rules automatically. We have proposed an approach based on clustering analysis which is an unsupervised machine learning method to group the underlying data into different events and the boundaries separating the events serve as the threshold values for CEP rules. An overall architecture of the proposed solution is shown in the Figure 1. It consist of the following two main components. • Micro Complex Event Processing ( µCEP) Engine • Adaptive Clustering A. Micro Complex Event Processing Engine CEP Engine is a software component capable of detecting asynchronously, independent incoming Events of different types and generating a Complex Event by correlating all of these events. In this sense, Complex Events can be defined as the output generated after processing many small, independent incoming input data streams, which can be understood as a given collection of parameters at a certain temporal point. A CEP Engine is commonly provided with a series of plug ins or additional sub-components in order to improve data acquisition
Complex Events
Event Stream 1
Distributed IoT Applications Micro Complex Event Processing
Event Stream 2 Event Stream n
Real Time Updating of Threshold values
Historical Data
applications. The three functional modules represented in this architecture are introduced in the following sections: 1) Event Collector: This is the entry point to the µCEP Engine, whose primary goal is gathering all the information coming from specified sources, through different communication protocols and using varying data formats, known as data feeds or data sources. Once the module has been fed with data, its secondary objective consists in transforming the information into a specific data format, an Event, which will be then delivered to the Complex Event Detector module as presented in Figure 3.
Data Sources Kafka MQTT REST Database . . . Raw
Adaptive Clustering
Event Collector
Listener
Events
Fig. 1. Proposed Architecture and Block Diagram
from external sources, and also a sort of business logic to create the output of the system. The CEP Engine presented in this work is known as µCEP, which derives from the SOL/CEP engine provided by the FIWARE project [10]. From a conceptual and functional point of view, both SOL/CEP and µCEP are very similar, however the latter has disassembled the functionality of the former in three different software modules, as can be viewed in Figure 2. Thanks to the modularity and configurable design of the µCEP, this Engine can be implemented on hardware boards with limited processing capability such as Raspberry Pi [11] or the UDOO board [12]. Data Sources
DOLCE Rules
Complex Events
Events Event Collector
Value-add Info
Complex Event Detector
Complex Event Publisher
Fig. 2. µCEP system Architecture
The Event Collector module is responsible for reading data streams from different data sources and represent it in the form of internal events which can be processed by the Complex Event Detector module using rules defined in DOLCE language [13]. Complex Events detected are forwarded to the Complex Event Publisher module which is responsible for broadcasting the required information to different IoT
Format Adapters XML JSON NGSI-10 . . . Raw
Decoder
Fig. 3. Event Collector Module
In our work we have extracted the Event Collector module from the main engine‘s kernel as compared to previous version in order to provide better flexibility at the development stage. Now, it is up to the system developer which data source protocol should be used: Apache Kafka, MQTT, AMQP, or even periodic HTTP requests. In this sense, when running the engine in a constrained hardware board, the Event Collector module can be written in a way that implements the less required functionality (software libraries), thus minimizing the amount of memory needed to operate. Concerning the Decoder sub-module, its purpose is to translate the acquired data into the internal representation understood by the µCEP. 2) Complex Event Detector: The Complex Event Detector module can be understood as the kernel of the µCEP engine. It controls event detection and production of expected results by using temporal persistence of volatile events until constraints of rules are entirely satisfied. This module has been implemented using the standard C++ library, thus getting rid of unnecessary external libraries. The small, code-efficient implementation (less than 300 KB after compilation) of the component makes it possible to implement CEP functionalities in common utility hardware boards such as Raspberry Pi or the UDOO board. Each DOLCE Rules file served to the µCEP suffers a process of compilation allowing converted rules to be processed in a more efficient manner during runtime. Each time a rule is triggered, the engine composes a Complex Event
message (including data of incoming Events if desired) and output it to the Complex Event Publisher module. . 3) Complex Event Publisher: The last step for the data life cycle inside the µCEP engine is Complex Event Publisher. This module receives Complex Events and delivers them to the selected Data Sinks after transforming the complex events in the format required by external applications. It can be seen as the opposite functionality provided by the Event Collector module, as it also supports various communication protocols and data formats.
Data Acquisition
Extract data for specific time period
Feature scaling
of our proposed solution for adaptive clustering. In realtime scenarios, the definition of context is changing with time. In morning hours, traffic intensity is usually more with low average speed and hence the definition of bad traffic is different from the night hours when traffic is relatively smoother. The response of traffic is different at different time periods and hence we proposed to have different threshold values for different time periods. We time sliced the historical data in terms of morning, afternoon, evening and night traffic hours and extract the data only for specific time period. More details are described in the next section. After extracting the data, we apply feature scaling [16] in order to optimize the clustering algorithm. Feature scaling is a method to bring all the features on the same scale so they contribute equally to the clustering algorithm. The range of values of different features of traffic data are on different scale. If one of the feature has considerably wider range as compared to other features, the optimization function for clustering will be governed by that particular feature and will impact the boundaries. The general expression for feature scaling using standardization is X10 =
Acquire latest data Apply k-means clustering
Calculate silhouette index
Yes
Threshold Values
Real-time data
If silhouette index < 0.5
Fig. 4. Flow chart of Adaptive Clustering
B. Adaptive Clustering Clustering refers to the unsupervised machine learning method which is used for grouping similar objects on the basis of predefined metric such as distance or density. Clustering is a general technique used widely for knowledge discovery in big data sets and several variants of algorithms are found in the literature. Clustering separates the data into different possible events and group the data points from the same event together. The application of clustering is diverse and can be found in vast range of fields such as detecting credit card fraud from online transaction data [14] or detecting abnormalities from brain images data for medical research purposes [15]. In our work, we explore the application of clustering to find the boundaries between different events which can serve as threshold values for CEP rules. Figure 4 shows the flowchart
X1
− µ1 σ1
(1)
where X10 is the new feature vector after scaling, X1 is the initial feature vector, µ1 is the mean value of feature vector and σ1 is the variance of feature vector. We have implemented k-means clustering algorithm which is an iterative algorithm which forms the clusters by finding centroids such that the sum of the squares of distance from centroids to data is minimized [17]. For a data set X with n number of samples, it divides them into k number of disjoint clusters, each described by the centroid value. In the first initialization step, it assigns initial centroids, most commonly by selecting k number of samples randomly from the data set X. In a second step it assigns each sample to its nearest centroids and forms k clusters. In the third and final step, it creates new centroids by calculating the mean value of the samples assigned to each previous centroid and calculates the difference between the old and new centroids. It keeps on iterating the process until the algorithm converges. We applied k-means clustering with the k = 2, hence it resulted into two clusters. The midpoint between the two centroids divides the data into different events. We propose to use these midpoints as threshold values for CEP rules as it defines the boundary between different events. In general, threshold values for CEP rules are static and is a major drawback when deployed in real-world dynamic environments. Statistical properties of the underlying data may change over time resulting in inaccurate threshold values. Therefore, we propose to keep track the changing in data distribution by accessing the quality of cluster as new data arrives. And as the quality of clusters deteriorate, k-means model is retrained and new threshold values are found using latest data.
a) Morning Traffic Hours
b) Afternoon Traffic Hours
c) Evening Traffic Hours
d) Night Traffic Hours
Fig. 5. Threshold Values for Weekdays
Silhouette index s(i) [18] is used to access the quality of clusters which is defined as s(i) =
b(i) − a(i) max(a(i), b(i))
(2)
where a(i) is the mean intra cluster distance, and b(i) is the mean nearest-cluster distance i.e. distance with the nearest cluster center which the data is not part of. s(i) ranges from −1 to 1 where 1 indicates the highest score and −1 as the lowest for cluster quality. As new data arrive, silhouette index is calculated using the cluster centroids and if s(i) < 0.5, it acquires the latest data and repeat all the steps. In this way, our algorithm can track the changing in the underlying data. As an example, if the rain effects the traffic system, new data values will fit poorly to the old clusters and the quality of
TABLE I T HRESHOLD VALUES U PDATE ( WEEKDAYS ) Traffic Period Morning Afternoon Evening Night
Time Range 8 am to 12 pm 12 pm to 4 pm 4 pm to 8 pm 8pm to 12 am
Threshold Values 130 veh/h, 43 km/h 175 veh/h, 51km/h 145 veh/h, 49km/h 96veh/h, 48 km/h
Silhouette index 0.51 0.57 0.55 0.50
clusters will decrease. As our algorithm detects it, it will use the latest data to find new threshold values. IV. R ESULTS We have divided the data into four traffic periods depending on the time context as shown in the Table I and Figure 5 shows
V. C ONCLUSION AND F UTURE W ORK In this paper, we have proposed a context-aware method to analyze and extract high-level knowledge from data streams in near real-time for distributed IoT applications. Our propose method is automatic, adaptive and is able to cope with dynamic environments as opposed to current state of the art methods. We have demonstrated the feasibility and usage of our proposed architecture with the help of a real-world use case scenario of ITS. In future, we aim to work on making our method more generic and apply on other use-case scenarios such as smart buildings. ACKNOWLEDGMENTS Fig. 6. Node-Red Instance of Message Bus
the clustering result for individual traffic period. We used the historical data of the recent last month (which is available online 1 ) between the time range mentioned and applied kmeans clustering with k = 2. It results into two clusters as can be seen from the Figure 5. Blue cluster represents high average traffic speed and high traffic intensity indicating smooth traffic flow or good traffic state. Whereas red cluster represents traffic points with low average traffic speed and low traffic intensity which represents bad traffic state. Midpoint between both cluster centers represents the boundary separating both states and we used this boundary to define threshold values for detecting complex Events. Once new threshold values are found, they are published on a MQTT broker in a JSON format where event collector module is listening. As it detects new threshold values, it update the rules using new threshold values. Figure 6 shows an instance of a MQTT broker where different topics for three road segments are defined and as the new threshold value for a certain road segment is calculated, they are published under the specific topic. Once threshold values are calculated, CEP rules can be used to detect a complex Event. Algorithm 1 shows a pseudo code for detecting bad traffic state where a rule is defined to check if three consecutive readings of traffic speed and traffic intensity are less then the threshold values. Algorithm 1 Example Rule for CEP 1: for (speed, intensity) ∈ T upleW indow(3) do 2: if (speed(t) < speedthr and intensity(t) < intensitythr AND 3: speed(t + 1) < speedthr and intensity(t + 1) < intensitythr AND 4: speed(t + 2) < speedthr and intensity(t + 2) < intensitythr ) then 5: Generate complex event Bad Traffic 6: end if 7: end for
1 http://datos.madrid.es/portal/site/egob/
The research leading to these results was supported by the EU FP7 project COSMOS under grant ICT-609043. R EFERENCES [1] F. Mattern and C. Floerkemeier, “From the internet of computers to the internet of things,” in From active data management to event-based systems and more. Springer, 2010, pp. 242–259. [2] D. Evans, “The internet of things: how the next evolution of the internet is changing everything,” CISCO white paper, vol. 1, 2011. [3] A. Buchmann and B. Koldehofe, “Complex event processing,” itInformation Technology Methoden und innovative Anwendungen der Informatik und Informationstechnik, vol. 51, no. 5, pp. 241–242, 2009. [4] D. Luckham, The power of events. Addison-Wesley Reading, 2002, vol. 204. [5] H. Ma, D. Zhao, and P. Yuan, “Opportunities in mobile crowd sensing,” Communications Magazine, IEEE, vol. 52, no. 8, pp. 29–35, 2014. [6] B. Tarnauca, D. Puiu, D. Damian, and V. Comnac, “Traffic condition monitoring using complex event processing,” in System Science and Engineering (ICSSE), 2013 International Conference on. IEEE, 2013, pp. 123–128. [7] Y. Wang and K. Cao, “A proactive complex event processing method for large-scale transportation internet of things,” International Journal of Distributed Sensor Networks, vol. 2014, 2014. [8] S. Nechifor, B. Tarnauca, L. Sasu, D. Puiu, A. Petrescu, J. Teutsch, W. Waterfeld, and F. Moldoveanu, “Autonomic monitoring approach based on cep and ml for logistic of sensitive goods,” in Intelligent Engineering Systems (INES), 2014 18th International Conference on. IEEE, 2014, pp. 67–72. [9] C. Y. Chen, J. H. Fu, T. Sung, P.-F. Wang, E. Jou, and M.-W. Feng, “Complex event processing for the internet of things and its applications,” in Automation Science and Engineering (CASE), 2014 IEEE International Conference on. IEEE, 2014, pp. 1144–1149. [10] ATOS SOL/CEP Engine in FIWARE. [Online]. Available: https: //forge.fiware.org/plugins/mediawiki/wiki/fiware/index.php/Atos SOL [11] Raspberry Pi Board. [Online]. Available: https://www.raspberrypi.org/ [12] Udoo Board. [Online]. Available: http://www.udoo.org/ [13] Dolce Language Specification. [Online]. Available: https://forge.fiware. org/docman/.../Dolce-Language-Spec-Release-v1.pdf [14] G. Cabanes, Y. Bennani, and N. Grozavu, “Unsupervised learning for analyzing the dynamic behavior of online banking fraud,” in Data Mining Workshops (ICDMW), 2013 IEEE 13th International Conference on. IEEE, 2013, pp. 513–520. [15] T. Chaira, “A novel intuitionistic fuzzy c means clustering algorithm and its application to medical images,” Applied Soft Computing, vol. 11, no. 2, pp. 1711–1717, 2011. [16] G. W. Milligan and M. C. Cooper, “A study of standardization of variables in cluster analysis,” Journal of classification, vol. 5, no. 2, pp. 181–204, 1988. [17] T. Kanungo, D. M. Mount, N. S. Netanyahu, C. D. Piatko, R. Silverman, and A. Y. Wu, “An efficient k-means clustering algorithm: Analysis and implementation,” Pattern Analysis and Machine Intelligence, IEEE Transactions on, vol. 24, no. 7, pp. 881–892, 2002. [18] S. Petrovic, “A comparison between the silhouette index and the daviesbouldin index in labelling ids clusters,” in Proceedings of the 11th Nordic Workshop of Secure IT Systems, 2006, pp. 53–64.