Exp Brain Res (1999) 128:123–133
© Springer-Verlag 1999
R E S E A R C H A RT I C L E
M-C. Hepp-Reymond · M. Kirkpatrick-Tanner L. Gabernet · H-X. Qi · B. Weber
Context-dependent force coding in motor and premotor cortical areas
Received: 10 November 1998 / Accepted: 13 March 1999
Abstract In three monkeys trained to finely grade grip force in a visuomotor step-tracking task, the effect of the context on neuronal force correlates was quantitatively assessed. Three trial types, which differed in force range, number, and direction of the force steps, were presented pseudo-randomly and cued with the color of the cursor serving as feedback of the exerted force. Quantitative analyses were made on 85 neurons with similar discharge patterns in the three trial types and significant linear positive (54 cells) or negative (31 cells) correlation coefficients between firing rate and force. An analysis of covariance (ANCOVA) showed that the population slopes for 2-step were steeper than for 3-step trials. Another ANCOVA at the population level, computed on the differences in firing rate and force between force steps, persistently disclosed a significant effect of trial type. For the first two force steps, the differences in firing rate were significantly larger in the 2-step than in the 3-step increase trials. Further analyses revealed that neither the force range nor the number of steps was a unique factor. A small group of neurons was tested in an additional trial series with a uniform cue for all three trials, leading to either a loss of context-dependency or to unexpected changes in firing rate. This demonstrates that the cue color was an important instruction for task performance and neuronal activity. The most important findings are that the context-dependent changes were occurring “online”, and that neurons displaying context-dependency were found in all three lateral premotor cortex hand reM.-C. Hepp-Reymond · M. Kirkpatrick-Tanner · L. Gabernet Brain Research Institute, University Zurich-Irchel, Zurich, Switzerland M.-C. Hepp-Reymond (✉) · M. Kirkpatrick-Tanner · L. Gabernet Institute for Neuroinformatics, University Zurich-Irchel, Winterthurerstr. 190, CH-8057 Zurich, Switzerland, e-mail:
[email protected] H-X. Qi Department of Psychology, Vanderbilt University, USA B. Weber Department of Neurology, University Hospital, Zurich, Switzerland
gions and in the primary motor cortex. Finger muscle activity did not show any context dependency. The context-dependent effect leads to a normalization of the cortical activity. The advantage of normalization is discussed and mechanisms for the gain regulation are proposed. Key words Precision grip · Context-dependency · Force · Finger representation · Motor cortex · Premotor cortex
Introduction Neural correlates of static and dynamic force in the primary motor cortex (M1) have been investigated for more than 30 years (Evarts 1968, 1969; Schmidt et al. 1975; Thach 1978; Cheney and Fetz 1980; Hoffman and Luschei 1980; Evarts et al. 1983; Porter and Lemon 1993; Ashe 1997; for a review, see Hepp-Reymond 1988). Force coding has been demonstrated under various force conditions (isotonic, isometric, and auxotonic) for single-joint movements, such as wrist or elbow, and jaw movements. In the majority of the studies, monotonic relations between neuronal activity and static force were found, being linear over a restricted force range. Departures from linearity often occurred at high and more rarely at low forces. For multijoint movements in 2D space, a relation of firing rate to force has also been shown by Kalaska et al. (1989) under static conditions and by Georgopoulos et al. (1992) for dynamic force. Recently, the latter data have been expanded to the 3D space by Taira et al. (1996), leading to the conclusion that, for a majority of M1 arm neurons, the neuronal activity mainly or preferentially correlates with the direction of force rather than its magnitude. The precision grip has been considered to serve as an appropriate model to investigate neuronal correlates of force in a natural situation, as the modulation of the force exerted between the thumb and index finger is required by every fine manipulation. This force is the resultant of the coordinate activity of many muscles, and
124
its control represents a challenging problem for the central nervous system. Neuronal correlates of dynamic and static isometric grip force have been demonstrated for many years, mainly for neurons in M1, but also for neurons located in the motor thalamus, pallidum, and somatosensory cortex (Smith et al. 1975; Hepp-Reymond et al. 1978; Anner-Baratti et al. 1986; Wannier et al. 1991; Maier et al. 1993). In recent years, neuronal correlates of grip force have also been found in various parts of the lateral premotor (PM) cortex (Hepp-Reymond et al. 1994). For this investigation, a more complex paradigm has been designed in order to reveal special premotor neuronal features. The experimental situation requires the production of two or three consecutive force steps, with the color of the exerted force serving as a cue for the number and direction of required force steps. Under these conditions, the slopes of the regression lines, taken as index of force-sensitivity, were steeper for the 2-step than for the 3-step trials covering a larger force range. To explain this new finding, the simplest hypothesis was that the neuronal activity had non-linearities in the higher force range, showing some kind of saturation. As suggestive as this hypothesis might have been for tonic neurons displaying an increase of activity with force, it could not be applied as well to the numerous neurons with a decrease in firing rate with force. Another likely interpretation is that the neuronal activity may be context-dependent, and that changes in gain may occur depending on the instructions given in the task. These two interpretations have been quantitatively tested, and we report here on the statistical significance of context-dependent neuronal correlates of force in M1 and lateral PM cortex.
Materials and methods Three alert female monkeys (Macaca fascicularis) were the subjects of the present study. The experiments were conducted in accordance with the principles of the Swiss Animal Protection Law on animal experimentation and care of experimental animals. The monkeys were not water deprived, but their dry food diet and weight were controlled. Behavioral paradigm Parts of the behavioral paradigm have been described in HeppReymond et al. (1994). The monkeys sat in a primate chair in front of a computer-controlled video-screen (ca. 40 cm in front of the monkey) with forearms and wrists restrained in adjustable splints and the hands resting on platforms. They were trained to exert and control force isometrically on a transducer held between thumb and index finger, i.e., using the precision grip. The transducer could rotate around its vertical axis to prevent simple proximal push or pull movements. The visuomotor task consisted of a step-tracking paradigm that required the precise production of grip force within a relatively low force range in sequences of two or three variable force steps. Three different trial types were presented in a pseudo-random order during training and recording sessions. One trial type required two increasing force steps (2-step ↑trial), another type required three increasing steps (3-step ↑trial), and the third type had three steps, with a force decrease as the
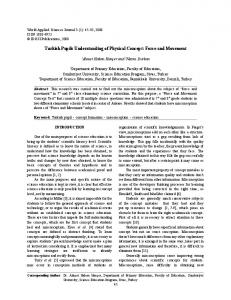
Fig. 1 Visuomotor force step-tracking task. Top Screen with required (target) and actual (exerted) force displayed at four different times during one two-step trial. Bottom Time course of idealized force curves (force scale in Newton, time scale in s). Arrows Occurrence times of the reward for two increasing force steps (2step↑ trial) a, for three increasing force steps (3-step↑ trial) b, and for two increasing and one decreasing force steps (3-step↑↓ trial) c third step (3-step ↑↓trial). The paradigm is schematically represented in Fig. 1. On the video screen, a light-blue rectangle displayed the target force range, and a smaller colored one represented the actual force exerted on the transducer. Each trial type was cued by a different color (“color-cued” condition): magenta for 2step↑, white for the 3-step↑, and blue for the 3-step↑↓ trials. A trial was initiated by the monkey closing its thumb and index finger on the transducer, producing force to reach the displayed target force, and maintaining it for a variable time (1.5–1.8 s). At the end of the hold period, an upward shift of the target instructed the monkey to increase the grip force within 2 s and reach a second force level that had to be maintained for 1–1.3 s. In the 3-step trials, the third shift of the target force window could either be in the upward or downward direction (increase or decrease). Some drops of fruit juice and a small piece of fruit or vegetable rewarded each correct trial. The force range covered by the 2-step↑ and the 3step↑↓ trials lay between 0.25 and 0.85 N, and that of the 3-step↑ trials between 0.2 and 1.15 N. An effort was made to cover the whole force range by five to six trials with different target force ranges. The target force ranges varied slightly between monkeys. In one monkey, some neurons were additionally tested in a trial series in which all three trial types had the same cue color, the one cueing the 3-step↑ trials “uniformly” cued condition). Two pairs of strain gauges (DC 100 Hz, range 0–5 N) measured the one-dimensional force component of thumb and index finger separately, and these two forces were added electronically, yielding a resultant force, which was displayed on the video screen. A frequency-modulated tone proportional to the exerted force served as auditory feedback during training and during some recording sessions. Surgery and recording After completion of the training, a craniotomy was performed and a stainless-steel chamber (22 mm inside diameter) was stereotactically implanted contralaterally to the trained hand and centered slightly rostral to the M1 hand region. The chamber was implanted in two steps using a new technique based on titanium implants without any dental acrylic. Surgery was made under standard aseptic conditions and general anesthesia (30 mg/kg pentobarbital sodium after induction with 12 mg/kg of ketamine chloride). Full postoperative antibiotics and analgesic medication were provided. Extracellular recordings of neuronal activity during the performance of the motor task were made following standard procedures, with the head of the monkeys immobilized mechanically
125 with a small helmet. Varnished tungsten microelectrodes (0.2 to max. 2 Ω impedance measured intracortically at 1 kHz) were inserted through the dura. In almost every recording site, intracortical microstimulation with a DC cathodal current up to 30 µA (60 ms trains, 0.2 ms duration at 300 Hz) was applied through a constant current isolator. The peripheral receptive fields of the recorded neurons were assessed by stimulating the skin with a small probe and brush and by passive movements of muscles and joints. For two monkeys, the EMG activity of some finger and wrist muscles [first dorsal interosseous (1DI), extensor digitorum communis (EDC), flexor digitorum superficialis (FDS), flexor digitorum profundus (FDP), abductor pollicis brevis (AbPB), adductor pollicis (AdP)] were recorded either percutaneously or with surface electrodes in several sessions. At the end of the recording period, the monkeys were given a lethal dose of pentobarbital and perfused through the heart with saline followed by paraformaldehyde (4%) and sucrose in phosphate buffer. The brains were prepared histologically, and the recorded region reconstructed on the basis of small electrolytic lesions.
Data collection, processing, and analysis The action potentials were discriminated using a time-amplitude window discriminator. The output of the discriminator, together with other digital and analog signals, were stored on a digital tape and digitized on-line or off-line on a laboratory computer (LSI 11/73) and a new data acquisition system (MC 68030 with OS9 system). The sampling rate was 1 kHz for the spikes and 100 Hz for the analog channels (force and rectified smoothed EMG signals). The digitized data could be displayed trial-by-trial in a raster and peri-response time histograms all aligned on a selected digital signal. In general, the trials were aligned on the onset of force change from one level to the next (see Hepp-Reymond et al. 1994). To assess the relation between firing rate and force, segments of constant force (300–1000 ms duration) were interactively chosen from the digitized data trial-by-trial in each force step. Only one segment per force step was selected, thus yielding two or three values per trial. Mean firing rate and mean resultant force were calculated within each segment. The significance of the correlation between firing activity and force was tested for each neuron by way of linear regression analysis, and the slope of the regression line taken as the index of force sensitivity (rate-force slope). In addition, general linear models with either a linear term or the combination of a linear and a quadratic term were applied. The corrected mean square error (MSE) was selected as a criterion for the fit quality (MSE = sum of squares/degrees of freedom). To determine whether the correlation between firing rate and force could be influenced by the context (i.e., by the trial type), several statistical approaches were applied. On the single-cell level, the differences in firing frequency for each trial between the first two force steps were taken as the dependent variable, whereas the differences in force served as the covariate (to control for possible force bias) in an analysis of covariance, referred to in the text as ANCOVAsingle. The trial type (2-step↑, 3-step↑, 3-step↑↓ trials) was the treatment and effect of interest. On the population level, both variables, force and frequency, were first z-transformed so that, for each single cell and variable, the mean of the data of the 2- and 3-step trials together was 0 and the standard deviation 1. This so-called z-standardization was carried out to cancel out cell effects for the further analyses. The subsequent statistical analyses focused on differences between the various trial types, taking into consideration only the first two force steps covering the same force range. To make inferences about the effect of trial type, an ANCOVA was conducted to test whether trial type (treatment) had a significant effect on the firing frequency (dependent variable) in relation to force (independent variable). A significant interaction between the independent variable and the treatment would then indicate a difference in population rate-force slopes. This analysis is
referred to in the text as ANCOVAslope. As a complementary statistical analysis, the standardized data, both force and frequency, were reduced to mean differences between the second and first force steps per trial type and per cell. To test the effect of trial type, the mean differences between the first two steps in 3-step trials (either 3-step↑ or 3-step↑↓) were subtracted from the mean differences between the first two steps in 2-step↑ trials. The same was also done between the two types of 3-step trials (3-step↑, 3step↑↓). These differences were then analyzed applying an ANCOVA with the differences in frequency as the dependent variable and the differences in force as covariate, referred to in the text as ANCOVAdiff. A significant intercept indicates a difference in force scaling between the 2- and 3-step trials, irrespective of possible force variations. The same analyses were performed on the standardized EMG activity.
Results Neuronal population and discharge patterns A total of 1322 neurons were recorded in the M1 and lateral PM cortex contralateral to the performing hand. The distribution of the neurons over the various regions was as follows: 427 (32%) in M1, 371 (28%) in PM ventral rostral (PMvr), 231 (18%) in PM ventral caudal (PMvc), 275 (21%) in PM dorsal caudal (PMdc), 18 (1%) in the rostral PMd. Among these neurons, a selection of socalled “finger cells” was made on the basis of the motor reactions to microstimulation and the localization of the receptive fields. Whenever available, both criteria were considered; however, in case of lack of congruence or absence of reactions to microstimulation, the receptive field was the decisive factor. A total of 998 neurons were related to the fingers: 376 (38%) were located in M1, 249 (25%) in PMvr, 144 (14%) in PMvc, 225 (22%) in PMdc, and 4 (1%) in the rostral PMd. Discharge patterns during task performance were first classified as phasic, phasic-tonic, tonic, decreasing, and mixed (Wannier et al. 1991). The cells with either a tonic increase or decrease of firing rate with force were further subdivided into two classes. The neurons displaying similar discharge patterns and force coding in all trial types were called “same”, and the others were grouped under the label “complex” (Hepp-Reymond et al. 1994). From the 362 neurons with a tonic component, 138 (38%) belonged to the class “same” and were the object of the present investigation. The rest with more complex variations will be presented in another publication. Linearity of relation between firing rate and static force Of the 138 analyzed cells related to finger movements and displaying “same” discharge patterns, a significant majority (85, 62%) exhibited a significant linear force modulation when the data of the 2-step↑ and 3-step↑ trials were pooled (χ2=7.4, df=1, P