Continuous response variable trial design in motor neuron disease: long term treatment with a. TRH analogue (RX77368). Ajith Goonetilleke, Roberto J Guiloff.
201
Journal of Neurology, Neurosurgery, and Psychiatry 1995;58:201-208
Continuous response variable trial design in motor neuron disease: long term treatment with a TRH analogue (RX77368) Ajith Goonetilleke, Roberto J Guiloff
Abstract The continuous response variable controlled trial design is developed as a model for the efficient screening of candidate treatments in motor neuron disease. A TRH analogue (RX77368) and placebo were randomly allocated to 15 matched pairs of patients with motor neuron disease. With validated composite interval scores, this trial excluded a 50% or greater improvement with RX77368 at month 12 in scores of respiratory, lower limb, and activities of daily living function with greater than 90% power, and in bulbar function scores with 80% power. For upper limbs, 52% and 75% improvements were excluded at months 9 and 12 respectively with 80% power. Patients who died during the study had faster deterioration rates in bulbar and respiratory scores than their surviving pairs.
The feasibility of screening drugs for significant biological effects with small sample sizes and good statistical power is shown. The difficulties of handling deaths and dropouts when using this design are discussed. Comparisons are made with sample sizes required using other scores and rating scales, as well as with those required in hazard and event rate studies. A simple clinical grading scale for motor neuron disease, with its corresponding composite interval scores, is described. (J Neurol Neurosurg Psychiatry 1995;58:201-208)
Keywords: motor neuron disease; rating scales; therapeutic trials
Many drugs need to be tested in motor disease, with no suitable animal model for preliminary studies. Drugs would be considered of benefit if they improved survival time or mortality, or produced a symptomatic effect for at least six months; the duration of a drug trial may thus represent a large proportion of a patient's remaining survival time. Trials requiring large sample sizes limit the number of drugs that can be tested at any one time, and have a high human and economic cost.' It is thus important to screen candidate treatments with a methodology that ensures reasonable statistical power with relatively small patient numbers, before considering the need for larger controlled trials. Hazard and event rate trial designs with neuron
Neuromuscular Unit, Regional Centre and Academic Unit of Neurosciences, Charing Cross Hospital, London, UK A Goonetilleke R J Guiloff Correspondence
to:
Dr R J Guiloff, Neuromuscular Unit, Charing Cross Hospital, Fulham Palace Road, London W6 8RF, UK. Received 9 June 1994 and in revised form 12 September 1994. Accepted 7 October 1994
survival time or mortality as primary endpoints require many patients and are costly.' Exclusive use of these designs may discard drugs that have significant effects on some functions (for example, limb strength), and yet do not affect survival. Such drugs may improve the quality of life and should still be considered as therapeutic options. The need to test the long term effects of a thyrotrophin releasing hormone (TRH) analogue provided an opportunity to use the continuous response variable trial design,2 with previously described interval measurements of bulbar,3 respiratory,3 muscle strength,4 and activities of daily living function.5 The feasibility of using small numbers of patients with motor neuron disease, with adequate sensitivity and statistical power to detect or exclude clinically significant effects, have not been well documented before. The rationale for the use of TRH and its analogues has been reviewed.6 8 Intravenous, subcutaneous, and intrathecal TRH has not shown benefits.8-" A TRH analogue with a longer half life (RX77368) was shown to have short term effects on bulbar function and spasticity with acute or subacute, intravenous and oral administration, 12-14 and prompted this study. Materials and methods PATIENTS
All patients fulfilled the El Escorial criteria for a definite diagnosis of motor neuron disease.'5 The referring physician knew of the entry criteria, which included being 18-80 years of age, forced vital capacity (FVC) >1.0 1, clinical disease duration of six to 36 months, and finding a suitable matched pair. Fifty six of the 67 patients referred were suitable: 15 matched pairs were selected. Absolute criteria for matching pairs at entry were sex, disease type at onset, similar topographical involvement, and differences in FVC deterioration rates of less than 5% of normal function per month. It was intended to keep pair differences in age to less than 10 years, but three pairs with differences of 14, 15, and 21 years had such similar illness durations (one, three, and four months) and rates of deterioration that they were included. Differences in duration of illness were less than 12 months except for 21 months in one pair; this pair was included because age and deterioration rates were similar. Differences in FVC were less than 30% of normal predicted function except in two pairs with differences of 39% and 56%. These pairs were included
Goonetilleke, Guiloff
202
because of small differences in duration of illness (one and four months) and similar deterioration rates. Eighteen patients had amyotrophic lateral sclerosis (ALS) at clinical onset (16 men, two women; age 27-73), and 12 had progressive bulbar palsy (PBP) (four men, eight women; age 48-67). For the cluster analysis 20 patients with motor neuron disease (10 classic ALS, 1 0 PBP; 11 men, nine women; age 27-67) with complete data for 10 months of assessments were used. Thirty age and sex matched normal controls were used for bulbar (13 men, 17 women; mean age 51 - 1, range 24-76) and activities of daily living tests (15 men, 15 women; mean age 48-5, range 24-77); 60 normal controls were used for dynamometry (32 men, 28 women; mean age 48-0, range 18-77). Control values for FVC were taken from standard tables. The study was approved by the local ethics committee and written informed consent was obtained. APPARATUS
Timed tests were performed with a stopwatch. Standard beakers and straws were used for the swallowing tests. Forced vital capacity was measured by a micro spirometer (Micro Medical Ltd, Rochester, England). For chest circumference a flexible tape
Table 1 Comparison between clinical grades and % normal scores Function Bulbar
Grade 1 2
3a
3b 4
Respiration 1 2 3 4
Upper limb 1 2
3 4
Lower limb 1 2 3 4
Clinicalfunctional status Speech abnormality Moderate or severe Severe or moderate or severe or mild or normal or minimal Minimal to moderate or minimal Minimal or normal Normal
Score (mean (SD))
n
Swallowing abnormality 110 + Moderate or severe 82 + Normal + Minimal or mild + Minimal to severe + Severe 69 + Normal + Minimal 25 + Mild or moderate + Minimal to moderate 85 + Normal
Ventilator some or all the time Dyspnoea on mild exertion or at rest Dyspnoea on moderate exertion Normal One or both arms lost all function (needs help in all activities*) One or both arms lost some function (needs help in some activities* Both arms functional, but some activities* take longer to perform Normal function
Unable to walk Cannot walk the same distance as before or needs a device or helper(s) Abnormal gait, can walk the same distance as before (without device or helper) Normal
4 90
94 104
28-0 (9 9) 42-2 (11 0)
58-4 (17 5)
67-3 (9 9)
1 2 3
MEASUREMENTS
All measurements were performed by a single rater (AG) and were expressed as % normal values. For bulbar and activities of daily living tests, readings from each patient were expressed as % of the mean value for that test of the matched population of 30 controls. For dynamometry, normal values varied with age and sex; patients' readings were thus expressed as percentages of the mean normal values below and above 40 years for men and 50 years for women. Composite scores were then obtained by taking the mean of the % normal measurements for a group of tests. The following were used: bulbar score timed measurements of tongue protrusion, word repetition, jaw movement, and swallowing3; respiratory score-FVC and inspiratory and expiratory chest circumference difference3; Upper limb score shoulder abduction, elbow flexion, finger extension, and index finger abduction on both sides4; Lower limb score hip flexion, knee extension, foot dorsiflexion, and greater hallux extension on both sides4; activities of daily living score timed measurements of unfastening and fastening a button, placing four coins (right then left hand), handwriting, rising from a chair, and walking (forward 25 feet, turning, and walking back 25 feet)5; limb spasticity score-the sum of grades for all four limbs was used; each limb was assessed on a 0-5 grade with the Ashworth scale.'6 Baseline values were obtained after elimination of learning effects. I 17 Bulbar, respiratory, and limb scores were obtained monthly and activities of daily living scores three monthly, for one year.
90-0 (16-2)
17-6 (13-3) 41-6 (15-4) 76-4 (33 4)
96-7 (35 9)
93
1 1 (2 0)
116
26 7 (26 1)
55
58-8 (12-5)
79
72-4 (22 6)
52 194
11 1 (10-5) 42-6 (22 0)
19
70-8 (13 4)
105
95-1 (12-1)
1-8 (2 8) 24 Totally dependent in all activitiest 44 37 1 (23 3) Totally dependent in one or more activitiest 51 74 9 (17-3) One or more activities take longer or occasional help neededt 98-3 (14-6) 19 Normal 4 Data from patients with MND assessed monthly (mean follow up = 13 5 months); n = number of observations; ADL = activities of daily living. Speech abnormalities (slurred or nasal, not dysphonic): minimal = always intelligible, mildthe= occasionally unintelligible (< 50% of the time); moderate = mostly unintelligible (>50% of time); severe = always unintelligible/anarthric. Swallowing abnormalities: minimal = dysphagia with normal diet; mild = avoids some foods; moderate = modified diet (liquidised, pureed, liquid supplements); severe = gastrostomy/nasogastric tube. Mild exertion = routine activities (wash, dress, walk one mile, two flights of stairs). Moderate exertion = more than routine activities; * write, self feed, and dress (buttons and laces); t self feed, dress, wash, toilet, stand, walk.
ADL
measure was used. A hand held dynamometer with a range of 0-30 kgf was used for muscle force assessments (Penny and Giles Instrumentation Ltd, Christchurch, Dorset, England). Standard boards and armchair were used for the activities of daily living tests.
CLINICAL SIGNIFICANCE OF QUANTITATIVE SCORES
The functional status of the 30 patients was independently assessed at each visit with empirically designed clinical scales (six grades) for speech, swallowing, respiratory, upper limb, lower limb, activities of daily living functions. The grades covered all deficits, from complete absence to normal function. These assessments were continued after the trial in 16 patients, resulting in a mean follow up for the 30 patients of 13-5 (range 1-31) months. This dataset was then used to calculate the means and SD of interval scores corresponding to the six grades for each function (except speech and swallowing) for all patients combined. Grades with similar interval scores were then combined to give the grades shown in table 1. For example, the initial respiration grades 2 and 3 (dyspnoea at rest and on minimal exertion) had similar interval scores and were combined as grade 2 in table 1. The potential number of combinations of speech and swallowing deficits was large.
Continuous response variable trial design in motor neuron disease: long term treatment with a TRH analogue (RX77368)
The valid combinations for a bulbar clinical scale were established by a cluster analysis of interval scores for all four bulbar functions measured. Percentage normal values were used as variables in a dataset of 20 patients with motor neuron disease, each assessed on 10 monthly visits. The appropriate number of clusters was investigated by 10 clustering methods, employing standard criteria (cubic clustering criterion, pseudo F, and t2 statistics). A five cluster solution was consistently suggested by these methods. Further, a similar five cluster solution was replicated on a dataset obtained from another group of patients (data not shown). Ward's minimum variance method performs best when a total coverage of data points is required"8 and was chosen for the final solution. The combinations of speech and swallowing clinical grades that best matched this solution (fig 1, table 2)
were then chosen to show the relation between clinical grades and composite bulbar interval scores (table 1). MEDICATION
Members of each pair were randomised to RX77368 and placebo (mannitol), provided by Reckitt and Colman Pharmaceutical Division and Ferring Pharmaceuticals as a white powder within glass vials. The rater and patients were blind to the allocation. The powder was dissolved in water to yield a clear liquid. The first dose (100 mg) was supervised, and then given twice weekly.'4 Monthly increments were made as required up to 3 mg/kg/dose. Compliance was checked by direct questioning and by counting the empty vials returned. DATA ANALYSIS
Table 2 Word repetition and swallowing. Quantitative scores (mean SD) for bulbar functional grades
For statistics the SAS software 6-04 (SAS Institute Inc, Cary, NC, USA) was used. Percentage normal scores were converted to change from baseline values, eliminating baseline variability and reducing the number of
Grade
n
Word repetition
Swallowing
patients needed.2
1 2 3a 3b 4
110 83 68 26 85
22-2(11-1) 39 0 (13-3) 63-5 (17-4) 69-6 (11-4) 92-5 (11-6)
37( 60) 16-7 (22-3) 38-2 (26 5) 19-6 (31-5) 87-3 (26-0)
Grade = fimctional grade (as defined in table 1), n = number of observations. Scores are expressed at % in nornal function.
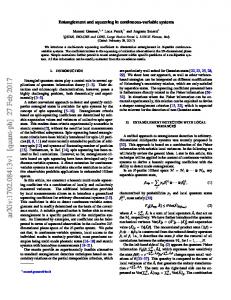
Figure 1 Clinical functional grades and % normal scores of bulbar function. (A) Cluster analysis, showing the five cluster solution found for bulbar tests (see methods). Each observation is plotted by the swallowing and word repetition interval subscores. (B) The clinical grades as shown in tables 1 and 2 are plotted in a similar way; they match well the five cluster solution shown in (A).
203
1601
A
._
0 C
C/)
O- 0/
T4
160 Word repetition
Baseline parameters
Comparisons were by paired t tests or MannWhitney U test (limb spasticity). Data censoring It was predetermined that patients lost to follow up or who had discontinued the medication were censored from the final analysis. Patients who died were assigned a "0% normal" for all scores (see Discussion). Main efficacy analyses These were performed at months 6 and 12. Change from baseline scores showed a multivariate normal distribution. A repeated measures analysis of variance (time x group interaction) was performed on these scores for months 1-6 (month 6 analysis) and months 1-12 (month 12 analysis) for bulbar, respiratory, and limb scores. Similar data for months 3 and 6 (month 6) and months 3, 6, 9, and 12 (month 12) were used for analysis of activities of daily living scores. Changes in limb spasticity scores were compared with the MannWhitney U test.
Survival rate This was compared between groups at month 12 with life table methods and Greenwood estimates of variance for survival probabilities. The total survival experience for treatment groups over one year was compared by the Mantel-Haenszel statistic.
0, C
0
U,
Word repetition
Deaths The mean deterioration rates (change in baseline scores/time) of patients dying during the study were calculated with data from their last visit. The same period from entry to the death of one of the pair was used for the comparison with their living pair; paired t tests were used for such comparisons. Similar comparisons were made for losses to follow up.
204
Goonetilleke, Guiloff
Sample size estimates It had been estimated that a 50% difference in bulbar function between treatment groups could be detected with 80% power or greater using 30 patients, from previous data.'3 The actual difference detectable between intervention and control groups with a two tailed a = 0 05 and power = 80% or 90% was calculated from the formula'9: 6=
ZaCc +
Z,B(Y
/N
where ( = difference detectable; Z, = standard normal deviate at the a significance level; Z1, = standard normal deviate for power of (1-f8); a, = SD of control group readings; a, = SD of intervention group readings; N = total sample size. SIDE EFFECTS
All patients had monthly checks of subjective side effects and of routine biochemistry, haematology, total thyroxine, free tri-iodothyronine, thyroid stimulating hormone (TSH), and prolactin. The rater and patients were blind to the results.
B
A
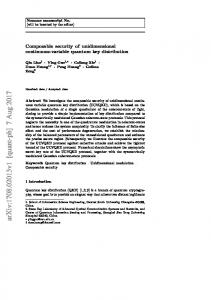
Figure 2 Efficacy analyses. Mean % normal scores and SEM bars for placebo (solid line) and RX77368 (dashed line), expressed as (A) change from baseline and (B) raw scores. The differences between the two treatment groups were not statistically
10 -
100 -
Bulbar
0-
significant.
-60 -
0-
100 -
10 -
Respiratory
0-
C
-
a) -60
A
oa)
.0 n
o
E0
0
CU)
,o
0)
c
sU
10-
Upper limb
0-
-60-
0-
100-
100-
Lower limb
-60-
0-
0
12
Time (months)
6 Time (months)
Continuous response variable trial design in motor neuron disease: long term treatment with a TRH analogue (RX77368)
Results DATA ANALYSIS
Baseline parameters Age, duration of illness, and bulbar, respiratory, upper and lower limb, activities of daily living, and limb spasticity scores were not different between the groups (table 3). Data censoring The four patients censored were all in the drug group. The three losses to follow up at months 2, 3, and 5 died at 167, 200, and 277 days. One patient who discontinued medication (at month 6 due to fatigue and nausea) died 317 days after entry. Patients lost to follow up had similar deterioration rates to
their pairs. Main efficacy analyses Analysis of variance (ANOVA) on change from baseline data at months 6 and 12 showed no differences between groups (p > 0-1) for any score (fig 2).
Table 3 Baseline variables. Means (SD) for placebo and drug groups RX77368
Placebo Age (y) Illness duration (months) Bulbar score Respiratory score Upper limb score Lower limb score ADL score Limb spasticity score
55-1 17-7 60-3 79-7 58-4 67-3 69-8 16-0
(11-1) ( 6-0) (26-6) (40-1) (41-7) (38-8) (38 2) ( 4-1)
53-6 21-9 66-0 72-3 47-0 59 7 66-3 14-8
( 9-9) ( 8-4) (26-8) (29-3) (35-0) (27 2) (33-4) ( 5 3)
Scores are expressed as % normal function, except for limb spasticity (normal tone = 20, smaller scores indicating increasing spasticity). ADL = activities of daily living.
Table 4 Differences detectable between intervention and control groups mean scores with the methods used in this study
Bulbar Respiratory Upper limb Lower limb ADL
3m
6m
9m
12m
3m
6m
9m
12m
15 11 17 9 12
35 23 42 14 25
42
49 30 74 35 33
20 14 20 10 15
42 27 47 16 30
51 33 58 29 32
60 36 86 41 40
28 51 25 27
Differences detectable are expressed as % of control group mean scores at the specified month (p < 0-05, 2 tailed test). ADL = activities of daily living; m = months..
Table 5 Sample size estimates to detect improvements in deterioration rate with the methods used in this study 90% power
80% power
3m Bulbar Respiratory Upper limb Lower limb ADL
71 110 55 25 29
6m
33 35 21 20 17
9m
23 15 15 16 13
12m
21 10 12 14 12
Survival rate There were five deaths in the RX77368 and three in the placebo groups among uncensored patients. Two deaths in the drug group were thought not to be related to motor neuron disease; one was secondary to a severe diarrhoeal illness (postmortem suggested inflammatory bowel disease), and another to a pulmonary embolus. The survival rates (p > 0 1) at 12 months and the overall survival experience (p > 0 25) were not different between groups. Deaths Deterioration rates in the six patients whose deaths were considered to be due to motor neuron disease were worse for bulbar (p < 0 01) and respiratory function (p < 0 05) than those of their surviving pairs (fig 3), but not for upper limb, lower limb, and activities of daily living. Taking the last visit values, the mean bulbar score before death was 32-7 (range 12-5-58-0)% and mean respiratory score 20-3 (range 8A4-36-9)%.
Sample size estimates The methods were sensitive enough to detect 50% or more improvement in all scores at month 6 with greater than 90% power (table 4). They would have detected similar differences at month 12 in respiratory, lower limb, and activities of daily living function with over 90% power, and in bulbar function with over 80% power. For upper limb function 52% and 75% differences would have been detected at months 9 and 12 respectively with 80% power. With the same methods to detect a 50% improvement in the deterioration rate of scores at month 12 (halving the reduction in scores of controls) 21 patients per group would be needed in a trial with 80% power, and 31 per group with 90% power (table 5). SIDE EFFECTS
90% power
80% power
205
3m
6m
9m
12m
121 187 72 32 48
46 49 26 25 24
33 21 19 22 18
31 14 15 19 18
The figures are the numbers required per treatment group at the specified month to detect a 50% improvement in deterioration rate of intervention group compared with that of the control group (p < 0 05, two tailed test). ADL = activities of daily living; m = months.
Twelve patients had nausea in the RX77368 group (mild to moderate = 5, severe = 7), and two on placebo (mild to moderate). Nausea occurred within one hour of taking the drug, with a median duration of four (range 1-24) hours. One patient discontinued the drug after six months due to fatigue and nausea. Other side effects were rhinorrhoea (four), diarrhoea (three), feelings of warmth or shivering (three), and urinary frequency (two). There were no significant biochemical or haematological abnormalities. Nine patients on drug and four on placebo had minor disturbances in thryroid function. Seven on drug and four on placebo had transient minor increases in total thryoxine or free tri-iodothryonine; this necessitated a dosage reduction in both members of one pair, a procedure that maintained the blindness of investigator and patients. Three patients on RX77368 and one on placebo had transient increases in TSH, with maximal recorded values of 24-6 and 5 0 IU/l respectively (normal < 4).
206
Figure 3 Companrson of mean (SEM) % normal bulbar and respiratory scores in patients dying during the study (dashed line) with their surviving pairs (solid line) for bulbar and respirato?y scores. Note the significantly worse deterioration rates in the patients who died.
Goonetilleke, Guiloff 10 H a) ._
Bulbar
Respiratory
10
0
0
aL)
E 0 0 0) C: iv
C-
-60
-60 0
10
Time (months)
Discussion Strategies for motor neuron disease drug trials include times to (hazard rate), or proportions of patients experiencing events (event rate), and the use of qualitative and quantitative measurements of function. In diseases such as motor neuron disease, death is often taken as the event, and survival curves or mortality are studied over a year or more. Data are available to calculate numbers of patients needed for trials with death as a primary outcome variable. There is a need for similar data for other important events that could be used, such as time to respiratory failure, major speech or swallowing involvement, inability to walk, or loss of use of a limb. The continuous response variable design uses interval data, often requiring smaller sample sizes. This design can show biological effects, and may indicate the need to proceed to larger survival and mortality studies. Deaths in motor neuron disease are mostly due to respiratory failure.20 The more rapid deterioration rate in bulbar and respiratory function in the six patients whose deaths were considered as due to motor neuron disease than in their surviving pairs (fig 3) correlates well with clinical experience. The respiratory score used in this study could detect with 90% power a smaller than 40% difference between groups at month 12 (table 4). Thus it seems likely that if a drug has a significant beneficial effect on survival, an improvement in deterioration rate of respiratory scores in the intervention group should be detected. Some trials have used global motor neuron disease scales,21 23 formed by summing tests of different functions. Such global scores may fail to reflect differential effects of drugs on regions involved by the disease (they lack transparency).24 Furthermore, it is difficult, and often arbitrary, to decide on relative weights for the various subscores within a global score. Analyses are therefore increasingly carried out by regions affected (bulbar, respiratory, upper limb, lower limb). Many published scales contain ordinal tests. Disadvantages of using such tests include (a) unequal changes in function across steps of the tests and the scale; (b) steps not always clearly defined; (c) analyses limited to nonparametric statistics, unless the inclusion of many tests results in an interval type scale; (d)
0
10
Time (months)
the sensitivity may be inadequate to detect significant changes in function; and (e) validation is often incomplete. Composite scores combine results of individual tests. They reduce the number of comparisons between groups and the overall variability of readings,3 4 minimising the chances of a type I error and improving study power. If drug efficacy is judged purely on these scores, they should represent important functions affected by the disease and have both statistical (for example, factor analysis) and clinical validity. The last two are lacking in strength scores that combine upper and lower limb muscle groups together. The interval tests and composite interval scores described in this trial have been validated. Learning effects have been minimised' 16 and the accuracy, reproducibility, and variability of the tests have been determined.3 4 Combining tests to form these scores has been confirmed by factor analysis (unpublished data). Each score has a high content validity, with a good representation of functions affected by motor neuron disease. Expressing scores as percentage normal function allows some appreciation of the severity of involvement; their clinical relevance can be further gauged by their relation to the clinical grades (table 1). Change from baseline data eliminates the variability in scores at trial entry and lowers it throughout the study, reducing the sample sizes required. The matched pairs design could reduce further the sample sizes by an analysis of differences between pair members. All three dropouts being in one group, however, made this analysis unsuitable, with only 12 pairs to compare at month 12. The handling of deaths and dropouts in the continuous response variable trial design is an important issue. The number of patients that die in each group may be critical. Also, patients that die often have worse deterioration rates than survivors (fig 3). If such patients are excluded from further analysis after their deaths, then apparently less pronounced deterioration rates, or even spurious stabilisations or improvements in certain functions may be found (fig 4). This can be avoided by giving a 0% value to that function for patients after they die. The handling of dropouts is not so straightforward.25 Both the number of dropouts and
Continuous response variable trial design in motor neuron disease: long term treatment with a TRH analogue (RX77368) Figure 4 Effect of deaths on mean % normal scores. Trial deaths are expressed as 0% of normalffunction (solid line), or are excluded from further analysis (dashed line). Data for all 30 trial patients. Note the spurious improvements of group mean scores after the eight deaths (represented by xs) if they are excluded from further analysis.
10H
10
Bulbar
0
x x
x
x x
207
Respiratory
0 x
x _ _s
x
"I
x
x x
x
x
a) c
a)
Q)
o
.0
-40 -L
0
0) 0)
10
c
Co
C-
l
0
E
_x
-401
12
12
0
10 H
Upper limb
0
Lower limb
0 -I
0
-I
I\lI
0
2x x x
x
-40
I
__
-40
I_
II
12
Time (months)
their deterioration rates can be important. All dropouts in this study were in the RX77368 group, but had similar deterioration rates to the other patients. If not so, it would have been necessary to comment on their effects on the results before reaching any conclusions about drug efficacy. The improvements reported with oral RX77368 for 3X5 weeks'4 were not seen in this study. Possible reasons include first assessment at four weeks with development of drug tolerance or continued disease progression, non-selective patient recruitment, and a smaller proportion of responders in this trial. Poor compliance is less likely. A significant long term biological effect of oral RX77368 at the dosage used has been excluded. This study had over 90% power in excluding a 50% or greater difference in scores between groups at month 12 for respiratory, lower limb, and activities of daily living function, and 80% power for bulbar function. For upper limbs, 52% and 75% differences in scores were excluded at months 9 and 12 respectively with 80% power. There are negative trials in motor neuron disease with similar sample sizes but the methodologies used previously have not been validated or ensured that a type II error (false negative) has been reasonably excluded. The randomised, double blind, placebo controlled trial is the gold standard for trial design. The omission of randomisation and placebo controls in motor neuron disease may be defended for detecting major therapeutic effects,26 such as arrest of the disease or a dramatic reduction in mortality after one or two years. Deterioration rates of composite scores in a trial population compared with those of natural history controls,2728 or with their pretrial deterioration rates,28 have been advocated as alternative designs for efficiently
12
Time (months)
screening drugs in motor neuron disease. Key assumptions for these approaches to be valid include (a) fully validated measurements of respiratory, bulbar, and limb function; (b) learning effects of measurements demonstrably similar between populations or eliminated before trial onset; (c) linearity or predictability of deterioration rates; and (d) lack of a placebo effect. With natural history controls the further assumption that deterioration rates and outcomes in motor neuron disease populations do not change over time is questionable-for example, with new ancillary measures like gastrostomy or assisted ventilation. Further, the trial population should be similar to the historical controls in all measurements, inclusion criteria, referral patterns, and selection bias.26 A running in period of six months may be required to obtain sufficiently precise estimates of pretrial deterioration rates when using patients as their own controls.27 The clinical grades shown in table 1 fulfil criteria for a valid scale. They cover the respective universe of deficits, are mutually exclusive, transparent, have suitable discrimination, and are clinically plausible. The associated interval data (means and SD of percentage normal scores) confirm their status as separate grades. The combinations of speech and swallowing deficits chosen for bulbar grades were determined by a cluster analysis. A tandem profile24 of such functional grades may be used to describe patients (for example B4R4U1L1A1 = a patient with normal bulbar and respiratory function, loss of fumction in one or both arms, unable to walk, and who is totally dependent in activities of daily living). In conclusion, the feasibility of using the continuous response variable trial design in motor neuron disease with small sample sizes and good power to exclude significant
208
Goonetilleke, Guiloff
Table 6 Sample size estimates to detect a 50% improvement in detenroration rate/survival of intervention group at 12 months Measurement
Study
Functlon
Type
Upper limb Timed hand Lower limb Bulbar Respiration
I I I
I
38 58 47 47 57
6 ALS
Spinal score
0
64
Bulbar score
0
148
702 ALS (472 male, 230 female; mean age = 53 5 y; 155 bulbar, 547 spinal)
Elbow flexion Upper limb Hip flexion Lower limb Stand
bulbar/spinal
Walking Tongue Lip
27 68 21 37 45 109 121/106
Jaw Norris Baylor
I I I I I I I I I 0 0
75 ALS
Muscle strength Limb function Bulbar function
0 0 0
28 42 54
30 ALS
Upperlimb Lower limb Bulbar
I I I I I
15
Population
Deterioration rates: Munsat et al 50 ALS (26 male, 24 female 19882! mean (table 1) age = 51 2 y; 10 bulbar, 40 spinal) Plaitakis et al
,i
1988"
(figs 1,3) Brooks et al
1991i' (table 7)
Bensimon et al 1994 12
onset:
(fig 2) This study 1994
(20 male, 10 female;
(table 4) 54-4 y; 12 bulbar, 18 spinal)
Respiration ADI
Hazard Event
Survival
mean age =
Deaths:
Mortality
201/72 47/101 47 33
19 31 14 18
146*
1 08t
0 = = Number needed per group assuming equal sizec groups; measurement type I interval, ordinal; Norris/Baylor = Norris/Baylor ALS scales;, ADL = activities of daily living; *sample size for a hazard rate study, with median survival times for control and intervention groups taken as 16-4 and 38-0 months respectively (corresponding t o exponentially decaying survival curves with one year mortality rates of 40% and 20%), study performed over 18 months including a SiX month recruitment period at the beginning; tsamlple size to detect 50% improvement in one year survival, from a control group rate of 40% (co mbined rate for all patients in this study) to intervention group rate of 20% (p < 0-05, two taile d; power 90%). n =
biological druug effects in relevant functions is demonstratecI. Table 6 compares the sample sizes require(d by our methods with others. Expressing c -linically meaningful composite interval scorres as changes from baseline reduced varin ability of readings and improved study power. Expressing deaths as 0% func"improvements" in n* tion avoidedI spurious spurious "improvements rates. The deterioration methodology ofo usefin the efficient described wc)uld bebe screening of candidate treatments for motor Hazard Lse. disea lse. azar and an event event rate rate trial trla requLire larger patient numbers and forfor drugs showing signifierved could be res erved rugs showig
neuron
designs cant
biologiccal effects.
are grateful tto the Motor Neurone Disease Association (UK), Ferring Phiarmaceuticals, and the Special Trustees of
We
Westminster and:Roehampton Hospitals for financial support, and to Mr J Emanni for statistical advice. 1
RJ, Groonetilleke A. Longitudinal assessments in disease: relevance to clinical trials. In: Clifford Rosse F, ed. ALS---from Charcot to the present and into the fut aure. London: Smith-Gordon Publications,
Guiloff
motor neur(one
1994:73-82 2 Friedman LM1, Furberg CD, DeMets DL. Sample size. In: Fundamentarls of clinical trials. 2nd ed. St Louis: Mosby Year Book I[nc, 1985:83-107. 3 Goonetilleke XA, Guiloff RJ. Accuracy, reproducibility and
variability o:f quantitative assessments of bulbar and respiratory fun.ction in motor neuron disease. .7 Neurol Sci 1 994;123(suippl):64-6.
4 Goonetilleke A, Guiloff RJ. Accuracy, reproducibility, and variability of hand held dynamometry in motor neuron disease. _7 Neurol Neurosurg Psychiatry 1994;57:326-32. 5 Potvin AR, Tourtellotte WW. Instrumented examination of activities of daily living. In: Quantitative examination of neurologicfunctions. Florida: CRC Press, 19851l:167-80. 6 Guiloff RJ. Thyrotropin releasing hormone and motorneurone disease. Rev Neurosci 1987;1:201--19. 7 Guiloff RJ. Use of TRH analogues in motomeuron disease. In: Metcalf G, Jackson IVD, eds. Thlyrotropinreleasing hornone: biomtedlcal siggnificance. Ann N Y Acad Sci 1989;553:399-421. 8 Brooks BR. A summary of the current position of TRH in ALS therapy. In: Metcalf G, Jackson IVD, eds. Thyrotropin-releasing hormone: biomedical significance. Ann N YAcad Sci 1989;553:431-61. 9 Engel WK, Siddique T, Nicoloff JT. Effect on weakness and spasticity in amyotrophic lateral sclerosis of thyrotropin-releasing hormone. Lancet 1983;ii:73-5. 10 Committee on health care issues, American Neurological Association. Current status of thyrotropin-releasing hormone therapy in amyotrophic lateral sclerosis. Ansn Neurol 1987;22:541-3. 11 Munsat TL, Taft J, Jackson IMD, et al. Intrathecal thyrotropin-releasing hormone does not alter the progressive course of ALS: experience with an intrathecal drug delivery system. Neurology 1992;42:1049--53. 12 Guiloff RJ, Eckland DJA, Demain C, et al. Controlled acute trial of a thyrotropin-releasing hormone analogue (RX77368) in motor neurone disease. 3 Neurol Neurosurg Psychiatry 1987,50:1359-70. 13 Modarres-Sadeghi HR, Rogers H, Emami J, Guiloff RJ. Subacute administration of a TRH analogue (RX77368) in motomeuron disease: an open study. 7JNeurolNeurosurgPsychiatiy 1988,51:1146-57. 14 Modarres-Sadeghi H, Guiloff RJ. Comparative efficacy and safety of intravenous and oral administration of a TRH analogue (RX77368) in motor neuron disease. . Neurol Neurosurg Psychiatry 1990;53:944-7. 15 World Federation of Neurology Research Group on Neuromuscular Diseases. El Escorial World Federation of Neurology criteria for the diagnosis of amyotrophic lateral sclerosis. _7 Neirol Sci 1994,124: 96-107. 16 Ashworth B. Preliminary trial of carisoprodol in multiple sclerosis. Practitioner 1964,192:540 -2. 17 Guiloff RJ, Modarres-Sadeghi H, Rogers H. Motor neuron disease: aims and assessment methods in trial design. In: Rose FC, ed. Amyotrophic lateral sclerosis. New York: Demos Publications, 1990:19-31. 18 Aldenderfer MS, Blashfield RK. A review of clustering methods. In: Cluster analysis. California: Sage Publications, 1984:60. 19 Lachin JM. Introduction to sample size determination and power analysis for clinical trials. Controlled Clint Trials
20 20
1981;2:93-1 13. sclerosis. Acta Neurol Scand 1967;43:489--98.
Boman K, Meurman T. Prognosis of amyotrophic lateral
21 Norris FH, Calanchini PR, Fallat RJ, Panchari S, Jewett B. The administration of guanidine in amyotrophic lateral
sclerosis. Neurology 1974;24:721-8. 22 Appel V, Stewart SS, Smith G, Appel SH. A and rating scale lateral sclerosis: for amyotrophic description prelim-
inary experience. Ann Neurol 1987;22:328- 33. 23 Hillel AD, Miller RM, Yorkston K, McDonald E, Norris
FH, Konikow N. Amyotrophic lateral sclerosis severity scale. Neuroepidemiology 1989;8:142--50.
24 Feinstein1987. AR. Clinimetn'cs. New Haven: Yale University 25 Heyting A, Tolboom JTBM, Essers JGA. Statistical
~Press,
handling of drop-outs in Med 1992,11:2043-61.
longitudinal clinical trials.
Stat
26 Pocock SJ. The justification for randomized controlled
trials.Wiley In: Clinical -a practical trials--1983:50 John and Sons, -65. approach. New York: 27 Pradas J, Finison L, Andres PL, Thornell B, Hollander D, Munsat TI. The natural history of amyotrophic lateral sclerosis and the use of natural history controls in therapeutic trials. Neurology 1993;43:751-5. 28 Ringel SP, Murphy JR, Alderson MD, et al. T he natural history of amyotrophic lateral sclerosis. Neurology 1993; 43:1316--22. 29 Munsat TL, Andres PL, Finison L, et al. Trhe natural history of motomeuron loss in amyotrophic lateral sclerosis. Neurology 1988;38:409-13.
30 Plaitakis A, Smith J, Mandeli J, Yahr MD. Pilot trial of branched-chain aminoacids in amyotrophic lateral sclerosis. Lancet 1988;i: 1015-8. 31 Brooks BR, Sufit RL, DePaul R, et al. Design of clinical therapeutic trials in amyotrophic lateral sclerosis. In: Rowland LP, ed. Adv Neurol Amiyotrophic lateral sclerosis and other motor neuron diseases. New York: Raven Press,
1991;56:521-46.
G, Lacomblez L, Meininger V, et al. A controlled trial of riluzole in amyotrophic lateral sclerosis.
32 Bensimon
NEngl.7Med 1994;330:585-91.