Continuous-Time Flow-Limited Modeling by Convolution Area Property and Differentiation Product Rule in 4-Phase Liver Dynamic Contrast-Enhanced CT Sang Ho Lee1, Yasuji Ryu1, Koichi Hayano2, and Hiroyuki Yoshida1 1 3D Imaging Research, Department of Radiology, Massachusetts General Hospital and Harvard Medical School, 25 New Chardon St., Suite 400C, Boston, Massachusetts 02114, USA {lee.sangho,yoshida.hiro}@mgh.harvard.edu,
[email protected] 2 Division of Abdominal Imaging and Intervention, Department of Radiology, Massachusetts General Hospital, 55 Fruit St., Boston, Massachusetts 02114, USA
[email protected]
Abstract. Parametric-fitting approaches for tracer kinetic modeling depend on the capability of a computational method to describe underlying physiologic processes that cause temporal intensity changes in dynamic contrast-enhanced (DCE) images. Rapid scan techniques allow perfusion CT imaging with high temporal resolution. In clinical practice, however, the perfusion CT protocol is especially a trade-off between the number of data points and the total radiation dose. Considering availability and radiation exposure, use of DCE-CT imaging derived from 4 temporal phases, which include precontrast, arterial, portal, and delayed phases, is highly desirable for the liver. However, low-temporalresolution images like 4-phase liver DCE-CT present several barriers to modeling of tracer kinetics because of the lack of temporal enhancement data, which limits obtaining reliable physiologic information. The major reason for the limited application of a tracer kinetic model in temporally sparse dynamic data is that general computational algorithms such as deconvolution techniques require discretizing of arterial (or portal-vein) and tissue curves for estimation of kinetic parameters, leading to an unstable computational solution. The numerical instability due to the discretization of the enhancement curves can be more pronounced in the low-temporal-resolution data like those gleaned from 4-phase DCE-CT. For this reason, we propose a novel dual-input continuoustime tracer kinetic modeling method based on a new mathematical approach that uses the convolution area property and the differentiation product rule, without any discretization of the enhancement curves. This model was applied to case studies of hepatocellular carcinoma in 4-phase DCE-CT to illustrate the potential effectiveness of continuous-time tracer kinetic modeling. The proposed analytic scheme was shown to be feasible for estimation of kinetic parameters even in 4-phase liver DCE-CT, potentially being a practical guide for tracer kinetic model-based curve-fitting in temporally sparse data. Keywords: Continuous-time tracer kinetic modeling, convolution area property, differentiation product rule, four-phase dynamic contrast-enhanced CT. H. Yoshida et al. (Eds.): Abdominal Imaging 2013, LNCS 8198, pp. 259–269, 2013. © Springer-Verlag Berlin Heidelberg 2013
260
1
S.H. Lee et al.
Introduction
Dynamic contrast-enhanced CT (DCE-CT) is a noninvasive in-vivo technique that provides valuable information about tissue and tumor microvascular function [1]. The technique measures the vascular support of tumors through analysis of temporal changes during sequential imaging, involving the intravenous injection of an iodinated contrast agent (CA). The temporal changes in CT attenuation can be analyzed by fitting of a tracer kinetic model to the sampled tracer enhancement curves to yield quantitative estimates of kinetic parameters associated with the tissue microcirculation [2,3]. This approach depends on the capability of a computational method to describe underlying physiologic processes that cause temporal intensity changes in DCE images [4,5]. Recent technologic advances and rapid scan techniques have improved the applicability of perfusion CT (PCT) imaging with high temporal resolution. Wholeliver PCT imaging has the potential to provide both high-temporal-resolution and high-spatial-resolution imaging of the entire liver for the detection of hepatic tumors. In clinical practice, however, the PCT protocol is a trade-off between the amount of data points collected and the total radiation dose [6,7], and the PCT evaluation, as such, is usually limited to selected portions of the liver [8]. Therefore, the clinical implementation of whole-liver PCT imaging requires the exploration of methods for reducing the radiation exposure [8]. The desire for increased spatial coverage and reduced radiation dose has resulted in various PCT protocols [9]. Considering the availability of CT scans and the radiation exposure, use of DCE-CT imaging derived from 4 temporal phases, which include pre-contrast, arterial, portal, and delayed phases, is a clinically favored option for whole-liver imaging [10,11]. However, the low-temporal-resolution images present several barriers to modeling of tracer kinetics because of the lack of temporal enhancement data, which limits obtaining reliable physiologic information. Three major issues hamper the establishment of a model-generated solution for tracer kinetics in 4-phase liver DCE-CT: 1) absence of temporal enhancement information during the first pass (early arterial phase), 2) invisibility of time lag to account for the difference in bolus arrival times between the hepatic artery (or portal vein) and liver tissue, and 3) numerical instability of deconvolution operation because it frequently yields non-physiologic oscillations (aliasing or noise) in the computation of the solution for the tissue residue function [4]. The major reason for these difficulties is that conventional computational algorithms such as deconvolution techniques require discretizing arterial (or portal vein) and tissue curves for estimation of kinetic parameters, leading to a computationally unstable solution. This numerical instability due to the discretization of the enhancement curves can be more pronounced in the low-temporal-resolution data in DCE-CT. To solve this problem, we propose a novel dual-input continuoustime tracer kinetic modeling method, which is derived under a flow-limited condition, based on a new mathematical approach that uses the convolution area property and the differentiation product rule, without any discretization of the enhancement curves. Our purpose in this study was to illustrate the potential effectiveness of the proposed analytic method through case studies of hepatocellular carcinoma (HCC) in 4-phase liver DCE-CT.
Continuous-Time Flow-Limited Modeling by Convolution Area Property
2
Methods
2.1
Flow-Limited Tissue Compartment Model
261
We consider the CA blood concentration-time curves in the hepatic artery and portal and PV (in g/ml), and two sources of total hepatic plasma flow vein (PV), A (in ml/min), i.e.: arterial and portal plasma flows, A and PV , respectively. In the flow-limited condition of the two compartment exchange (2CX) model [3], the administered CA between the plasma and interstitial compartment is fast when compared to the plasma flow so that the distribution space of the CA in the tissue can be approximated by a single tissue compartment with the relative distribution volume D , i.e.: D P I [3], where P and I are the volume fractions of the plasma and interstitial space within the tissue volume. Thus, the mass balance equation in the flow-limited condition of the 2CX model can be described as the follows: D
D
T
D D
1
LV
T
,
(1)
/ D is the concentration within the tissue distribution space, D D T is the distribution volume, and LV is the hematocrit of blood in the large 1 vessels ( 0.45) [3]. is the net input blood A PV is the arterial flow fraction. The analytic solution for concentration, where A/ becomes T where
D
T
T
T
T
1
D T
LV
T
1
LV
,
(2)
D T is the tissue’s impulse where / T is the total hepatic perfusion, T residue response function, and denotes the convolution operator.
2.2
Arterial Input Function Model
We modeled a full arterial input function (AIF), A , including the first-pass (early arterial phase) and recirculating inputs to describe invisible temporal enhancements in the intervals of 4-phase DCE-CT data. The A was decomposed into a bolus model denoted as B and a body transfer function (BTF) denoted as G [12]. These two elements may take any form, but restricting them to suitable mathematical functions guarantees that the calculations can be implemented analytically. Even with these constraints, a realistic full AIF model can be defined that contains a first-pass peak, a recirculation peak, and the later temporal phases. The A can be a superposition of the bolus shape and its shape after modification by the BTF. By considering the time lag of the bolus arrival to the artery, L ,A , 0 A
B
L
,A
B
L
,A
L
,A
L
,A .
(3)
262
S.H. Lee et al.
Note that the recirculating input delay was assumed to be negligible for simplicity. B for the bolus model, and G for the BTF. We used B B G Performing the forward and inverse Laplace transforms of the equation (3) leads to A
0 B
L
B
,A
B G/
L
,A
G
and
B G/
with
B
2.3
Portal Venous Input Function Model
B
B
G
B
G
G
L
,A
B
G
L
,A
L
,A ,
(4)
.
Generally, in the systemic circulation of CA, it has been known that the PV enhancement results from output via both the spleen and the intestine from the abdominal aorta [13]. However, any tracer kinetic model that considers the spleen and intestine compartments causes difficulty in fitting 4-phase DCE-CT data due to the higher number of kinetic parameters contained in the model than the actual number of available temporal data. In this situation, using the simplest possible model that fits the data is desirable, ensuring that the fit is reliable. Thus, we modulated a PV input function (PVIF) by using the Tofts-Kety (TK) model [14]. Because the contrast present in the PV comes from the abdominal aorta, the PVIF was modeled considering the AIF as a single input for the PV enhancement, i.e.: 0 PV
T PV
PV
A
L
,PV
L
,A
L
,PV
L
,A
L
,PV ,
(5)
where L ,PV denotes the time lag of the bolus arrival from the hepatic artery to the T is related to the blood flow between the artery and PV. In parallel, PV. The PV the higher the concentration in the PV, the more this contrast will tend to diffuse into the interstitial space and to the other blood plasma. The PV is then connected to the speed that characterizes this diffusion process. From equation (5), we derived the solution of the continuous-time TK model by using the convolution area property and the differentiation product rule so as not to discretize the arterial and PV enhancement curves. The area under the convolution is the product of areas under the factors, i.e.: for L ,A L ,PV , L
PV
T PV
,PV
PV
A L
,
(6)
,A
PV as the PV residue function. For calculating where we defined PV , this equation requires differentiation with use of the product rule, which is a PV formal rule for differentiating problems where one function is multiplied by another, i.e.: for L ,A L ,PV ,
Continuous-Time Flow-Limited Modeling by Convolution Area Property
L
T PV
PV
A
L
,PV
PV
where
B
A
B
L B
1 A
B ,A
L
1
,PV
1
PV
PV
PV
B
L
,PV
PV
A L
T PV
,A
B
263
A
L
(7)
,A
L
,PV
, G L
,A
G
,A
G
G
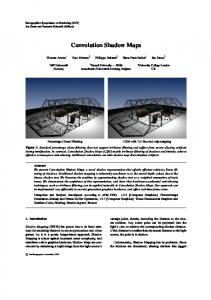
. The resultant fitting AIF and PVIF curves are shown in Fig. 1. The
fitting AIF curve demonstrates a full-pass enhancement including the first-pass and recirculation inputs, and the fitting PVIF curve reveals a relatively more complex and L ,PV . pattern modified by the PV 2.4
Liver Parameter Calculation
An approximate measure of the contrast that enters the liver by the hepatic artery and PV enables modeling of liver kinetic parameters. Like the PVIF model, we applied the simplest possible model in the flow-limited condition of the 2CX model for calculation of liver kinetic parameters. However, there still remains a challenging task in terms of data-fitting and parameter precision. Considering a bolus of CA injected into the liver tissue, we can define the CA concentration in the tissue, T , in terms of two functions. The first is the tissue residue Fig. 1. Example of fitting the AIF and PVIF by the proposed models in the 4-phase function, T , which represents a DCE-CT fraction of the CA that is still present in the region of interest (ROI) at time following an ideal instantaneous bolus injection. The second is the input blood function . The observed tissue curve represents a combination of the effects of the input function and the inherent tissue properties, which can be represented as the total hepatic perfusion, multiplied by the input T
function with T , as shown in the equation (2). Generally, to fit the model, the effect of the input function on the tissue curve is removed by use of a mathematical process known as deconvolution for derivation of T . However, deconvolution is an unstable computational solution [15], and this numerical instability can be intensified when deconvolution is applied to low-temporal-resolution data like those gleaned from 4-phase liver DCE-CT [6]. The main reason is that the first step in the development of the deconvolution algorithm is to discretize T and , i.e.:
264
S.H. Lee et al.
T
LV
∑
T
. Thus, the more temporally sparse
T
the dynamic information is, the greater the error would be. To solve this problem, we derived a novel dual-input continuous-time tracer kinetic model that describes the time lag of the bolus arrival from the input blood to the liver tissue ( L ,T ) by applying the convolution area property and the differentiation product rule like the PVIF model between T and . The L ,T can be imposed on in calculation of
, i.e.:
T
T
T
contribution to T , denoted as T,A as T,PV , respectively, so that A T
A
T
,T
and
LV A
PV
to
L L
,PV
L
LV
and
T,A
, and the PV contribution to T , denoted , where T,A T,A T,PV
T
T
T
,T ,
L
L
PV LV
T
T PV
T
,T
A
T
T
T
(8)
1 L
PV
T,PV
PV
,T
i.e.: L
A
T,A
. We decoupled the arterial
. Likewise, the convolution area property can be applied
with
T,PV
,T
LV
PV
T,PV ,T
L
T
T PV
LV
,A
T
L
,PV
L
PV
(9)
,T
A
1 L
.
LV
,A
are defined only for T,PV L ,A L ,T and 0 . By , respectively. Otherwise, T,A T,PV and applying the differentiation product rule to defining T,PV T PV the equations (8) and (9), T,A and T,PV become Note that L
,A
L
and
T,A
,PV
L
,T
L
T,A
1
A
A
1
T
LV
L
D
1
,T
T
LV
T
A
T
1 L
A
,T
L
,T
T
T
,A
A
LV
L
,T
(10)
Continuous-Time Flow-Limited Modeling by Convolution Area Property
A
PV
T,PV
L
,PV
1
T
L
,T
T,PV
LV L
,PV
L
,T
A
T,PV
1 L
T PV
1 1
D
1
LV T,PV
T,PV
D
T
/ T
PV
A
T
L
LV
,A
A
PV T
where
1
PV
265
,PV
PV
L T
PV
L ,T
,PV
(11)
L
,T
,
. Consequently, a more stable
estimation of the kinetic parameters is made possible even with low-temporalresolution data because the solution allows estimating a continuously differentiable quantity. An example of the resultant fitting curves in HCC and normal tissue is shown in Fig. 2. 2.5
Image Preprocessing
Considering that CT images may suffer from low contrast-to-noise ratios as a consequence of the limitation of the radiation exposure, DCE-CT images were denoised by use of multiple observations Gaussian process regression with a 3 3 pixel kernel based on spatiotemporal information [16]. Next, to reduce movement-induced artifacts, we aligned the precontrast, arterial, and delayed-phase images (moving images) with the portal-phase image (fixed image). First, two images between the moving and fixed ones Fig. 2. Example of fitting HCC and normal were registered by use of a 3D rigid tissue enhancement curves by the proposed transform, which, in turn, was used for liver tissue kinetic model in the 4-phase DCE-CT initializing a registration with a 3D affine transform. The transform resulting from the affine registration was used as the bulk transform for a subsequent 3D deformable warping. Then, the symmetric force Demons deformable registration was performed by use of a multiresolution scheme [17]. Spatial filtering with a 5 5 median kernel was additionally applied to each dynamic series to compensate for a potential misalignment in pixel-wise correspondence between moving and fixed images, when we performed curve-fitting of the 4-phase DCE-CT data.
266
3
S.H. Lee et al.
Results
We investigated 8 patient HCC cases to illustrate the clinical applicability of the proposed continuous-time tracer t kinetic model in 4-phase liver DCE-CT. The patieents were scanned with a 64-row w multidetector CT scanner (LightSpeed VCT or Discovvery CT750 HD; GE Medical Systems, S Milwaukee, WI). A total of 1.7 ml/kg (80 to 135 ml) of nonionic iodinated CA C (Iomeron; Eisai, Tokyo, 350 mg/ml) was injected w with 30 s injection duration at the t rate of 3-5 ml/s and a volume as per 550-600 mgII/kg weight. The arterial-phase timing was determined with bolus tracking technoloogy (Smart Prep; GE Healthcare), and the scan was initiated 17 s after the preseleccted threshold of 200 HU was atttained, with a ROI placed in the aorta above the celiac aaxis branching, where the time lag l of the bolus arrival to the aorta ( L ,A ) was determined by observation of a snapshot to show the onset time of temporal enhancement in the aorta. The portal venous ph hase was initiated 70 s, and the delayed phase 150 s aafter the preselected threshold off 200 HU was attained. The following CT parameters w were used for obtaining volum me data: 120 kVp, Auto mA, 16 0.625 mm detecctor collimation, 2.5 mm slice thickness, t and a pitch of 1. A typical HCC case is presented p in Fig. 3, revealing that th he kinetic parameter maps can be described d adequately with the proposed model. The model paarameters determined from ROI analy ysis in the HCC and normal tissue are summarized in Table 1. The T ROIs were drawn manually over o the primary HCCs and their adjacent normal tissues for each patiient by an experienced radiologist. The T ROI analysis indicated a tend dency of considerably higher valuess for the total hepatic perfusion ( / T ), Fig. 3. Example of kinetic parameter maps by tthe The arterial perfusion ( A / T ), and proposed model in the 4-phase DCE-CT. T arterial flow fraction ( ) in the HCC arrow indicates a HCC in the liver. than in the normal tissue, whereas the portal perfusion ( PV / T ), relative distribution volume ( D ) and time lag of boolus arrival from the input bloo od to the liver tissue ( L ,T ) did not show any obviious differences between the HCC and normal tissue. The increase in the arteerial contribution to the HCC peerfusion led to the increase in the arterial flow fractionn in the HCC. This increased arterial a perfusion coincides with the findings reportedd in previous studies of HCC with DCE-CT [18,19]. Also, despite the increase in the arterial flow fraction in HCC, H there was still a tendency of slightly higher poortal perfusion in the HCC than in normal tissue. This observation is in harmony with the finding that portal perfusion n has been shown to decrease progressively with increassing
Continuous-Time Flow-Limited Modeling by Convolution Area Property
267
dedifferentiation of regenerating, dysplastic, and HCC nodules [20]. The normal tissue showed a tendency for slightly higher portal perfusion than the arterial perfusion, and thereby a lower arterial flow fraction than did the HCC, which is reasonable in the sense that about 75% of the incoming blood comes from the PV and the rest, 25%, results from the hepatic artery under normal conditions [21]. Table 1. Statistics (mean SD) from ROI analysis of each kinetic parameter in the HCC and normal tissue of each study case Patient no. HCC Normal HCC 2 Normal HCC 3 Normal HCC 4 Normal HCC 5 Normal HCC 6 Normal HCC 7 Normal HCC 8 Normal HCC Normal 1
4
/ T (ml/min/ml) 0.24 0.26 0.11 0.04 2.94 2.53 0.31 0.16 0.52 0.87 0.22 0.04 0.7 0.32 0.3 0.64 0.52 0.71 0.36 0.15 0.96 1.46 0.31 0.2 2.52 3.06 0.27 0.06 1.54 2.48 0.64 0.38 1.24 1 0.31 0.15
A/ T (ml/min/ml) 0.23 0.17 0.09 0.04 2.58 2.43 0.17 0.11 0.25 0.18 0.03 0.01 0.45 0.2 0.06 0.03 0.38 0.51 0.08 0.07 0.73 1.39 0.09 0.1 2.48 3.08 0.17 0.06 0.91 1.81 0.3 0.42 1 0.97 0.12 0.09
PV / T (ml/min/ml) 0.02 0.1 0.02 0.04 0.36 0.4 0.14 0.12 0.27 0.69 0.19 0.04 0.25 0.26 0.24 0.08 0.14 0.27 0.28 0.12 0.23 0.34 0.22 0.14 0.04 0.07 0.1 0.05 0.63 1.43 0.33 0.2 0.24 0.19 0.19 0.1
0.98 0.09 0.85 0.25 0.86 0.16 0.57 0.27 0.56 0.15 0.14 0.06 0.67 0.26 0.2 0.12 0.79 0.24 0.22 0.14 0.64 0.29 0.3 0.22 0.94 0.09 0.65 0.17 0.55 0.31 0.41 0.3 0.75 0.17 0.42 0.25
0.25 0.41 0.29 0.27 0.35 0.34 0.64 0.36 0.21 0.26 0.23 0.26 0.31 0.25 0.24 0.29 0.32 0.3
D
L
,T
0.03 0.21 0.03 0.02 0.09 0.04 0.23 0.03 0.04 0.05 0.06 0.02 0.03 0.02 0.04 0.02 0.14 0.06
0.17 0.16 0.19 0.13 0.13 0.14 0.14 0.11 0.07 0.16 0.14 0.09 0.11 0.14 0.16 0.35 0.14 0.16
(min) 0.1 0.15 0.13 0.12 0.09 0.07 0.14 0.09 0.15 0.13 0.15 0.08 0.08 0.05 0.15 0.08 0.04 0.08
Conclusion
We developed a novel computational solution for continuous-time modeling of tracer kinetics by using the convolution area property and the differentiation product rule without any discretization of the enhancement curves, thus enabling a more reliable estimation of the time lag between input and response enhancements as well as other kinetic parameters. The preliminary results of this study suggested that the proposed analytic scheme is feasible for estimation of kinetic parameters even in 4-phase liver DCE-CT, potentially being a practical guide for a tracer kinetic model-based curvefitting, especially when data are temporally sparse.
268
S.H. Lee et al.
References 1. Lee, T.Y., Purdie, T.G., Stewart, E.: CT imaging of angiogenesis. Q. J. Nucl. Med. 47(3), 171–187 (2003) 2. Lee, S.H., Cai, W., Yoshida, H.: Tracer kinetic modeling by morales-smith hypothesis in hepatic perfusion CT. In: Yoshida, H., Hawkes, D., Vannier, M.W. (eds.) Abdominal Imaging 2012. LNCS, vol. 7601, pp. 292–302. Springer, Heidelberg (2012) 3. Brix, G., Griebel, J., Kiessling, F., Wenz, F.: Tracer kinetic modelling of tumour angiogenesis based on dynamic contrast-enhanced CT and MRI measurements. Eur. J. Nucl. Med. Mol. Imaging 37(suppl. 1), S30–S51 (2010) 4. Konstas, A.A., Goldmakher, G.V., Lee, T.Y., Lev, M.H.: Theoretic basis and technical implementations of CT perfusion in acute ischemic stroke, part 1: Theoretic basis. AJNR Am. J. Neuroradiol. 30(4), 662–668 (2009) 5. Koh, T.S., Cheong, D.L., Hou, Z.: Issues of discontinuity in the impulse residue function for deconvolution analysis of dynamic contrast-enhanced MRI data. Magn. Reson. Med. 66(3), 886–892 (2011) 6. Lee, S.H., Kim, J.H., Kim, K.G., Park, S.J., Im, J.G.: Application of time sampling in brain CT perfusion imaging for dose reduction. In: Proc. SPIE Medical Imaging 2007: Physics of Medical Imaging, vol. 6510, pp. 65102P-1–65102P-10 (2007) 7. Bisdas, S., Foo, C.Z., Thng, C.H., Vogl, T.J., Koh, T.S.: Optimization of perfusion CT protocol for imaging of extracranial head and neck tumors. J. Digit. Imaging 22(5), 437– 448 (2009) 8. Pandharipande, P.V., Krinsky, G.A., Rusinek, H., Lee, V.S.: Perfusion imaging of the liver: Current challenges and future goals. Radiology 234(3), 661–673 (2005) 9. Kambadakone, A.R., Sharma, A., Catalano, O.A., Hahn, P.F., Sahani, D.V.: Protocol modifications for CT perfusion (CTp) examinations of abdomen-pelvic tumors: Impact on radiation dose and data processing time. Eur. Radiol. 21(6), 1293–1300 (2011) 10. Catalano, O., Cusati, B., Sandomenico, F., Nunziata, A., Lobianco, R., Siani, A.: Multiplephase spiral computerized tomography of small hepatocellular carcinoma: Technique optimization and diagnostic yield. Radiol. Med. 98(1-2), 53–64 (1999) 11. Kim, S.K., Lim, J.H., Lee, W.J., Kim, S.H., Choi, D., Lee, S.J., Lim, H.K., Kim, H.: Detection of hepatocellular carcinoma: Comparison of dynamic three-phase computed tomography images and four-phase computed tomography images using multidetector row helical computed tomography. J. Comput. Assist. Tomogr. 26(5), 691–698 (2002) 12. Orton, M.R., d’Arcy, J.A., Walker-Samuel, S., Hawkes, D.J., Atkinson, D., Collins, D.J., Leach, M.O.: Computationally efficient vascular input function models for quantitative kinetic modelling using DCE-MRI. Phys. Med. Biol. 53(5), 1225–1239 (2008) 13. Bae, K., Heiken, J., Brink, J.: Aortic and hepatic contrast medium enhancement at CT. I. Prediction with a computer model. Radiology 207, 647–655 (1998) 14. Tofts, P.S., Brix, G., Buckley, D.L., Evelhoch, J.L., Henderson, E., Knopp, M.V., Larsson, H.B., Lee, T.Y., Mayr, N.A., Parker, G.J., Port, R.E., Taylor, J., Weisskoff, R.M.: Estimating kinetic parameters from dynamic contrast-enhanced T(1)-weighted MRI of a diffusable tracer: Standardized quantities and symbols. J. Magn. Reson Imaging 10(3), 223–232 (1999) 15. Riad, S.M.: The deconvolution problem: An overview. Proc. IEEE 74(1), 82–85 (1986) 16. Zhu, F., Carpenter, T., Rodriguez Gonzalez, D., Atkinson, M., Wardlaw, J.: Computed tomography perfusion imaging denoising using gaussian process regression. Phys. Med. Biol. 57(12), N183–N198 (2012)
Continuous-Time Flow-Limited Modeling by Convolution Area Property
269
17. Ibanez, L., Schroeder, W., Ng, L., Cates, J.: The ITK software guide. Kitware, Inc., Clifton Park (2005) 18. Miles, K.A., Hayball, M.P., Dixon, A.K.: Functional images of hepatic perfusion obtained with dynamic CT. Radiology 188(2), 405–411 (1993) 19. Tsushima, Y., Funabasama, S., Aoki, J., Sanada, S., Endo, K.: Quantitative perfusion map of malignant liver tumors, created from dynamic computed tomography data. Acad. Radiol. 11(2), 215–223 (2004) 20. Matsui, O., Kadoya, M., Kameyama, T., Yoshikawa, J., Takashima, T., Nakanuma, Y., Unoura, M., Kobayashi, K., Izumi, R., Ida, M.: Benign and malignant nodules in cirrhotic livers: Distinction based on blood supply. Radiology 178(2), 493–497 (1991) 21. Chiandussi, L., Greco, F., Sardi, G., Vaccarino, A., Ferraris, C.M., Curti, B.: Estimation of hepatic arterial and portal venous blood flow by direct catheterization of the vena porta through the umbilical cord in man. Preliminary results. Acta Hepatosplenol. 15(3), 166– 171 (1968)