and Fourier transform to second order tensor fields. Convo- lution of two tensor fields is defined using matrix multipli- cation. Convolution of a tensor field with a ...
CONVOLUTION AND FOURIER TRANSFORM OF SECOND ORDER TENSOR FIELDS Mario Hlawitschka and Julia Ebling and Gerik Scheuermann Institute for Computer Sciences University of Leipzig Leipzig, Germany email: {hlawitschka|ebling|scheuermann}@informatik.uni-leipzig.de ABSTRACT The goal of this paper is to transfer convolution, correlation and Fourier transform to second order tensor fields. Convolution of two tensor fields is defined using matrix multiplication. Convolution of a tensor field with a scalar mask can thus be described by multiplying the scalars with the real unit matrix. The Fourier transform of tensor fields defined in this paper corresponds to Fourier transform of each of the tensor components in the field. It is shown that for this convolution and Fourier transform, the well known convolution theorem holds and optimization in speed can be achieved by using Fast Fourier transform algorithms. Furthermore, pattern matching on tensor fields based on this convolution is described. KEY WORDS Tensor Fields, Feature Detection, Fourier Transform
1 Introduction There are two main sources for tensor data sets. One is biomedical imaging. With MRI data from biomedical applications, diffusion tensors can be calculated. These diffusion tensors can then be analyzed to e.g. trace white fibers in the brain or fibers of the muscle of the heart [1, 2, 3]. Another application comes from finite element analysis, for example, in mechanical engineering, civil engineering [4] and material sciences [5]. There, stress and strain tensors are examined to determine behavior and stability under certain conditions like e.g. earthquakes. It is not easy to give an intuitive visualization of a tensor field as the data to be visualized at one point has a high dimension. For an arbitrary non-symmetric second order tensor in 3D, one has 9 data values at every data point. If the tensor is symmetric, this reduces to 6 values which is still a lot. There are two possibilities of visualizing such data. One can opt for visualization of the whole data. The other possibility is to preselect parts of the data. The selection can include omitting whole tensors which are of no further interest. Thus, the number of tensors to be visualized is reduced. The other possibility is to reduce the dimension of the data. Then, only derived values of the tensors like anisotropy or trace are visualized. One possibility of visualizing the tensors is to draw
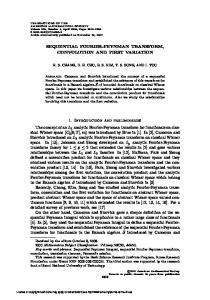
Figure 1. A simple push-pull data set. Tensor convolution combined with the normalized tensor scalar product as similarity measure. The pattern matching was done with a 3 × 3 × 3 push mask (figure 2). The similarity values are visualized using marching cubes with isovalue -0.4 (left) and 0.4 (right). The negative similarity values indicate the pull. Normalized tensor hedgehog and grid boundary are drawn additionally. The pictures were taken from above (top) and from a side (bottom) of the data set. The data set is described in detail in section 5.
every component separately as an array of gray scale or color mapped images arranged corresponding to the coordinate being visualized. Symmetric tensors have the advantage of having only real valued eigenvalues. These can be visualized using glyphs [6, 7] like tensor hedgehogs and ellipsoids. Another approach is to analyze the eigenvector fields separately. An eigenvector field is the field of those
Figure 2. A 3D mask describing a push, strain tensors. Left: Mask viewed from top. The push is applied at the center grid point at the top. Right: Mask viewed from one side.
Figure 3. Hedgehogs on a 2D mask describing a push (left). The push is applied at the center grid point. To be independent of the relative size of eigenvalues, the mask can be split up in two masks, each describing one of the eigenvectors (middle and right).
lution with the filter h : lines that correspond to the major, minor or, in 3D, medium eigenvalues. It can be visualized using glyphs, tensor field lines [8], tensorlines [9] and tensor field topology [10, 11]. Other visualization methods which work directly on the tensor field are hyper-streamlines [12], color coding of the direction of the principal eigenvector [13, 3], deforming grids [14] and volume rendering of derived values like anisotropy. The anisotropy of 2D tensor fields can also be visualized using adaptive filtering of noise fields [6] or HyperLIC [15]. With the large amount of data in tensor fields, it is desirable to have an algorithm that automatically preselects data points or areas with a certain behavior that is of interest. Otherwise, features are easily missed by an inspection of the data by the user. Therefore we show how to extend convolution and Fourier transform directly to second order tensor fields. We prove that the resulting theorems are similar to the original ones on scalar fields from image processing and can be calculated using fast Fourier transform algorithms. Then we give an algorithm for pattern matching that is based on convolution of tensor fields.
(h ∗ f )(x) =
n
Z
n �
Every linear and shift invariant filter (LSI filter) on a scalar field can be described as a convolution with a filter mask. A lot of filters for smoothing images (e.g. Gaussian filters) and for edge detection (e.g. Laplacian operator) are LSI filter. Thus, the convolution is an important operation in image processing [16, 17]. Convolution and correlation are closely related as every correlation can be computed as a convolution with a suitably permutated filter mask. The convolution theorem states that a convolution in image space is equal to a multiplication in frequency domain.
2.1 Convolution of Scalar Fields
�
is defined by
h(x0 )f (x − x0 )dx0 .
The spatial correlation is defined by Z (h ? f )(x) = h(x0 )f (x + x0 )dx0 . n
�
Thus, a convolution is just a correlation with a filter that has been reflected at its center. Let h˙ denote the reflected ˙ version of h, that is h(x) = h(−x). Then (h ? f )(x) = (h˙ ∗ f )(x).
(1)
2.2 Convolution on Tensor Fields A description of tensor algebra can e.g. be found in [18]. Let f : n → n×n be a second order tensor field and h : n → n×n a second order tensor valued filter. The convolution is defined as Z (h ∗ f )(x) = h(x0 )f (x − x0 )dx0 �
�
�
2 Convolution
→
n
where the integral is computed in each component and the tensors are multiplied using matrix multiplication. The correlation is defined analogous: Z (h ? f )(x) = h(x0 )f (x + x0 )dx0 . �
n
For discrete fields, convolution and correlation have to be discretized. For 3D uniform grids, the discretization is: (h ∗ f )j,k,l =
(h ? f )j,k,l =
r r r X X X
hs,t,u fj−s,k−t,l−u
r r r X X X
hs,t,u fj+s,k+t,l+u
s=−r t=−r u=−r
s=−r t=−r u=−r
In image processing, a filter is a map from one image to another. For a continuous signal f : n → , the convo�
with j, k, l, s, t, u ∈ . r3 is the dimension of the grid of the filter mask and the (j, k, l) are grid nodes. �
3 Fourier Transform on Tensor Fields The Fourier transform is a basis transform from image space to frequency space. Thus, images can be analyzed in frequency space where it is easier to describe features like orientation, phase, frequency and curvature. Filter responses are often analyzed or defined in the frequency domain. Transferring the Fourier transform to tensor fields in combination with convolution opens up a whole new approach for analyzing tensor fields. Dealing with simulations of e.g. shock waves (figures 4 and 5), it is only natural to have a look at the representation of fields in frequency domain. The shock wave data set is described in detail in section 5.
3.1 Fourier Transform on Scalar Fields For continuous signals f, h : n → , the Fourier transform of f is defined as Z F{f }(u) = f (x)e(−2πihx,ui) dx �
n
�
with i2 = −1 provided the integral does exist. The inverse transform is Z f (u)e(2πihx,ui) du. F −1 {f }(x) = �
n
A discussion of the existence of F, can be found in [19]. F exists if Z |f (x)|e(−2πihx,ui) dx < ∞. �
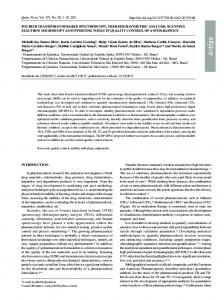
Figure 4. Fourier transform of a shock wave tensor field multiplied with a gaussion to get rid of high frequencies generated at the border. The bounding bos of the data set, the geometry of the pile itself and an isovalue of the amplitude of the Fourier transform of this dataset are shown. The main direction of the shock waves can easily be seen in frequency domain.
n
This is not always fulfilled though the integral of F might exist nonetheless. The convolution theorem is F{h ∗ f }(u) = F{h}(u)F{f }(u)
Theorem 3.1 (Shift theorem) Let f : tensor valued and let F{f } exist. Then
n
→
n×n �
be
0
F{f (x − x0 )}(u) = F{f }(u)e(−2πiIhx ,ui) Theorem 3.2 (Convolution theorem) Let f, h : n → n×n be tensor valued and let F{f } and F{h} exist. Then �
F{h ∗ f }(u) = F{h}(u)F{f }(u) Theorem 3.3 (Correlation theorem) Let the preconditions be as in 3.2. Then ˙ F{h ? f }(u) = F{h}(u)F{f }(u) Theorem 3.4 (Derivation theorem) Let the preconditions ∂f be as in 3.1. Let ∂x exist for all k. Then k � � ∂f (u) = 2πiIuk F{f }(u) F ∂xk
and the derivation theorem is � � ∂f (x) = 2πiuk F{f }(u) , k = 1, .., n. F ∂xk
The proofs of the theorems are straightforward from the proofs of scalar Fourier transform [17, 19] and the properties of the tensor Fourier kernel, which is
3.2 Fourier Transform on Tensor Fields We define the Fourier transform for a n × n tensor valued function f : n → n×n and vectors x, x0 , u ∈ n as Z F{f }(u) = f (x)e(−2πiIhx,ui) dx. (2)
e(−2πiIhx,ui) = Ie(−2πihx,ui) .
�
�
The inverse transform is F
−1
{f }(x) =
n
Z
f (u)e(2πiIhx,ui) du. �
(3)
Thus, a tensor field f can be regarded as n×n complex signals which are transformed separately with the usual complex Fourier transform. This implies that the basis functions of this tensor Fourier transform, separated in each of the coordinates of the tensor, are the same as those of the classical Fourier transform.
n
I is the n×n unit matrix and i the usual complex imaginary unit. The integral is computed componentwise. Most of the well-known theorems hold. Note that the tensors are complex valued.
3.3 Discrete Tensor Fourier Transform Just like the classical Fourier transform, the Fourier transform of tensor fields can be discretized for use on discrete
datasets. Let x = x1 e1 + x2 e2 + x3 e3 , u = u1 e1 + u2 e2 + u3 e3 , N = N1 N2 N3 and f : {0, .., N1 − 1} × {0, .., N2 − 1} × {0, .., N3 − 1} → n×n . The discrete tensor Fourier transform of tensor fields in 3D is defined as �
DT F T {f }(u) =
NX 1 −1 N 2 −1 N 3 −1 X X
f (x)e(−2πiIhx,ui/N ) .
x1 =0 x2 =0 x3 =0
(4)
The inverse discrete tensor Fourier transform in 3D is
N1 −1 NX 2 −1 N 3 −1 X 1 X f (u)e(2πiIhx,ui/N ) . N u =0 u =0 u =0 1 2 3 (5) The definitions for 2D are analogous.
DT F T −1{f }(x) =
× Theorem 3.5 (Shift theorem) We extend f to fc : × → n×n by fc (x + zNj ej ) = f (x) for j=1,2,3 and z ∈ . Then �
�
�
�
�
Figure 5. Auto correlation of the shock wave data set. Light gray: positive values. Dark gray: negative values. The data set is rotated bottom up in comparison to figure 4.
0
F{fc (x − x0 )}(u) = F{fc }(u)e(−2πiIhx ,ui/N ) Theorem 3.6 (Circular convolution theorem) We extend f, h to fc , hc : × × → n×n by �
�
�
�
fc (x + zNj ej ) = f (x) hc (x + zNj ej ) = h(x) for j=1,2,3 and z ∈ �
. Then
DT F T {hc ∗ fc }(u) = DT F T {hc}(u)DT F T {fc}(u) Theorem 3.7 (Circular correlation theorem) Let preconditions be as in (3.6). Then
the
DT F T {hc ? fc }(u) = DT F T {h˙c}(u)DT F T {fc}(u)
3.4 Fast Transform One of the reasons the Fourier transform is so successful in image processing is the existence of fast Fourier transforms (FFTs). Algorithms for the fast computation of the Fourier transform take a divide and conquer approach based on recursively dividing even and odd elements. The basic approach assumes that the dimensions of the images are of the form 2k . There exist algorithms based on the decomposition into prime factors of the dimensions of the images, too. As the tensor Fourier transform of a tensor field corresponds to an independent scalar Fourier transforms of each of the complex components of the tensor field, algorithms for computation of the fast Fourier transform can be directly used to speed up the transform. The tensor Fourier transform of figure 4 has been computed using a fast tensor Fourier transform. The auto-correlation of figure 5 has been computed in frequency space using a fast tensor Fourier transform, too.
4 Pattern Matching 4.1 Tensor Similarity Measure For pattern matching, it has to be determined what a match of tensors is and when tensors are similar. This is not quite trivial as one scalar value has to give the similarity of the whole tensors. Thus, the similarity can only be a derived value and does not give all nuances of the difference of tensors. A common similarity measure of two tensors T1 and T2 is the tensor scalar product hT1 , T2 i or T SP (T1 , T2 ) [20], which is a measure of the overlap between two tensors: hT1 , T2 i = trace(T1 T2 ) = |T1 T2 |1 As the scalar product is sensitive to the overall size of the tensors, it is often normalized: |T |n := trace(T n ) N T SP (T1, T2 ) =
hT1 , T2 i |T1 |n |T2 |n
This similarity can be applied directly in connection with convolution. First, the convolution of the full tensors is computed and then the trace of the result can be calculated.
4.2 Matching The big advantage of pattern matching using convolution is that it is robust in terms of noise. This is the case as convolution is a kind of averaging. The averaging effect grows with the size of the mask as convolution and correlation are statistical approaches. This property is especially important when dealing with measured tensor data where measurement errors easily create noise.
We have different possibilities of normalizing. First, the tensors of mask and field can be normalized. This would resemble matching of hyperstreamlines. The similarity values will be between −1 and 1, that is, they are normalized, too. This method corresponds also to computation of the normalized scalar product after computation of the convolution. Sometimes, it is better not to normalize the field, as regions with tensors of small magnitude are accentuated too much otherwise. For acceleration, the convolution can also be computed in frequency domain using fast Fourier transforms. In frequency domain, instead of a convolution at every data point, only one multiplication has to be computed as the convolution theorem (eq. 3.2) states. This also solves the problem of the huge computational cost of applying large masks.
5 Results The first data set where we applied pattern matching is a push-pull or load couple. It consists of a rectilinear grid of dimensions 16 × 8 × 16. The coordinates of the grid are [−7.5, 7.5] × [−7, 0] × [−7.5, 7.5]. On the surface, a push was applied at (0, 0, 4), a pull at (0, 0, −4), and the resulting strain tensors were computed. The formulas can be found in [5]. Push and pull can be seen clearly in figure 1. A pull mask can be generated from a push mask by multiplying all tensors of the mask with −1. Therefore, the push mask also recognized the pull. Note that the actual point of load is not on a data point but in the middle of the surface of a cell. After this academic test we applied some image processing tools to two data sets from numerical simulations. First, we computed the auto-correlation of a shock wave data set. The field consists of stress tensors of a concrete pile standing on solid earth. It is one timestep of a dynamic seismic loading [4]. We resampled the data set to a rectilinear grid with dimensions 32×32×32 which fits exactly into the cylinder of the original grid. The predominant direction of loading can be seen pretty well in the Fourier transform of the resampled data set (figure 4). We also computed the auto-correlation of this data (figure 5). There, the waves of the loading are reflected in waves of positive and negative self-similarity. All Fourier transforms were computed using FFT algorithms. The last data set comes from a CFD simulation. It is the symmetric part of a rate of strain tensor field of a vortex breakdown simulation. Vortex breakdown can be found in flows ranging from tornados, wing tip vortices, pipe flows to swirling jets. In combustion applications, swirling jets are important as they can create recirculation zones where the fuel elements have enough time for a complete reaction. This raises the efficiency of the combustion. Here, the turbulent swirling jet enters a fluid at rest. The simulation considers a cylinder, so that a planar cut along the axis of the cylinder can be used as a domain. The domain is discretized by a 124 × 101 rectilinear grid with smaller rectangles towards the axis of the cylinder. We applied the
Figure 6. Symmetric part of rate of strain tensors of a swirling jet entering a fluid at rest. Top: Magnitude of the tensors. Values from 0 (black) to 4 (white). Middle: Anisotropy and topology graph. Values from -1 (black, same absolute eigenvalues but different sign), 0 (gray, anisotrop) to 1 (white, isotrop). Bottom: Data set filtered with the 3 × 3 push mask of figure 3, bottom left. The normalized tensor scalar product results in similarity values from -0.7 (black, pull) to 0.7 (white, push).
2D push masks which can be found in figure 3. The results of the matching (figure 6) are similar to the computation of isotropy, though the matching distinguishes the regions further.
6 Conclusion We extended convolution and Fourier transform to second order tensor fields. The tensor Fourier transform corresponds to the computation of a scalar Fourier transform in each of the (complex) components of the tensor field. Thus, algorithms for a fast computation of the Fourier transform can be applied. We proved that tensor convolution in spatial domain is equal to multiplication of tensors in the frequency domain defined by our tensor Fourier transform. Therefore, this convolution theorem is analogous to the scalar case. This also implies that fast Fourier transforms can be applied to speed up the computation of convolutions. In addition we showed how a basic tensor similarity measure, the tensor scalar product, can be combined with tensor convolution. This led directly to an algorithm for pattern matching of tensor fields. This approach is superior to other approaches like matching of eigenvector fields, as it conserves more information of the tensor fields. Finally, as the approach is based on convolution, it is robust in terms of noise. Future work will include the investigation of methods to make the pattern matching invariant of the direction of structures in field and mask. The opened possibilities of analyzing tensor fields in frequency domain will be examined further. One path could be the application of Gabor filter, which can be understood as a localized Fourier transform, to tensor fields. Gabor filter are known to be optimal localized in both spatial and frequency domain. Thus, they are well suited for the description of features.
Acknowledgments First of all, we like to thank the members of the FAnToM development team. Further thanks go to Prof. Kollmann, MAE department, University of California at Davis, for producing the swirling jet data set and Prof. Jeremic, Department of Civil and Environmental Engineering, University of California at Davis, for the shock wave data set.
References [1] L. Zhukov and A. H. Barr. Oriented tensor reconstruction: Tracing neural pathways from diffusion tensor mri. In Proceedings of IEEE Visualization ’02, pages 387–394, Los Alamitos, CA, 2002. IEEE Computer Society. [2] L. Zhukov and A. H. Barr. Heart-muscle fiber reconstruction from diffusion tensor mri. In Proceedings of IEEE Visualization ’03, pages 597–605, Los Alamitos, CA, 2003. IEEE Computer Society. [3] D. Le Bihan, J.-F. Mangin, C. Poupon, C. A. Clark, S. Pappata, N. Molko, and H. Chabriat. Diffusion tensor imaging: Concepts and applications. Journal of Magnetic Resonance Imaging, 13:534–546, 2001. [4] B. Jeremic, G. Scheuermann, J. Frey, Z. Yang, B. Hamann, K. I. Joy, and H. Hagen. Tensor visualization in computa-
tional geomechanics. Int. J. Numer. Anal. Meth. Geomech., 26:925–944, 2002. [5] S.P. Timoshenko and J.N. Goodier. Theory of Elasticity. McGraw-Hill Kogakusha, Ltd., 1970. [6] A. Siegfridsson, T. Ebbers, E. Heiberg, and L. Wigstr¨om. Tensor field visualization using adaptive filtering of noise fields combined with glyph rendering. In Proceedings of IEEE Visualization ’02, pages 461–469, Los Alamitos, CA, 2001. IEEE Computer Society Press. [7] T. van Walsum, F. H. Post, D. Silver, and F. J. Post. Feature extraction and iconic visualization. IEEE Transactions on Visualization and Computer Graphics, 2 (2):pp 111–119, 1996. [8] R. R. Dickenson. A unified approach to the design of visualization software for the analysis of field problems. In SPIE Proceedings, volume 1083, Bellinham, Washington, 1989. SPIE - The International Society for Optical Engineering. [9] D. M. Weinstein, G. Kindlmann, and E. C. Lundberg. Tensorlines: Advection-diffusion based propagation through diffusion tensor fields. In Proceedings of IEEE Visualization ’99, pages 249–253, Los Alamitos, CA, 1999. IEEE Computer Society. [10] L. Hesselink, Y. Levy, and Y. Lavin. The topology of symmetric, second-order 3d tensor fields. IEEE Transactions on Visualization and Computer Graphics, 3 (1):1–11, 1997. [11] X. Tricoche, G. Scheuermann, and H. Hagen. Tensor topology tracking: A visualization method for time-dependent 2d symmetric tensor fields. In Eurographics 2001 Proceedings, Computer Graphics Forum 20(3), pages 461–470, Saarbr¨ucken, Germany, 2001. The Eurographics Association. [12] T. Delmarcelle and L. Hesselink. Visualizing second-order tensor fields with hyperstreamlines. IEEE Computer Graphics and Applications, 13 (4):25–33, 1993. [13] J. Ruiz-Alzola, C.-F. Westin, S. K. Warfield, A. Nabavi, and R. Kikinis. Nonrigid registration of 3d scalar, vector and tensor medical data. In Proceedings of Third International Conference On Medical Robotics, Imaging and Computer Assisted Surgery, pages 541–550, Pittsburgh, Pennsylvania, USA, 2000. [14] X. Zheng and A. Pang. Volume deformation for tensor visualization. In Proceedings of IEEE Visualization ’02, pages 379–386, Los Alamitos, CA, 2002. IEEE Computer Society. [15] X. Zheng and A. Pang. Hyperlic. In Proceedings of IEEE Visualization ’03, pages 249–256, Los Alamitos, CA, 2003. IEEE Computer Society. [16] B. J¨ahne. Digitale Bildverarbeitung. Berlin, Germany, 2002.
Springer Verlag,
[17] A. K. Jain. Fundamentals Of Digital Image Processing. Prentice Hall, Englewoods Cliffs, NJ, USA, 1989. [18] A. I. Borisenko and I. E. Tarapov. Vector and Tensor Analysis with Applications. Dover Publications, Inc., New York, 1979. [19] R. Bracewell. The Fourier Transform and Its Applications. McGraw-Hill Book Company, New York, 1965. [20] D. Alexander, J. Gee, and R. Bajcsy. Similarity measures for matching diffusion tensor images. In Proceedings of British Machine Vision Conference, pages 93–102, 1999.