Oct 7, 2008 - (4) and h is the smoothing parameter. Also, we assume that ... probability density function (pdf) F. A bootstrap sample of size n, xâ = xâ. 1,xâ.
Corrected Bootstrap Iterative Method of Estimating the Optimal Smoothing Parameter in Kernel Density Estimation Peter J. Foster & Andreas Vrahimis First version: 7 October 2008
Research Report No. 14, 2008, Probability and Statistics Group School of Mathematics, The University of Manchester
Corrected bootstrap iterative method of estimating the optimal smoothing parameter in kernel density estimation Peter J. Foster and Andreas Vrahimis School of Mathematics University of Manchester Manchester, UK
Abstract: A smoothing correction is proposed to deal with the bias in the estimation of the optimal smoothing parameter in the univariate density estimation. The smoothing correction is shown to succeed in removing the bias in the estimation of the bootsrtap estimate of the MISE so that the smoothing parameter estimate obtained is closer to the MISE minimizing optimal smoothing parameter. Simulations using different mixtures of Normal distributions are provided, to show how the correction manages to improve the estimation of the optimal smoothing parameter, compared to the non corrected method and other popular methods used.
Keywords: Smoothing parameter, density estimation, bias correction
Foster and Vrahimis
1
October 7, 2008
1
Introduction
Given a random sample x1 , . . . , xn , drawn from a density f (x), the kernel density estimator is defined by � � n 1 X x − xi 1 fˆh (x) = K (1) n i=1 h h where K is a smooth kernel function satisfying Z
K(x) dx = 1
(2)
xK(x) dx = 0
(3)
x2 K(x) dx = σ 2
(4)
Z Z
and h is the smoothing parameter. Also, we assume that derivatives of all orders exist for the kernel density estimate (kde) and are sufficiently smooth, even when n is fairly small. It has been shown that the choice of smooth kernel function K is not crucial in the construction of the kernel density estimator. This is because although the most efficient kernel is the Epanechnikov kernel with efficiency 1, other kernels also have efficiency close �(1/2)
�
to 1 with the Gaussian kernel having efficiency equal to 36π ≈ 0.9512. Therefore 125 other factors like the degree of differentiability or the ease of computation are considered for choosing the kernel ([5] Silverman B.W. (1986) p.43) and the Gaussian kernel is favoured in such cases. In the sections that follow the Normal kernel is used because of its desirable properties that make computations easier and more convenient. However, with the use of equivalent kernels and canonical bandwidths the Normal kernel can be replaced by other kernels by adjusting the smoothing parameter accordingly ([2] H¨ardle W., M¨ uller M., Sperlich S. and Werwatz A. (2004) p.57-60). The estimation of the optimal smoothing parameter is of great importance in kernel density estimation applications. A choice of smoothing parameter h close to the optimal hopt , that minimises the Mean Integrated Squared Error (MISE), leads to a density estimate which is neither undersmooth (too rough) nor oversmooth. This provides us with an estimate of the distribution of the sample of interest, where no true features of the distribution are lost (oversmoothing) and also no features are a result of roughness due to undersmoothing. The MISE is defined as MISE(h) = E (ISE(h)) (5) MISE(h) = ISB(h) + IV(h) = E with ISB(h) = IV(h) =
Z ��
Z � n
Z �
f (x) − fˆh (x)
E(fˆh (x)) − f (x) o2 �
E fˆh (x)
n
�
�2
�2
dx
− E fˆh (x)
�o2 �
dx
(6) (7)
dx
(8)
where ISB is the Integrated Squared Bias, IV is the Integrated Variance and f (x) is the true distribution of x. Foster and Vrahimis
2
October 7, 2008
An optimally smoothed kernel density estimate can be used to estimate derivatives of a given function and to interpret features of the underlying distribution of a dataset (peaks, troughs and skewness). In the following sections we describe a bootstrap based method of estimating the optimal smoothing parameter robustly ([6] Taylor C.C. (1989)) and a modification that manages to improve the performance of the method (Hahn and Foster). We then identify the main source of bias in the method and propose a correction to remove the bias introduced by this method, with considerable success. Extensive simulations are then conducted, using datasets with different features, to compare between the corrected method, the uncorrected method and other popular methods used in univariate density estimation.
2
Taylor’s bootstrap choice of smoothing parameter in kernel density estimation
The bootstrap resampling method is often used to make inferences about the sampling distribution of a statistic of interest φ(x1 , x2 , . . . , xn , F ), using the observed data. More formally, if we have a random sample of size n defined as x = x1 , x2 , . . . , xn and randomly drawn from a population, then the x0i s are independent and identically distributed (iid) with probability density function (pdf) F . A bootstrap sample of size n, x∗ = x∗1 , x∗2 , . . . , x∗n , is then randomly drawn from Fˆn which is the population distribution function in the bootstrap domain. Hence, the x∗i s are iid with distribution Fˆn and we can estimate the statistic of interest by considering φ(x∗1 , x∗2 , . . . , x∗n , Fˆn ). The bootstrap expectation of the statistic of interest is an unbiased estimate of the statistic based on the original sample. Therefore, the standard bootstrap resampling method is not appropriate in situations where we want to model an amount of bias introduced in the relationship of interest. This is also the case in the situation where we have smoothing involved in the estimation of a function or parameter and in that case the smooth bootstrap would be more appropriate. The smooth bootstrap differs from the simple bootstrap in that instead of sampling with replacement from the original sample of interest, we sample from a smooth function of that sample, fˆx (h). The bootstrap resamples x∗i are sampled from the smooth function fˆh (x) and can be generated in the following way ([5] Silverman B.W. (1986) p.143-144): 1. Choose I uniformly from {1, . . . , n}, with replacement. 2. Generate � to have probability density function K, the kernel function used to construct fˆ. 3. Set x∗ = xI + h� . 4. In order to correct the increase in variance caused from smoothing we can set x∗ = 1/2 2 x¯ + (x − x¯ + h�) / (1 + h2 σK /σx2 ) where x¯ and σx2 are the sample mean and variance 2 of {Xi } and σK is the variance of the kernel K. This step replaces step 3 when we want the realisations to be variance corrected. In the case where the Gaussian kernel is used, this procedure is not necessary since the bootstrap mean can be calulated without any actual resampling taking place. This makes the whole process less time consuming and the BMISE can be given in closed form. Foster and Vrahimis
3
October 7, 2008
In the problem we are interested in, minimizing the MISE would be equivalent to minimizing the Bootstrap MISE (BMISE) defined by BMISE(h) = BISB(h) + BIV(h) = E∗ with BISB(h) = BIV(h) =
Z �
Z h�
�
E∗ fˆh∗ (x)
E∗
��
fˆh∗ (x)
�2 �
��
Z �
�2
fˆh∗ (x) − fˆh (x) i2
− fˆh (x) dx
n
�
− E∗
fˆh∗ (x)
�o2 �
dx
(9) (10)
dx
(11)
where BISB is the Bootstrap Integrated Squared Bias, BIV is the Bootstrap Integrated Variance and fˆh∗ (x) is the smooth kde of the bootstrap sample, x∗1 , . . . , x∗n , obtained from the smooth version fˆh (x) of the original sample x1 , . . . , xn . The fˆh∗ (x) can be expressed as � � n 1 X x − x∗i 1 ∗ ˆ fh (x) = K . n i=1 h h
(12)
Taylor has shown ([6] Taylor C.C. (1989)) that using the Normal kernel, the BMISE is given by BMISE(h) = E∗ =
Z �
�2
fˆh∗ (x) − fˆh (x) "
1
X 1
2n2 h(2π) 2 −
4 X 1
32
i,j
1 2
X
+2
i,j
i,j
dx
(xj − xi )2 exp − 8h2
(xj − xi )2 exp − 6h2
(xj − xi )2 exp − 4h2
!
!
!
+ n2
1 2
#
(13)
and by taking expectations, using a substitution with a Taylor series expansion and 00 0 +∞ assuming that h → 0, n → ∞ and that the condition [f 000 (y)f (y)]+∞ −∞ = [f (y)f (y)]−∞ = 0 holds, the asymptotic expression is given by 1.074 h4 Z 2 √ + (f 00 (y)) dy + O(h6 ). (14) 2nh π 4 Comparing the asymptotic expression of BMISE with the asymptotic expression of MISE for Normal kernel estimator used, denoted 1 h4 Z 1 2 √ + (f 00 (y)) dy + O(h6 + ) 2nh π 4 n
(15)
we can see that there is small bias of the order O ((nh)−1 ). For a robust correction of this bias Taylor proposed the removal of the diagonal terms in the summations of the BMISE expression (13) to get the modified function ∗
BMISE (h) =
Foster and Vrahimis
"
1
(xj − xi )2 exp − 8h2 i6=j
!
X 1
2n2 h(2π) 2 4
October 7, 2008
(xj − xi )2 − 1 exp − 6h2 3 2 i6=j 4 X
(xj − xi )2 +2 exp − 4h2 i6=j 1 2
!
!
X
+ n2
1 2
#
(16)
which has the same rate of convergence as MISE(h). Taylor showed that the variance of the estimator is given by ∗
V ar {BMISE (h)} =
0.026 Z
h {f (y)} dy + O n2
!
2
(17) 1 8n2 hπ 2 which is an order of magnitude less compared to the variance of the unbiased crossvalidation (UCV) estimator " ! �2 # �Z 4 1 4 Z h +O f (y)2 dy V ar {UCV(h)} = + f (y)3 dy − n n2 h n
(18)
that is defined as UCV(h) =
1 1
2n2 h(2π) 2
4n + 2
1 2
(xj − xi )2 exp − 4h2 (
X i,j
)
−4
i,j
)
(xj − xi )2 exp − 2h2 (
X
(19)
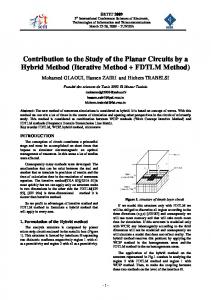
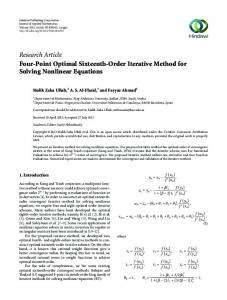
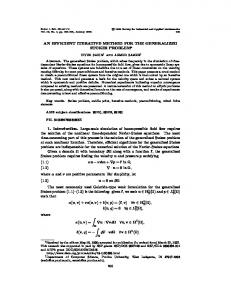
for large n. However, he pointed out that the method tends to provide smoothing parameters larger than the optimal which lead to oversmoothing of the kde and even in some cases the BMISE∗ (h) curve can be monotonic and strictly decreasing. In that case the method fails in finding a smoothing parameter that minimizes the BMISE∗ (h), even after removing the diagonal terms, and can be therefore considered generally inconsistent with various samples. To show the effect of the removal of the diagonals to the method we present plots with the BIV, BISB and BMISE for the method with and without the diagonals. Superimposed on the plots are the curves of the IV, ISB and MISE, for comparison, and these functionals are drawn with solid lines compared to the bootstrap estimates which are plotted with dotted lines. The limits of the x-axis and y-axis of the plots are chosen to be the same for each method so that comparisons can be made more effectively and meaningfully. The sample used is a random sample of size 100 simulated from the Gaussian distribution with mean 0 and standard deviation 2. In Figure 1 we can see the IV (solid line) and the BIV estimate (dotted line) for Taylor’s method with (left plot) and without the diagonals (right plot). Both estimates of the BIV are very good estimates of the IV and that can be seen by the fact that the solid lines and the dotted lines are almost identical on the two plots. Therefore, removing the diagonals doesn’t affect the estimation of the BIV which is already a good estimate of the IV. From Figure 2 we can see that the BISB (dotted line) is a bad estimate of ISB (solid line) with and without the diagonals. By removing the diagonal terms (plot to the right), we can see that the BISB decreases for smaller values of h, taking negative values and also the curve diverges from ISB as h increases. Comparing the two plots in Figure 3 we can not see much discrepancy between the BMISE with and without the diagonals (dotted line) and in both cases the resulting estimate is a bad estimate of the MISE (solid line), as it diverges from MISE and the minimum point Foster and Vrahimis
5
October 7, 2008
Figure 1: BIV and IV for Taylor’s method with (left plot) and without the diagonal terms (right plot)
Figure 2: BISB and ISB for Taylor’s method with (left plot) and without the diagonal terms (right plot)
Figure 3: BMISE and MISE for Taylor’s method with (left plot) and without the diagonal terms (right plot)
of the curve is shifted towards larger values of h. The optimal smoothing parameter from Taylor’s method with the diagonals is h = 1.045 and without the diagonals it is h = 1.012. The MISE minimizing value of the smoothing parameter is equal to hopt = 0.8663 which Foster and Vrahimis
6
October 7, 2008
is substantially lower than the smoothing parameters obtained with Taylor’s method with and without the diagonals. Therefore, in this case, the removal of the diagonals manages to slightly improve the estimate of the smoothing parameter but fails to trace ISB for larger values of the smoothing parameter and also takes negative values which should not be the case for a non negative function. Taylor noted ([6] Taylor C.C. (1989)) that the BMISE∗ (h) sometimes only attains a local minimum, in the case where the sample size is small and he suggested that the method should be used for sample sizes larger than 100.
3
Iterative bootstrap choice of smoothing parameter in kernel density estimation
Foster and Hahn showed in their work that the reason Taylor’s technique can lead to a strictly decreasing BMISE estimate is that the technique fails to mimic successfully the bias part of MISE (ISB), with BISB. This can be the case regardless of the good asymptotic results, due to the fact that in many cases the assumptions of large sample size n and small smoothing parameter h are not justified by the sample of interest. In the light of these issues with the bootstrap method, Foster and Hahn proposed an alternative method of smoothing parameter selection which is more flexible with respect to sample differences. The method is using an iterative pilot smoothing parameter g, for the estimation of the MISE, which updates with every iteration and tries to model the bias quantity more accurately. The main ngoal of this bootstrap method is to model approximately the probability diso ˆ tribution of fh (x) − f (x) , by the probability distribution of the conditional estimator o n fˆ∗ (x) − fˆh (x)| x1 , x2 , . . . , xn . If the approximation is close enough to the relationship of h
interest, then the trade off between the bias and the variance components of the MISE (ISB and IV) can be estimated effectively and provide a smoothing parameter close to the smoothing parameter that minimizes MISE. The reason that the smoothed bootstrap is used is to account for the ISB part of the MISE, since the standard discrete bootstrap is an unbiased resampling method. Therefore the BMISE takes the following form BMISE(h) = BISB(h) + BIV(h) Z = E∗ (fˆ∗ (x) − fˆg (x))2 dx
(20)
h
where g is the pilot smoothing parameter, changing after each iteration. This can be seen as a generalized method where Taylor’s method is a special case when g = h. 3.1
Iteration procedure
Here the procedure involves drawing bootstrap samples from the density estimate n 1 X 1 x − xi ˆ fg (x) = K n i=1 g g
Foster and Vrahimis
7
!
(21)
October 7, 2008
where g is initially chosen arbitrarily or set to be equal to the Normal rule of thumb estimate of g = 1.06ˆ σ n−1/5 ([5] Silverman B.W. (1986) p.45), where σ ˆ is the sample standard deviation and n is the sample size. The bootstrap mean of the ISE, with respect to the density fˆg , is used in this case and h varies over the candidate values. When the Gaussian kernel is used, BISB and BIV can be evaluated manually and their explicit expressions are given by 1 X 1 −(xi − xj )2 q BISB(h) = exp √ n2 i,j 4(h2 + g 2 ) 2π 2(h2 + g 2 ) "
−(xi − xj )2 2 exp −√ √ 2 2(h2 + 2g 2 ) 2π h + 2g 2 !# 1 −(xi − xj )2 + √ exp 2g π 4g 2
!
!
1 X 1 −(xi − xj )2 1 √ − 3 exp BIV(h) = √ q 2nh π n i,j 2(h2 + g 2 ) 2π 2(h2 + g 2 ) "
(22) !#
(23)
The detailed steps of the procedure are the following: 1. Choose a reasonable initial value for the pilot smoothing parameter g0 , like the Rule of thumb. 2. Create a dense grid of h values (call the grid H), h1 , h2 , . . . , hn , around g0 . 3. Compute the density estimate fˆg0 (x) at the grid points x. 4. Construct the BMISE for the grid of h values (each one of them), by adding up expressions (22) and (23). 5. Define the new pilot smoothing parameter gnew as gnew = arg minh∈H BM ISE(h)
(24)
6. If |gnew − g0 | < δ, for small δ > 0, then the process stops and the optimal smoothing parameter is set to hBI = gnew . Otherwise gnew is set as the new pilot smoothing parameter g0 and steps 2 to 6 are repeated until the process converges to an optimal value. This iterative bootstrap procedure generally produces better estimates of ISB than Taylor’s method (with and without the diagonal terms) and the occasional problem of not attaining the global minimum, is resolved. This is due to the fact that the BISB is a better estimate of the ISB and the underestimation that is evident in Taylor’s method is substantially reduced. To show the effect of this change in the method we present the BIV, BISB and BMISE estimates along with the IV, ISB and MISE superimposed on the same plots for the Taylor’s method without the diagonals and Hahn’s and Foster’s iterative method. The same sample of size 100 that was used for Figures 1,2 and 3 is used here for comparison.
Foster and Vrahimis
8
October 7, 2008
Figure 4: BIV and IV for Taylor’s method without the diagonal terms (left plot) and bootstrap iterative method (right plot)
In Figure 4 we can see the BIV estimate (dotted line) with the IV (solid line) on the same plot for Taylor’s method with the diagonals (left) and the BIV estimate (dotted line) with the IV (solid line) on the same plot for the bootstrap iterative method (right). In both plots the BIV estimate is a very good estimate of the IV and therefore the solid line and the dotted line are almost the same. Hence, the variance part of the BMISE seems to be a good estimate of the variance part of the MISE, regardless of the method used.
Figure 5: BISB and ISB for Taylor’s method without the diagonal terms (left plot) and bootstrap iterative method (right plot)
In Figure 5 we observe that the BISB estimate (dotted line) of the bootstrap iterative method (right plot) is larger and closer to the ISB (solid line) compared to Taylor’s method estimate of BISB without the diagonal terms (plot to the left). Also the problem with the negative values for small values of h is not evident with the bootstrap iterative method. Displayed in Figure 6 are the plots of the BMISE (dotted line) and the MISE (solid line) for the two methods. The plot to the right (bootstrap iterative method) provides a better estimate of the BMISE than the plot to the left (Taylor’s method without the diagonals) and we can see that the underestimation is smaller in the case of the bootstrap iterative method, which leads to an estimate of the optimal smoothing parameter that is closer to Foster and Vrahimis
9
October 7, 2008
Figure 6: BMISE and MISE for Taylor’s method without the diagonal terms (left plot) and Hahn’s and Foster’s method (right plot)
the MISE minimizer. The estimated value obtained for the smoothing parameter with the bootstrap iterative method is equal to h = 0.9115 and it is closer to the MISE minimizing value of hopt = 0.8663, compared to Taylor’s method without the diagonals where the BMISE minimizing smoothing parameter is equal to h = 1.012. As we can see from the estimate of the BMISE using the bootstrap iterative method (Figure 6 plot to the right) and also from BMISE estimates using other random samples generated from various distributions, there still exists an amount of underestimation in the estimation of ISB by the BISB. In the section that follows we try to identify why this bias is evident and try to minimize it by applying a correction to the bootstrap iterative method.
4
Smoothing correction of bootstrap iterative method
We have seen that the bootstrap iterative method performs better than Taylor’s method in estimating the MISE but the BISB is still underestimating the ISB leading to a global minimum for the BMISE which corresponds to a larger value of h than the MISE minimizing hopt . In order to find a correction for this underestimation, a deeper understanding of the situation is needed so that the source of the bias can be recognised. What this method is trying to do is mimic the relationship between f (x) and fˆh (x) by the relationship between fˆg (x) and fˆh∗ (x). To see the differences between these two relationships we derive the expectations of the four components for Normal f (x) and compare between the discrepancy of the two relationships. Here as an example we set f (x) = N(x, σ 2 ), the Normal density with mean 0 and variance σ 2 . �
E fˆh (x)
�
n 1X 1 x − xi = E K n i=1 h h
�
�!
n � � 1X = E N x − xi , h2 n i=1
Foster and Vrahimis
10
!
October 7, 2008
n � � �� 1X E N x − xi , h2 n i=1
=
n Z +∞ � � � � 1X N x − y, h2 N y, σ 2 dy = n i=1 −∞
= N(x, σ 2 + h2 ) �
�
E fˆg (x)
(25)
n 1X 1 x − xi = E K n i=1 g g
!!
n � � 1X = E N x − xi , g 2 n i=1
!
n � � �� 1X E N x − xi , g 2 n i=1
=
n Z +∞ � � � � 1X = N x − y, g 2 N y, σ 2 dy n i=1 −∞
�
= N x, σ 2 + g 2
E∗
�
�
fˆh∗ (x)
�
(26)
n 1X 1 x − x∗i K n i=1 h h
�
= E∗
�!
n Z +∞ 1X 1 x−y ˆ K fg (y)dy = n i=1 −∞ h h
�
�
n Z +∞ 1 x−y = K n −∞ h h �
=
Z +∞
�
N x − y, h2
−∞
�
�
n 1 y − xi 1X K dy n i=1 g g
!
n � � 1X N y − xi , g 2 dy n i=1
n � � 1X N x − xi , h2 + g 2 = n i=1
�
E E∗
�
fˆh∗ (x)
��
n � � 1X = E N x − xi , h2 + g 2 n i=1
(27)
!
n Z ∞ � � � � 1X = N x − y, g 2 + h2 N y, σ 2 dy n i=1 −∞
�
= N x, σ 2 + g 2 + h2
�
(28)
From equations (25), (26) and (28) we can see that the bootstrap iterative method is effectively trying to model the relationship between f (x) and fˆh (x) with a relationship that is not identical to the relationship of interest. This is evident from the fact that the expectations of the components of the two relationships are not identical and the resulting distributions, in the case of Normal kernels, have different variances, as the first comprises of N(x, σ 2 ) and N(x, σ 2 + h2 ) and the second of N(x, σ 2 + g 2 ) and N(x, σ 2 + g 2 + h2 ). To see how this can Foster and Vrahimis
11
October 7, 2008
cause the bias which is evident in the estimation of ISB by BISB, we compute the expectation of BISB with respect to a Gaussian distribution with mean 0 and variance σ 2 as the true distribution and also the ISB. E (BISB(h)) = E
�Z �
E∗
�
�2
�
fˆh∗ (x) − fˆg (x)
�
dx
√ # 1 2 1 √ √ = −√ √ 2 + √ √ 2 π h2 + g 2 + σ 2 π h + 2g 2 + 2σ 2 2 π g 2 + σ 2 2 1 1 √ − √ √ 2 + (29) + √ √ 2 2 2 2ng π 2n π h + g n 2π h + 2g �
n−1 n
�"
ISB(h) =
Z �
�
�
E fˆh (x) − f (x)
�2
dx √ 1 2 1 √ √ = √ √ 2 − + √ 2 π h + σ2 π h2 + 2σ 2 2σ π
(30)
To compare the two expressions we fix a value for σ and choose g to be the normal optimal value defined by gN O = 1.06 σ ˆ n−1/5 , where n is the sample size. Then for h we choose a grid of size m given by h1 , . . . , hm , centred around the optimal value of gN O . We try a few combinations of values of σ and n to get a general impression of the discrepancy between expression (29) and (30) and the resulting plots are given below:
Figure 7: Plots of E(BISB) (dotted line) and ISB (solid line) for n = 50 and σ = 0.5 (first plot), n = 50 and σ = 3 (second plot) and n = 200 and σ = 3 (third plot), respectively
As we can see from the graphs in Figure 7, the expectation of BISB (dotted line) tends to slightly underestimate ISB (solid line) and the underestimation seems to depend on the sample size n and maybe on the standard deviation σ. The increase of the standard deviation (second plot) doesn’t seem to affect the discrepancy of the expectation of the BISB with the ISB but the increase of the sample size (third plot) seems to improve the expectation of the BISB, which is now closer to the ISB (solid line). Therefore, a reasonable remedy to this problem would be to find a smoothing correction, when estimating BISB, which removes some amount of smoothing from fˆg (x), when comparing the two functions. That will help to compensate for the underestimation in the BISB estimate as we will be comparing the bootstrap expectation of fˆh∗ (x) with fˆg−� (x) instead of Foster and Vrahimis
12
October 7, 2008
fˆg (x), where � depends on h. This way the corrected BMISE will be a better approximation to MISE and the smoothing parameter minimizing BMISE will be closer to the MISE minimizing hopt . To determine the form of the correction, �, we decide to give it the general form of � = αh1.1 , where α is a constant. This is because the underestimation seems to increase as h increases and we want the correction to be of slightly larger magnitude for larger h. The power 1.1 was decided to incorporate for the nonlinear increase of the bias as h increases, without being large enough to overcorrect in some datasets where the optimal h is too large. What remains to be defined are the factors on which α depends on and the exact form of their relationship. As reasonable factors of dependency, the sample size n and the sample standard deviation s were chosen, as they are the factors which when combined together give us a general idea of how much information we have related to the measure of spread of the sample. In order to make the correction automatic and robust, we use simulations to decide the way that α depends on n and s. For the simulations h1.1 was fixed and a grid of α values was created, ranging from −0.15 up to 0.35. Then from a sample of 50 simulated datasets of size n from a Normal distribution with mean 0 and standard deviation σ, the value of α minimizing the Sum of Squared Errors (SSE) between BMISE and MISE was obtained, for the range of values of x. Their average α ¯ was then the estimate of α for the chosen value of the sample size n and the standard deviation s. The simulations were repeated for various fixed sample sizes and varying standard deviation and then for fixed standard deviation and varying sample size. The sample sizes ranged from 20 to 250 and the standard deviations of the distributions ranged from 0.05 to 10. After the α ¯ is obtained for all the values of the standard deviation and the sample size, we try to find functionals which express the relationship between α, n and s better. Due to the shape of the plots of α against s for fixed n and α against n for fixed s, we try to fit a nonlinear regression curve to the points for each case. The form of the nonlinear regression is α = c1 −exp(sc2 ) for n fixed and α = c3 −exp(nc4 ) for s fixed. Fitting the models to the data, we obtain values for the parameters c1 , c2 , c3 and c4 and for n fixed we find the way that c1 varies with n to be c1 = 5.6869 − exp(n0.01446 ), using nonlinear regression. In the same way we obtain for c2 the relationship c2 = 2.743 − exp(n0.00158 ) and for s fixed we get c3 = 5.6947 − exp(s0.023995 ) and c4 = 2.733 − exp(s0.001314 ). When these are combined we get two functions for α which we will define as A1 and A2 and they are given by A1 : α = 5.6947 − exp(s0.023995 ) − exp(n2.733−exp(s and A2 : α = 5.6869 − exp(n0.01446 ) − exp(s2.743−exp(n
0.001314 )
0.00158 )
)
(31)
).
(32)
It can be seen that when n is quite large, then α converges to 0 and then takes negative values leading to a reverse effect of the correction. To make up for this and avoid bias when the sample size is too large, we trim the value of α in the following way: (
α=
α for α > 0 0 for α ≤ 0
(33)
Therefore for both A1 and A2 versions of the correction, the trimming in equation (33) is applied. Foster and Vrahimis
13
October 7, 2008
The expectation of the BISB with the correction takes the following form: �Z �
E∗ fˆh∗ (x) − fˆg−� (x)
n−1 n
�"
E (BISB(h)) = E �
=
�2
�
�
�
dx
√ 1 2 q √ √ 2 − + √ 2 π h + g2 + σ2 π h2 + g 2 + (g − �)2 + 2σ 2 1
#
1 2 + √ q + √ √ 2 − √ q + 2 2n π h + g 2 π (g − �)2 + σ 2 n 2π h2 + g 2 + (g − �)2 1 √ (34) + 2n(g − �) π where � = αh1.1 . Below we produce the plots of the corrected E(BISB) (34) with ISB for fixed σ and sample size n (30), to compare with the plots obtained in Figure 7.
Figure 8: Plots of corrected E(BISB) (dotted line) and ISB (solid line) for n = 50 and σ = 0.5 (first plot), n = 50 and σ = 3 (second plot) and n = 200 and σ = 3 (third plot), respectively
As we can see from Figure 8 the expectation of the corrected BISB (dotted line) provides a better estimate of the ISB (solid line) compared to the uncorrected BISB (29) for different combinations of the sample size n and the standard deviation σ, under the Normality assumption. In the first plot of Figure 8 we can see that the corrected E(BISB) (dotted line) slightly overestimates the ISB (solid line) but for larger standard deviation (second plot) and larger sample size (third plot), the corrected E(BISB) is a good estimate of the ISB (solid line). In order to observe the effect of the correction on the BMISE for the random sample used previously, we provide plots of BIV, BISB and BMISE with IV, ISB and MISE superimposed for the bootstrap iterative method and the corrected method with A1 chosen as α. In Figure 9 we can see that the estimates of the BIV for the bootstrap iterative method (plot to the left) and the corrected method (plot to the right) are both very good estimates of the IV (solid line) and no clear discrepancy can be observed between them. In Figure 10 we can see that the corrected method (plot to the right) provides a much better estimate of the ISB, with BISB, compared to the uncorrected method and the underestimation evident on the left plot (uncorrected method) has severely decreased with the correction. Foster and Vrahimis
14
October 7, 2008
Figure 9: BIV (dotted line) and IV (solid line) for bootstrap iterative method (left plot) and corrected method (right plot)
Figure 10: BISB (dotted line) and ISB (solid line) for bootstrap iterative method (left plot) and corrected method (right plot)
The overall effect of the correction on the BMISE is evident below, in Figure 11, where we can see that the BMISE estimate of the corrected method (dotted curve to the right) is closer to the MISE (solid line) than the uncorrected method and the BMISE minimizing smoothing parameter is closer to the MISE minimizing smoothing parameter. The BMISE minimizing value of h for the corrected method is equal to h = 0.8539 compared to h = 0.9115 obtained with the bootstrap iterative method. Considering the fact that the optimal smoothing parameter is equal to h = 0.8663, then the corrected method provides an improved estimate of the optimal smoothing parameter compared to the previous methods considered and has managed to compensate for the underestimation that was evident before the correction was applied. In section 4.1 we provide some asymptotic results to justify the effect of the correction theoretically.
Foster and Vrahimis
15
October 7, 2008
Figure 11: BMISE (dotted line) and MISE (solid line) for bootstrap iterative method (left plot) and corrected method (right plot)
4.1
Asymptotic results
To see the discrepancy between the asymptotic expressions of the BMISE for the various versions of the bootstrap method and the optimal MISE, we provide the asymptotic expressions√of the BMISE estimate for large n → ∞, small h → 0, small g → 0, nh → ∞, ng → ∞ and h2 + g 2 → 0. For Taylor’s bootstrap method the asymptotic expression for the BMISE is given by ([6] Taylor C.C. (1989)): 1.074 h4 Z 2 √ + (f 00 (y)) dy + O(h6 ) (35) 2nh π 4 This expression is derived after taking the expectation of BMISE with Normal kernels, using a substitution, a Taylor’s series expansion and using the condition that any probability density function satisfies the condition that BMISE(h) =
+∞
+∞
[f 000 (y)f (y)]−∞ = [f 00 (y)f 0 (y)]−∞ = 0
(36)
For the bootstrap iterative method the analogous asymptotic expression of the BMISE is given by: 1 h4 Z 2 √ + BMISE(h) = (f 00 (y)) dy + 2nh π 4 O
�
2
h +g
� 2 3
�
6
2
+ g − h + 2g
� 2 3
1 1 − − 2√ 2 n n h + g2
!
(37)
For the corrected method we get the equivalent asymptotic expression given by: !Z 1 h4 h2 �2 �4 2 2 2 2 3 √ + BMISE(h) = + h g� + g � − + − g� (f 00 (y)) dy + 2nh π 4 2 4 ! � �3 � � 1 1 6 2 2 2 2 2 3 O h +g + (g − �) − h + g + (g − �) − − 2√ 2 n n h + g2 Foster and Vrahimis
16
October 7, 2008
(38) where � = αh1.1 and α is small. The asymptotic expression of the MISE for a Normal kernel is the following: 1 h4 Z 1 2 √ + (39) (f 00 (y)) dy + O h6 + 2nh π 4 n If we compare the asymptotic expressions of BMISE for the various versions of the bootstrap iterative method and the MISE, we can see that the expression of the uncorrected bootstrap iterative method provides a better asymptotic approximation to the MISE, compared to Taylor’s bootstrap method. The improvement is of the order O ((nh)−1 ) but as we have seen in Figure 6, although Taylor’s bootstrap method performs well for small values of h, it tends to underestimate the MISE as h increases. This is probably the case because as h increases the assumptions of h → 0 and nh → ∞ are not valid and other factors come into effect. In the asymptotic approximation of the corrected method (38) we can see that the second part of � the expression � � has 2 5 more � terms which depend on h and g and can be � written � �2 � 2 2 2 2 as h g� − 2 + � g + 4 − g� . Rearranging some of the terms we get h � g − 2� + �
�
MISE(h) =
�
2
�
�2 �4 + g (g − �) and since h, g, (g − �), �2 , α (condition 33) and � are positive, then the above expression is always positive. This leads to an asymptotic estimate of the BMISE (38) which is larger than the asymptotic estimate of the uncorrected method (37) and increases as h increases, providing a better estimate of the MISE. This extra nonnegative term justifies the difference between the E(BISB) curves (dotted lines) in Figure 7 (uncorrected method) and Figure 8 (corrected method) and explains the reduction of the underestimation in the three plots of Figure 8. In order to examine experimentally how the corrected method manages to decrease the bias in the estimation of the optimal smoothing parameter by providing a better estimate for MISE, we perform extensive simulations.
5
Simulation results
We want to see the effect of the correction on the bootstrap iterative method and also compare the corrected method with some of the popular and widely used methods in univariate kernel density estimation. Therefore, we perform simulations with samples of different sample size and variance, simulated from four distributions with different characteristics. The statistic of interest is the ratio of the optimal smoothing parameter, using each of the methods, to the MISE minimizing smoothing parameter hopt , averaged for 500 random samples. The methods used for the simulations are explained more analytically below: • A1 represents the corrected trimmed method with the A1 version of α (equation 31). • A2 represents the corrected trimmed method with the A2 version of α (equation 32). • HF is the uncorrected method by Hahn and Foster explained in section 3 (equations 22 and 23). • BT is the Bootstrap Taylor’s method without the diagonal terms, explained in section 2 (equation 16). Foster and Vrahimis
17
October 7, 2008
• BCV is the Biased Cross validation where the expression to be minimized for Normal kernel is given by ([3] Scott D.W. (1992) p.167) ! � � X � (xi − xj ) �4 1 (xi − xj ) 2 1 √ + √ BCV(h) = − 12 + 12 2nh π 64n2 h π i