Correlation between QoS and QoE for HTTP YouTube content in Orange cellular networks St´ephanie Moteau
Fabrice Guillemin
Thierry Houdoin
Orange Labs 2 Avenue Pierre Marzin 22300 Lannion, France Email:
[email protected]
Orange Labs 2 Avenue Pierre Marzin 22300 Lannion, France Email:
[email protected]
Orange Labs 2 Avenue Pierre Marzin 22300 Lannion, France Email:
[email protected]
Abstract—We describe a “crowd measurement” project, referred to as PoQeMoN, whose main objective is to identify Quality of Service (QoS) indicators in order to predict the Quality of Experience (QoE) for HTTP YouTube content on mobile networks. Results are based on experiments on an operational network. The second contribution of this paper is to show that the proposed indicator is easy to implement in order to predict the quality that network operators really delivered to customers. Index Terms—YouTube, measurement, mobile, QoS, QoE, correlation.
I. I NTRODUCTION Quality of experience (QoE) is a key issue for actors offering services through the Internet, either Internet Service Providers or Over The Top players. A bad QoE can lead to customer churn and eventually alters revenues related to a service. This is why QoE is a very active research subject in the networking community. The major difficulty with this concept, however, is that a certain QoE level results from many heterogeneous factors, such as hot line responsiveness, service design (including the resolution) and many other subjective aspects specific to a given user. But QoE also depends on more technical parameters, notably the quality of service (QoS) characterized by packet loss, delay and jitter. QoS is related to the throughput achievable by the connections used for the transport of information from the server delivering the service and the user. Even if the proportion of QUIC transfers is rapidly increasing (e.g., 8 % in Orange cellular IP network in France in January 2017), TCP is still massively used as transport protocol for most services over the Internet today. The throughput of a TCP connection depends on the loss rate of packets, the Round Trip Time (RTT) and some technical parameters related to TCP. TCP throughput is not the only factor impacting QoE. Streaming applications represent 46 % of the global traffic volume in the Orange cellular data network in France, with half of it being YouTube traffic. For streaming application, the configuration of the player has a major impact on QoE. Adaptive Streaming, such as DASH, MSS or HAS, can adapt to bandwidth fluctuations in the network, notably in a mobile network where the bandwidth depends on the radio technology and on radio conditions. In both cases, the player implements an initial buffering delay mechanism to accumulate a sufficient amount of data before reading the reception buffer. This initial buffering is
intended to mask any degradation due to packet loss or bandwidth fluctuations. Sizing this initial buffering delay is critical: This delay must be sufficiently long to mask transfer impairments but also short in order to rapidly start viewing the video and thus prevent from user’s reneging. The QoS is characterized by some objective parameters such as packet loss, jitter, etc. that can be measured inside a network. However, the relation between QoS and QoE remains unclear in spite of a huge effort in the past decade (see for example [1], [2], [3]). The impact of player’s configuration, end-to-end transport protocol parameters, perception by the end users is out of the control of the network. Increasing the bandwidth inside the network is the default option adopted by network operators to improve QoE. The impact of residual loss and jitter on QoE is however still difficult to understand. In particular there are no simple criteria to roughly estimate the QoE of a video session via its QoS parameters. To remedy this situation, the PoQeMoN project has defined a crowd measurement platform. Users install an application on their smartphone which enables them to download YouTube videos. For each video session, the user can complete a survey form which is then uploaded to a server. By tracking the corresponding video flows inside the network and by measuring QoS parameters, it is then possible to use the various survey forms to correlate QoS and QoE. We describe in this paper the method developed during the PoQeMoN project and the most salient conclusions of this project with regard to the correlation between QoS and QoE. We also explore some extensions of these results. The organization of this paper is as follows: In Section II, we recall some previous work on QoS and QoE with special focus on YouTube traffic. In Section III, we describe the experimental setting. The analysis of data is performed in Section IV and some concluding remarks are presented in Section V. II. R ELATED WORK Up to the end of 2013, it was possible to observe YouTube traffic and associated characteristics for instance the occurrence of video files downloaded by end users. In [4], [5], some YouTube traffic measurements from Orange IP backbone network are reported. However, since the end of 2014 almost the whole of YouTube traffic is encrypted and is progressively
c 978-1-5386-2098-4/17/$31.00 2017 IEEE
moving on QUIC. This obfuscation of traffic has motivated the PoQeMoN project to use test traffic as explained in the next section. With regard to the correlation between QoS and QoE, the authors in [6] study the impact of some QoS indicators on the QoE for five services, including YouTube. Their results explain the link between network resources and the QoE expressed by users. In particular, overall quality, acceptance rate, video stalling, initial delay annoyance and video image quality are studied in details. The impact of the variation of the available bandwidth in the mobile network is also considered. Authors change network conditions in controlled environment and then collect the corresponding QoE, while in our study we go a step further by performing the correlation between QoS indicators and QoE to the field at a network scale. In [7], YouTube on mobile phone is studied in adaptive bit rate ABR streaming technology, which consists of switching between different encoding rate in order to obtain the higher quality possible regarding network conditions. Authors analyze the re-buffering ratio and the bitrate change ratio to quantify video abandonment rates. They assume that the viewing interruption represents the worst case in terms of QoE. By using some heuristics, they eliminate cases where the content itself is the cause of the abandonment due to the lack of interest. This study differs from ours by two points: First there is no survey in order to evaluate the QoE and next the YouTube delivery mechanism is different from the one used by our test traffic. Nevertheless, their conclusion is along the same lines as ours: A re-buffering event has a high impact on QoE. Mok et al in [8] have studied how network path quality impacts the QoE of HTTP video streaming. Their main finding is that the throughput of a video session is lowered by packet loss and RTT, thus increasing the rebuffering frequency. They also identified the rebuffering frequency to be the main factor responsible for the MOS variance. The authors in [9] discover a strong correlation between an increase in the delay for the video to start up and an increase in the rate at which viewers abandon the video. Their work is content provider and CDN oriented with a focus on viewer abandonment rates and repeated viewing in relation to streaming quality, last-mile connectivity, and video duration. Their data are collected from various networks: Cable (56%), DSL (22%), Fiber (14%) and Mobile (7%). However, none of the mentioned studies gives a means of predicting the QoE based on QoS neither at the network scale nor in real time. III. E XPERIMENTAL SETTING AND DATA ANALYSIS A. Experiment In the following, we analyze YouTube streaming traffic on mobile networks since this application is massively used by end users (about 40% of the whole of streaming traffic in volume and representing 16% of global traffic in volume per day in the French mobile network of Orange). The open source VLC media player has been used to perform QoS indicator measurement in mobile phones. A second source
of QoS indicators is the set of probes deployed in Orange’s mobile network. To complete the experiment, a survey is automatically sent after content viewing in order to collect the QoE perceived by end users. The main motivation of the experiment is to design simple methods allowing operators to better understand the quality of experience they really deliver to users. The goal is then to implement such methods in reliable and cost-efficient tools that can be used for audit campaign (coverage, troubleshooting and benchmark). This requires building and processing the relation between the QoE and QoS in mobile networks. We describe in this paper such a method for HTTP YouTube content in mobile network when progressive download is used. B. Data sets Three kinds of data are considered in this paper: Two data sets are used to evaluate the QoS and one to estimate the QoE. Our approach is based on a mobile application for viewing YouTube contents. The first data set related to QoS is generated by the open source VLC media player installed on mobile phones. For the experiment, we have fixed the initial buffering delay equal to 2 seconds, since it is a good trade-off between the waiting time before start of the video (near real time) and the buffer efficiency. In general, the initial buffering size varies according to the mobile phone, the OS and the player. This choice could have a major impact on the QoE: On the one hand a too long buffering delay could cause user impatience resulting in reneging and a bad QoE, and on the other hand a too small buffering delay could not mask the network impairments (for instance, packets losses or large fluctuations of delay, especially in mobile networks). For more results on the impact of the playout buffer, see [10] and [11]. In our experiment, the initial buffering is managed and controlled by our implementation in VLC to focus on the correlation between QoS and QoE. Probes in Orange cellular network are the second means of generating QoS indicators at the IP level. They capture IP and TCP headers and anonymize these fields so that the end user cannot be identified. Nevertheless, a specific module is used on the fly to keep the consistency between the TCP session and the other sources of data. Those probes can also capture an offset of the payload. They are used in the present experiment to observe test traffic only. To collect the QoE perceived by end users, a survey of five questions is automatically sent after the 60 seconds videos. For each question, five answers are proposed. For example, for the question “Speed of video launch”, users have to choose between “Very fast”, “Fast”, “Acceptable”, “Slow” and “Very slow”. Then the analysis is performed on the basis of the associated IP flows, VLC indicators and the collected QoE. C. Test campaigns Two test campaigns took place in our experiment in 2015 and 2016. The first campaign was initiated to calibrate the tools and had been performed in a controlled environment
(namely with students in classrooms). The second campaign was more representative of real operational conditions with mobility and people from all ages and socio-professional categories (used to see video over Internet or not, tech-savvy or not, ...). After the study, it appears that no differences in the perceived quality exist between women and men, and the age of testers is not a differentiating criterion neither. For our study, we finally consider more than 2700 sessions, with people from 10 to 69 years old and 46 mobile phone types. The contents proposed to users in the framework of the experiment are YouTube videos with a duration of 60 seconds. These videos are from a managed list in order to know all their characteristics in advance (video coding, audio coding ...). As the type of content has an impact on the QoE, different types of video are proposed: news, sport, movie, cartoon, documentary and concert. The contents are the same as those considered in [12], which can be looked up for more details. When a user launches the application, an initial survey is sent to collect personal data: age, gender, level of qualification and familiarity with the viewing of videos over the Internet. Then the list of available contents appears and the user selects one of them. At the end of the viewing, a second survey collects the user perception. Five questions are asked regarding the initial delay of buffering, the shift between the audio and the picture, the quality of the video, the quality of the audio and the quality of the picture. For every question, five answers are proposed to create a value scale. This method is equivalent to the Mean Opinion Score used for the evaluation of the QoE for audio services, see the ITU recommendation [13] for more details. Once the user has completed the survey, his responses and VLC indicators are sent to a data base. IV. A NALYSIS OF SESSION CHARACTERISTICS A. Experimental results In Table I, we give some examples of results obtained in the two campaigns described in the previous section. The first column gives a unique session identifier, from the second to the sixth column (Q1, Q2, Q3, Q4 and Q5) are reported the user responses (worse experience is indicated by the value 1 and the best by 5), from the seventh to the ninth column we have the network indicators and the other columns represent the VLC indicators. The buffering count is at least 1 because of the initial buffering. A session classification is made according to the QoE, VLC indicators and network QoS indicators by creating four session classes, represented by a color. Green sessions are those sessions with good indicators (network, VLC and QoE). White sessions have bad VLC indicators, good network indicators and good QoE. Purple sessions are with bad network indicators, good VLC indicators and good QoE. Red sessions are with bad indicators (network, VLC and QoE). First, it is interesting to understand the difference between values of the two QoS sources and second, to correlate these indicators with the QoE. The first analysis is done on bit rates with a mean value (about 500 kbit/s) and a cumulative volume
per second similar between classes. In this specific case, the bit rate is not relevant for separating classes nor predicting the QoE. The terminal used by users is the second studied criteria but as the first one, it is not relevant. In fact, the repartition of tests between terminals is the same among the four classes: the terminal is not an indicator for the correlation between QoS and QoE in our data set. Hence, a third analysis is made on the sequence number evolution of TCP flows. This analysis is based on network view, i.e., performed with traffic traces produced by probes at the IP level in the mobile network. This point is developed in the following section. B. Analysis of traffic traces In the following, a dichotomy is made between ”good” and ”bad” indicators. QoE indicators are called ”good” if the mean between the five scores is equal or higher than 3 and ”bad” otherwise. Network indicators are named ”good” if no IP packet is lost and ”bad” if the count of IP packet loss is equal or higher to one. VLC indicators are defined as ”good” is there is no picture loss, no audio loss and a buffering count equal to 1; there are ”bad” if one of this condition is not reached.
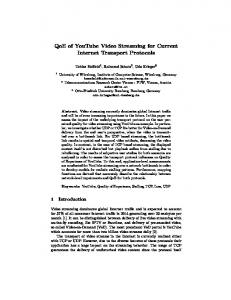
Fig. 1. Examples of red sessions
1) Red sessions: This section presents the analysis of sessions with QoE, network and VLC indicators bad. These sessions are important to correlate the QoS and the QoE. Note that they are distributed among the videos. Figure 1 presents the evolution of the TCP sequence number for two red sessions, which is equivalent to the amount of data delivered per unit of time. Both examples exhibit long silent periods during the content transfer. It is the case for all red sessions (292 sessions were analyzed during the experiment). Those pauses in the data transmission have values between 1 second and 5 seconds, to be compared with the 2s of initial buffering. All these tests suffer from picture starvation seen by the user as a black screen or at least frozen pictures. As we can see with the user surveys, this picture starvation or freezing directly impacts the quality of experience and leads to user annoyance. We can notice that the TCP duration of these red sessions is significantly higher than the content duration (of 60 s), see Table I. A surprising aspect of such session is that there are only a few packets loss even if quality of experience is very bad. The cause of the pause in data transmission for all red session is illustrated in Figure 2, with a zoom from 19s to
id 431 432 433 443 447 449 464 484 487 497 499 503
Q1 3 4 4 1 4 4 4 1 3 2 4 4
QoE survey Q2 Q3 Q4 5 5 5 1 5 5 5 1 4 1 5 4
5 4 4 3 5 5 5 1 4 1 4 4
5 4 4 1 5 5 5 1 4 1 4 4
Q5 5 4 4 3 5 5 5 4 3 3 5 5
Network indicators TCP duration IP Packet Mean bitrate (s) loss (kbit/s) 61.839 0 532 60.829 0 576 61.459 19 851 81.963 14 349 61.596 0 660 61.639 110 395 61.559 0 721 101.07 30 375 61.374 0 424 89.391 16 573 61.648 6 403 61.760 0 673 TABLE I S OME EXAMPLES OF TEST RESULTS
Input bitrate (kbit/s) 729 560 412 425 578 71 658 454 299 1151 383 397
VLC indicators Lost Lost pictures audio 0 0 1 0 0 0 1 3 0 0 0 0 0 0 1 1 0 0 1 6 0 0 1 0
Buffering count 1 1 1 2 1 1 2 4 1 2 1 2
30s on session 443 (the session illustrated in the left hand side of Figure 1). The green curve is the evolution of ACK number in upstream direction and the red one is the evolution of the sequence number in downstream direction as in Figure 1. We can see that there are no ACKs between 20.05s and 27.9s, resulting in a waiting mode for the server. We are here in a case where the quality of the uplink in the mobile network is clearly bad. Either the terminal has no allocated bandwidth or ACKs are lost due to radio conditions. Fig. 3. Examples of green sessions
D. Purple sessions
Fig. 2. Illustration of break cause in red session
Figure 4 represents examples of purple sessions (584 sessions in total were studied), defined by good QoE, good VLC indicators and some bad network indicators. For more readability, zooms are made on network events (packet loss). As we can see, there are some network events (packet losses or pauses) but they are spread in the flow and not numerous enough to be perceived by the user. For example, session 449 depicted in the right hand side of Figure 4(b) has two packets losses (at time 16.81 seconds and 18.02 seconds) and two pauses of 1.2 second started at 15.41 seconds and 0.7 second started at 17.05 seconds. We recall that the player’s buffer length is 2s. As the QoE is good for all sessions of this class, we can claim that the buffer performs well for the purple sessions, i.e., it masks network impairments.
C. Green sessions
E. White sessions
Now, we analyze those sessions with indicators all good. Like in the section IV-B1, we represent in Figure 3 the evolution of the TCP sequence number for two representative examples of such sessions. 222 sessions were classified as green and analyzed. From Figure 3, we can observe that for green sessions there is no packet loss and no pause in the data transmission. The initial buffering is performed in less than 1.5 second characterized by a high data transmission in the first step. Furthermore, one can observe that the rate of data transmission is then linear until the session ends and in particular there is no burst of packets.
In this section, we analyze the last session class. It corresponds to sessions with good QoE, good network indicators and bad VLC indicators. Two examples are given in Figure 5 and they are representative of the 1,606 analyzed white sessions. From the network view, white sessions are not different from green sessions. Once the initial buffer is full, data arrive at a linear rate. If we do not take into account VLC indicators, only one class made of sessions with good QoE and good network indicators will be created. VLC indicators report that the session with id 432 has lost a picture at the application level, as depicted in Table I. If this were true, the IP level analysis would have showed some
’Good’ sessions (green sessions) Sessions with network events e.g, packet loss (purple sessions) Sessions with VLC events (white sessions) ’Bad’ sessions e.g, re-buffering (red sessions)
QoE
VLC indicators
Network QoS indicators
% of flows
Learning
OK
OK
OK
8.2%
OK
OK
KO
21.6%
OK
KO
OK
59.4%
illustration of wrong VLC indicators
KO
KO
KO
10.8%
long breaks in data transmission are experienced by users. When it occurs, the play out buffer empties and a picture starvation happens causing user annoyance
the data transmission rate is linear and in particular there are no bursts of data, contrary to what one can expect when using TCP the play out buffer is performing well! Sessions could have some packet losses or some short breaks in data transmission without impacting user’s experience
TABLE II S ESSIONS CHARACTERISTICS
(a) Whole sessions
(such as VLC) are not always accurate. Another example is the case of a session given by VLC with an input bit rate of 71 kbit/s with a good QoE survey, but with a bit rate at about 350 kbit/s estimated from the network. The input bit rate given by VLC is hence erroneous. It is not obvious to identify why in few cases VLC indicators are sometimes erroneous. It is hence utmost important to emphasize the inaccuracy of tools embedded for developers, which should then handle with care this kind of information. F. Summary and learning
(b) Zoom on network events Fig. 4. Examples of purple sessions
Fig. 5. Examples of white sessions
packet loss. But this is not the case. The session with id 464 is assumed by VLC to have a re-buffering as mentioned in Table I line 9. If it were really the case, this should be outlined in Figure 5 with a break in data transmission. For both examples, the IP level analysis does not validate VLC indicators. During the two test campaigns, it clearly appeared that some QoS indicators given by tools embedded in mobile phones
In Table II, we summarize sessions characteristics according to the four classes and we report some learning. A point to notice is that 89.2% of sessions have a good QoE. It has also been observed that once the initial buffer is full, Google performs a “just in time” delivery of HTTP YouTube content on mobile networks. In particular, there are no bursts of data and flows have medium bitrates (a mean about 500 kbit/s). One salient conclusion of the analyses performed during this study is that the way the content provider delivers content has a major impact on QoE. For HTTP YouTube videos, Google adopts a “just-in-time” scheme, which has the advantage of eliminating burst of data in the network (almost constant bit rate scheme) but makes the delivery more fragile since packets have to arrive at due time to prevent any playout buffer starvation; a single packet or ACK loss can have a major impact on the perceived QoE. The impact of network uplink is highlighted by the fact that a single loss can lead to a bad session (Figure 2). Sessions having a linear data transmission with rare interruptions have a good QoE (as shown in the Figure 3, 4 and 5). If the content duration is known, the TCP duration is a good indicator: if this duration is close to the content duration (less than 2s of difference), then we claim that the QoE is good. If the difference is greater, then a picture starvation or freezing occurs causing user annoyance and resulting in a bad QoE. But in general, we do not know the content duration, a simple way of predicting QoE when networks indicators are available is then to emulate the state of the playout buffer. If the buffer does not empty during the session the QoE will be good and if
a starvation occurs the QoE will be bad. Another advantage of this method is that we are able to predict the QoE in real time (i.e on the fly during the session) and at the network scale (i.e for all users). G. Limitations of the study Our study is based on data collected at the end of 2015 and at the beginning of 2016. Since this period, new protocols have been deployed for YouTube content on mobile phones like QUIC (a multiplexed stream transport over UDP and encrypted), or like SPDY (it adds a session layer atop of SSL that allows for multiple concurrent, interleaved streams over a single TCP connection) and encrypted HTTP 1.1 is more and more used. In Figure 6, we depicted the behavior of a content session in encrypted HTTP 1.1 protocol.
Fig. 6. Example of a content session in encrypted HTTP 1.1
A content download session is now composed of several TCP sessions. As shown in Figure 6, for a specific YouTube content, there are 3 TCP sessions. These TCP sessions have the same source and destination IP addresses, the same source port (443 as it is encrypted) and the only difference is in the destination port. Even if it does not clearly appear in this figure, all TCP sessions start within a time interval of less than 1 second. For the time being, the destination ports of the TCP sessions that correspond to a single content session are close to each other (in the example we have the values of 34641, 34642 and 34647). It is hence possible to reassemble the TCP sessions (same IP addresses, source port 443, starting within a 1 second interval and with destination port numbers that follow each other) to reconstruct the content session. This is the case in the Figure 6 where the red session corresponds to the YouTube session composed of green, blue and pink TCP sessions. We can notice that with encrypted HTTP 1.1 we have a behavior different from those in our experiments. Here, we have bursts of data interleaved with idle periods. Once the ”session” is reconstructed, we can emulate the reception buffer of the player and check if the buffer empties or not. The leak rate of this emulated buffer has to be estimated in order to reflect the bit rate of the video. A simple
adaptive scheme could be used to estimate the bit rate of the video. Once this is performed, the method of correlating QoS and QoE for YouTube content on mobile networks could be applied. Further investigations are necessary to validate this approach. V. C ONCLUSION We have implemented for the first time in France a collaborative approach to network traffic metrology. Users run some tests and report their results (including subjective ones) on servers which are then used to estimate the offered quality of experience on the French mobile network of Orange. This collaborative framework between users, network operator, service providers and test agencies is an innovative method of sharing between all actors a vision of quality. This end-toend approach requires user collaboration but works with every content, every protocol, encrypted or not. This is important because as for today most contents are encrypted and moreover new transports protocols like QUIC (introduced by Google) also hinder basic QoS measurements like packet loss. Thus ”crowd measurement” would restore this lost equilibrium between all actors. ACKNOWLEDGMENTS This work has been funded by Orange in the framework of the French cooperative project “Platform for Quality Evaluation of Mobile Networks”, Pˆole de Comp´etitivit´e Systematic (FUI 16). R EFERENCES [1] T. H. Markus Fiedler and P. Tran-Gia, “A Generic Quantitative Relationship between Quality of Experience and Quality of Service,” IEEE Network, 24(2):3641, 2010. [2] H. J. Kim, D. H. Lee, J. M. Lee, K. H. Lee, W. Lyu, and S.-G. Choi, “The QoE Evaluation Method through the QoS-QoE Correlation Model,” Networked Computing and Advanced Information Management, 2008. [3] P. Orosz, T. Skopk, Z. Nagy, P. Varga, and L. Gyimthi, “A Case Sudy on Correlating Video QoS and QoE,” Network Operations and Management Symposium, 2014. [4] F. Guillemin, T. Houdoin, and S. Moteau, “Volatility of YouTube content in Orange networks and consequences,” IEEE International Conference on Communications, 2013. [5] F. Guillemin, B. Kauffmann, S. Moteau, and A. Simonian, “Experimental analysis of caching efficiency for youtube traffic in an ISP network,” in 25th International Teletraffic Congress, ITC 2013, Shanghai, China, September 10-12, 2013, 2013, pp. 1–9. [6] P. Casas, M. Seufert, F. Wamser, B. Gardlo, A. Sackl, and R. Schatz, “Next to You: Monitoring Quality of Experience in Cellular Networks From the End-Devices,” IEEE Transactions on Network and Service Management, 2016. [7] H. Nam, K.-H. Kim, and H. Schulzrinne, “QoE Matters More Than QoS: Why People Stop Watching Cat Videos,” IEEE INFOCOM, 2016. [8] R. K. P. Mok, E. W. Chan, and R. K. C. Chang, “Measuring the Quality of Experience of HTTP Video Streaming,” IFIP/IEEE International Symposium on Integrated Network Management, 2011. [9] S. S. Krishnan and R. K. Sitaramann, “Video Stream Quality Impacts Viewer Behavior: Inferring Causality Using Quasi-Experimental Designs,” Internet Measurement Conference, 2012. [10] F. Yu, H. Chen, L. Xie, and J. Li, “Impact of End-user Playout Buffer Dynamics on HTTP Progressive Video QoE in Wireless Networks,” IEEE Personal, Indoor and Mobile Radio Communication, 2014. [11] T.Hossfeld, S.Egger, R.Schatz, M.Fiedler, K.Masuch, and C.Lorentzen, “Initial delay vs. interruptions: between the devil and the deep blue sea,” Quality of Multimedia Experience, 2012. [12] L. Amour, S. Sami, S. Hoceini, and A. Mellouk, “Building a large dataset for model-based QoE prediction in the mobile environment,” Modeling, Analysis and Simulation of Wireless and Mobile Systems, 2015. [13] “https://www.itu.int/rec/t-rec-p.800.1-201607-i/en,” ITU P.800.