TAO, Vol. 16, No. 2, 435-443, June 2005
Correlation Dimension and Its Temporal Variations in Geomagnetic Total Field During Storms Chien-Chih Chen1, 2, *, Yu-Jung Chuo3, Fang-Lin Wang2, Horng-Yuan Yen1,2 and Chieh-Hung Chen1
(Manuscript received 16 March 2004, in final form 31 March 2005)
ABSTRACT Correlation-dimension analysis is often used to quantify the dynamics of the obscure attractor from the measured time series. Specifically, the method of sliding-window correlation-dimension is used to detect the temporal changes of the number of controlling parameters in a dynamical process, for example, geomagnetic fluctuation through time. By means of sliding-window correlation-dimension analyses of total-field fluctuations at three geomagnetic ground stations in Taiwan, a decrease in correlation dimension during storms has been confirmed in this paper. Such a decrease in the correlation dimension strongly indicates shrinking of phase space in the geomagnetic dynamical system, while the hidden, degenerated state variable remains inconclusive and more work is needed to address this issue. (Key words: Correlation dimension, Fractals, Magnetic storms)
1. INTRODUCTION Since the emergence of the concept of nonlinear dynamics in the 1970s, the idea of geomagnetic attractor is no longer fanciful. Fluctuation in the geomagnetic field has recently been considered a nonlinear dynamical phenomenon (e.g., Vassiliadis et. al. 1990; Shan et. al. 1991; Roberts et. al. 1991; Prichard and Price 1992; Sharma et. al. 1993; Takalo et. al. 1993; Takalo et. al. 1995; Sitnov et. al. 2000). Vassiliadis et al. (1990) and Shan et al. (1991) carried out correlation-dimension analyses of their own data using two different time sequences of the
1
Institute of Geophysics, National Central University, Chung-Li, Taiwan, ROC
2
Department of Earth Sciences, National Central University, Chung-Li, Taiwan, ROC
3
Department of Information Management, Ling-Tung College, Tai-Chung, Taiwan, ROC
* Corresponding author address:
Prof. Chien-Chih Chen, Institute of Geophysics, National Central University, Chung-Li, Taiwan, ROC; E-mail:
[email protected]
435
436
TAO, Vol. 16, No. 2, June 2005
geomagnetic auroral electrojet AE index, a measure of overall geomagnetic activity in the auroral region derived from ground station measurements of north-south magnetic field components, and finally presented two different correlation dimensions of the AE index, i.e., 3.6 for the former and 2.4 for the latter. In contrast to the AE index, Roberts et al. (1991) used a data set containing 40,000 values of the western auroral electrojet AL index with the sampling interval of 2.5 minutes. They extracted several relatively quiet segments of 1,000 data points from the raw time series compiled by Bargatze et al. (1985), and found a correlation dimension of 4.0 for AL data, which is higher than the estimates of Vassiliadis et al. (1990) and Shan et al. (1991). Although there is significant disagreement on the exact value of the correlation dimension for the underlying system, those researches mentioned above seem to agree that the dimension of geomagnetic fluctuation is low. Thus a low-dimensional attractor-like representation of the Earth’s magnetospheric system becomes possible. On the other hand, Prichard and Price (1992) also presented evidence against the presence of low dimensional chaos indeed. A review of the debates associated with dimensionality for geomagnetic activity can be found in Klimas et al. (1996). Whatever the case, the recognition of a low-dimension attractor from geomagnetic fluctuation is essential to the reconstruction of the system’s dynamics. With appropriate variables chosen, the techniques for the construction of equations of motion (e.g., Crutchfield and McNamara 1987) can then be used to build a model with comparable phase space to one reconstructed from the observed data. Very recently, Sitnov et al. (2000) proposed a hybrid catastrophe model of a magnetospheric substorm (Smith et. al. 1986; Goertz and Smith 1989) that behaves like a nonequilibrium phase transition with features of both first- and second-order phase transitions. They have found that the effective dimension of a dynamical magnetospheric system degenerates during substorms and, based on their singular spectrum analysis, dynamic trajectory lies on a twodimensional surface in the three-dimensional space of the main eigenvectors. In this case, while the actual dimension associated with a substorm or storm is still a subject of debate (Klimas et. al. 1996), it is worth considering if it is possible to observe the temporal variation in the correlation dimension of the geomagnetic system during a storm. Interestingly, the change of a related fractal dimension, that being Hurst’s exponent, during a substorm has already been successfully observed by Uritsky and Pudovkin (1998). This issue relating to the correlation dimension of a storm is further explored in our present work by applying sliding-window correlation-dimension analysis to geomagnetic total-field data at three ground stations in Taiwan. A discussion relating to some of the relevant physical problems in the magnetospheric dynamics will also be provided at the end of this paper.
2. SLIDING-WINDOW CORRELATION-DIMENSION ANALYSIS Correlation-dimension analysis (Grassberger and Procaccia 1983) is a powerful tool for determining the number of effective degrees of freedom, or dimension, in a single-value time series of a chaotic system with a low-dimensional attractor. Such analysis is sensitive to the dynamical processes of coverage of the attractor shown by the system. Correlation-dimension
Chen et al.
437
v analysis requires transformation of a time series x(t) into a set of m-dimensional vectors Xi (i = 1, ..., N) lying in the so-called “embedding space”. Embedding space is a reconstructed phase space that is used to cover the attractor of the dynamical system. Grassberger and Procaccia (1983) define the correlation integral C(r) as: C( r) =
N v v 1 N 1 ∑ ∑ Θ( r − Xi − X j ) , N i=1 N − 1 i=1, j ≠1
where Θ is the Heaviside function and • is the Euclidean norm. For large embedding dimension m and the small correlation distance r, they showed that a power-law relation between C(r) and r holds true when a strange attractor of the dynamical system exists. In practice, one usually estimates the exponent of the power-law relation for different embedding spaces with various dimensions and the estimated exponent saturates as the embedding space enlarges, i.e., m increases. This saturation exponent is considered a best estimate of the correlation dimension D for the dynamical system. However, a white noise process, in which no attractor exists, could never be involved in an embedding space with a finite dimension m and, therefore, would not produce a saturated exponent. As to evaluating variations in the correlation dimension at different time intervals of geomagnetic fluctuation, the sliding-window technique (Prokoph 1999) has been used on our geomagnetic data. If the system is approximately stationary over many relatively short intervals, it is possible to determine the dimension by using many small data sets spanning only a small time interval (Havstad and Ehlers 1989). On the other hand, the sliding-window algorithm is also used to detect the non-stationary process that is wrapped in a long record. A distinctive analysis window with size less than the total data length is shifted over the whole data set (Prokoph 1999). The number of data points for adequately resolving the system’s dimension is crucial to correlation dimension analysis (Shan et. al. 1991; Essex 1991) and it is usually case dependant (e.g., Shan et. al. 1991; Roberts et. al. 1991; Prichard and Price 1992; Prokoph 1999). In our calculation, we have examined results from utilizing various window sizes and obtained a robust estimate of the correlation dimension by choosing a window size of about 800 data points.
3. RESULTS AND VARIATIONS IN CORRELATION DIMENSION OF TOTALFIELD FLUCTUATION A geomagnetic network for continuous observation of the intensity of geomagnetic total field has been established in Taiwan since 1988, by the Institute of Earth Sciences, Academia Sinica (Yen et. al. 2004). Proton total-field magnetometers (Geometric Model G-856 with a sensitivity of 0.1 nT) have been positioned at eight ground stations. For our correlation-dimension analysis, we chose total-field data from January 2000 at three stations, i.e., Hengchun (HC) of 120.80°E & 21.94°N, Yuli (YL) of 121.29°E & 23.35°N and Lunping (LP) of 121.17°E & 25.00°N. Sampling intervals are five minutes at the LP station and ten minutes for the other
438
TAO, Vol. 16, No. 2, June 2005
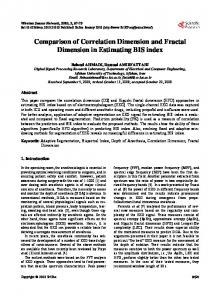
two. It should be noted that our calculation is conducted directly using total-field data instead of AE, AL or other derived geomagnetic indices, e.g., Dst, cf. Vassiliadis et al. (1990), Shan et al. (1991), Prichard and Price (1992) and Takalo et al. (1995). When conducting the correlation-dimension analysis, the choice of a time-lag parameter is critical for the quality of the reconstruction of embedding space. If the lag time is too short, the data will be redundant. If too long, adjacent data points will be irrelevant. Thus, the choice of the time-lag parameter should be large enough to overcome the autocorrelation effect (Sharma et. al. 1993) and small enough to resolve the physical processes of interest. In our case, a strong correlation between adjacent data points appears when smaller delay times of less than 60 minutes are utilized (Fig. 1). Moreover, a strategy based on the decay of the autocorrelation function of determining the time-lag parameter (Shan et. al. 1991) also suggests a delay time with 60 minutes is appropriate to our data. It seems meaningful that such an interval is compa-
Fig. 1. (a) Total-field data with a sampling interval of 10 minutes at site HC and phase points of the reconstructed embedding spaces with a delay time = (b) 10 minutes, (c) 30 minutes, and (d) 60 minutes. Strong autocorrelation effect could be found when delay times are chosen to be small in (b) and (c). The unit of magnetic field intensity is nT.
Chen et al.
439
rable to those reported previously, for example, 50 minutes in Shan et al. (1991) and in Roberts et al. (1991). As a result, we chose a time-lag parameter of 60 minutes for our correlation dimension analysis. Figure 2 shows the results of our sliding-window correlation-dimension analysis of totalfield fluctuations for three ground stations HC (Fig. 2a), YL (Fig. 2b) and LP (Fig. 2c). The correlation dimension, in general, saturates quickly when the dimensionality of embedding space is larger than 4-dimension. The saturation dimension is around 3.0 overall for the three stations. Previous studies have published varying correlation-dimension figures for the geomagnetic system, from the 2.4 of Shan et al. (1991) to the 4.0 of Roberts et al. (1991), as we have mentioned before. Given previous results, we consider our result as a plausible calculation, and propose D = 3.0 as another reference value for the correlation dimension of the Earth’s magnetic process. We leave its exact value beyond the scope of this study, and concentrate our attention on changes in the correlation dimension during storms. The most important features of Fig. 2 are two distinct depressions in the correlation dimension that may relate to two issued storms on January 11 and 22 of 2000, according to the equatorial Dst indices of the WDC-C2 database (Kyoto University 2000). If we think some bias out, existing uniformly in our correlation-dimension calculation, the difference in D between the normal days and the storms is a fair estimation and approaches approximately to 1. This implies one disappeared state variable (e.g., Vassiliadis et. al. 1990) or one additional physical constraint (e.g., Sitnov et. al. 2000) coming up during a storm. One source of bias in calculating the correlation-dimension is temporal correlation in the phase space. Pairs of points measured within a relatively short time span tend to be close in phase space as well and thus introduce a bias when we estimate the correlation sum from the definition. To tackle the problem of such a temporal correlation, Theiler (1986) proposed a practical technique by rejecting close pairs in time and a safe length for the Theiler window could be estimated by the method of space-time separation (Provenzale et. al. 1992). Two subsets of geomagnetic data with different geomagnetic activity levels at station HC were chosen for examining the decreased dimension during a storm. Figure 3 shows the results of applying a Theiler window of 60 minutes in correlation-dimension analysis. A decrement of about 1 for the correlation dimension verifies our previous computation.
4. CONCLUDING REMARKS AND DISCUSSIONS Geomagnetospheric dynamics is a great complex system. Sliding-window correlationdimension analysis has been used as a method for detecting temporal changes in the effective number of control parameters in the geomagnetic dynamical process. A decrease in the correlation dimension of geomagnetic total-field fluctuation during storms has been confirmed in this study and implies the disappearance of some degree of freedom. This result may be related to a recent result obtained from the singular spectrum analysis proposed by Sitnov et al. (2000); however, our study is chiefly concerned with storm, rather than substorm as discussed in Sitnov et al. (2000). Yet, it is well-known that, when the Interplanetary Magnetic Field (the Sun’s magnetic field) turns southward, a magnetospheric storm occurs and makes the field line
440
TAO, Vol. 16, No. 2, June 2005
Fig. 2. Sliding-window correlation-dimension plots for the three geomagnetic stations: (a) HC, (b) YL, and (c) LP. The upper panel of each section shows raw records geomagnetic total-field data and the lower panel the results of correlation dimension calculation with various embedding space. For each calculation of correlation dimension the embedding spaces are enlarged from 2-dimension to 9-dimension (black: 2D; blue: 3D; red: 4D; green: 5D; purple: 6D; brown: 7D; cyan: 8D; yellow: 9D), and the correlation dimension saturates quickly for m larger than 4. While the correlation dimension for the geomagnetic field is around 3 overall, it is depressed by 1 during two issued storms on January 11 and 22. The unit of magnetic field intensity is nT.
Chen et al.
441
Fig. 3. Estimation of correlation dimension with a Theiler window of 60 minutes for two subsets of geomagnetic data at HC. Correlation dimension saturates for embedding dimension larger than 6. A decrement of about 1 between the normal days and the storm is also apparent. For reference, the expected correlation dimension of a random process is shown in the dash line. reconnection in the magnetospheric tail. Such a reconnection process produces substorms in the auroral zone. While Sitnov et al. (2000) figured out the AL index and claimed that the substorm process is analogue to a non-equilibrium phase transition accompanied by degenerated dimension in the magnetospheric system, in this study we propose a similar effect, dimension shrink, for the magnetic storm through sliding-window correlation-dimension analysis. Recently, many investigations have proposed that the existence of a multifractal structure in the AE signal is the signature of temporal inhomogeneity and the occurrence of time intermittency in the magnetospheric dynamics (Consolini et. al. 1996, Consolini and Michelis 1998). While temporal inhomogeneity in AE index data might be related to variation in the effective dimension of the geomagnetic system at high latitude, we have shown variation of the effective dimension at low latitude.
442
TAO, Vol. 16, No. 2, June 2005
While this study only considers the temporal inhomogeneity in the output signal of an input-output system it should be reasonable to model the dynamics of the magnetosphere as an input-output system (Prichard and Price 1992). But, before conducting sophisticated modeling, it would be helpful to investigate some essential properties regardless of output or input signals. Modeling is a creative task quite different to the computation of a single number (such as a dimension) for a given signal. Dimension, Lyapunov exponent, etc., are ways of quantifying the properties of a signal. Each of these concepts is one of very many ways of turning a sequence of data into a single number. The dimension computation can enhance our knowledge of the underlying system. We are still a long way from concluding a method for connecting a physical, observable measurement for the state variable in phase space reconstruction (e.g., Crutchfield and McNamara 1987) or the controlling order parameter in phase transition theory (e.g., Sitnov et. al. 2000). As Sitnov et al. (2000) mention, “neither control parameter in a cusp catastrophe model of substorm can be directly connected with the parameter in the singular spectrum analysis”. It appears more work is needed to address which physical variable degenerates during a magnetic storm as has been strongly indicated by our sliding-window correlationdimension analysis of the geomagnetic system. Acknowledgements This work was supported by Department of Earth Sciences, NCU, and by the research grant NSC 93-2119-M-008-017 from National Science Council, ROC. FLW thanks NSC for their support to the undergraduate-joined project NSC 91-2815-C-008-022M. Authors thank Prof. Andrew T. S. Lin for his correction in English usage. Thanks are also extended to Dr. Lun-Tao Tong and one anonymous reviewer for their suggestions to our early manuscript.
REFERENCES Bargatze, L. F., D. N. Baker, L. R. McPherron, and E. W. Jr. Hones, 1985: Magnetospheric impulse response for many levels of geomagnetic activity. J. Geophys. Res., 90, 63876394. Consolini, G., M. F. Marcucci, and M. Candidi, 1996: Multifractal structure of auroral electrojet index data. Phys. Rev. Lett., 76, 4082-4085. Consolini, G., and P. D. Michelis, 1998: Non-Gaussian distribution function of AE-index fluctuations: evidence for time intermittency. Geophys. Res. Letts., 25, 4087-4090. Crutchfield, J. P., and B. S. McNamara, 1987: Equations of motion from a data series. Complex Sys., 1, 417-452. Essex, C., 1991: Correlation dimension and data sample size. In: Schertzer, D., and S. Lovejoy (Eds.), Non-linear variability in geophysics, scaling and fractals, Kluwer, Dordrecht, 93-98. Goertz, C. K., and R. A.Smith, 1989: The thermal catastrophe model of substorms. J. Geophys. Res., 94, 6581.
Chen et al.
443
Grassberger, P., and I. Procaccia, 1983: Characterization of strange attractors. Phys. Rev. Lett., 50, 346-349. Havstad, J. W., and C. L. Ehlers, 1989: Attractor dimension of nonstationary dynamical systems from small data sets. Phys. Rev. A, 39, 845-853. Klimas, A. J., D. Vassiliadis, D. N. Baker, and D. A. Roberts, 1996: The organized nonlinear dynamics of the magnetosphere. J. Geophys. Res., 101, 13089. Kyoto University, 2000: WDC-C2 for geomagnetism: hourly values of equatorial Dst indexJanuary 2000. http://swdcdb.kugi.kyoto-u.ac.jp. Prichard, D., and C. P. Price, 1992: Spurious dimension estimates from time series of geomagnetic indices. Geophys. Res. Letts., 19, 1623-1626. Prokoph, A., 1999: Fractal, multifractal and sliding window correlation dimension analysis of sedimentary time series. Comput. Geosci., 25, 1009-1021. Provenzale, A., L. A. Smith, R. Vio, and G. Murante, 1992: Distinguishing between lowdimensional dynamics and randomness in measured time series. Physica D, 58, 31. Roberts, D. A., D. N. Baker, A. J. Klimas, and L. F. Bargatze, 1991: Indications of low dimensionality in magnetospheric dynamics. Geophys. Res. Letts., 18, 151-154. Shan, L. H., P. Hansen, C. K. Goertz, and R. A. Smith, 1991: Chaotic appearance of the AE index. Geophys. Res. Letts., 18, 147-150. Sharma, A. S., D. Vassiliadis, and K. Papadopoulos, 1993: Reconstruction of low-dimensional magnetospheric dynamics by singular spectrum analysis. Geophys. Res. Letts., 20, 335-338. Sitnov, M. I., A. S. Sharma, K. Papadopoulos, D. Vassiliadis, J. A. Valdivia, A. J. Klimas, and D. N. Baker, 2000: Phase transition-like behavior of the magnetosphere during substorms. J. Geophys. Res., 105, 12955-12974. Smith, R. A., C. K. Goertz, and W. Grossmann, 1986: Thermal catastrophe in the plasma sheet boundary layer. Geophys. Res. Letts., 13, 1380-1383. Takalo, J., R. Lohikoski, and J. Timonen, 1995: Structure function as a tool in AE and Dst time series analysis. Geophys. Res. Letts., 22, 635-638. Takalo, J., J. Timonen, and H. Koskinen, 1993: Correlation dimension and affinity of AE data and bicolored noise. Geophys. Res. Letts., 20, 1527-1530. Theiler, J., 1986: Spurious dimension from correlation algorithm applied to limited timeseries data. Phys. Rev. A, 34, 2427-2432. Uritsky, V. M., and M. I. Pudovkin, 1998: Low frequency 1/f-like fluctuations of the AEindex as a possible manifestation of self-organized criticality in the magnetosphere. Annales Geophys., 16, 1580-1588. Vassiliadis, D. V., A. S. Sharma, T. E. Eastman, and K. Papadopoulos, 1990: Low-dimensional chaos in magnetospheric activity from AE time series. Geophys. Res. Letts., 17, 1841-1844. Yen, H. Y., C. H. Chen, Y. H. Yeh, J. Y. Liu, C. R. Lin, and Y. B. Tsai, 2004: Geomagnetic fluctuations during the 1999 Chi-Chi earthquake in Taiwan. Earth Planets Space, 56, 39-45.