Hindawi Advances in Materials Science and Engineering Volume 2017, Article ID 4953173, 11 pages https://doi.org/10.1155/2017/4953173
Research Article Correlation of Process Parameters with Mechanical Properties of Laser Sintered PA12 Parts Eva C. Hofland,1 Ismet Baran,2 and Dagmar A. Wismeijer3 1
Oceanz, Maxwellstraat 21, 6716 BX Ede, Netherlands Faculty of Engineering Technology, University of Twente, 7500 AE Enschede, Netherlands 3 TNO, Equipment of Additive Manufacturing, de Rondom 1, 5612 AP Eindhoven, Netherlands 2
Correspondence should be addressed to Ismet Baran;
[email protected] Received 7 November 2016; Revised 11 January 2017; Accepted 6 February 2017; Published 28 February 2017 Academic Editor: Gianluca Percoco Copyright © 2017 Eva C. Hofland et al. This is an open access article distributed under the Creative Commons Attribution License, which permits unrestricted use, distribution, and reproduction in any medium, provided the original work is properly cited. Selective laser sintering (SLS) is an additive manufacturing technique that enables the production of customized, complex products. SLS has proven itself a viable prototyping tool and production method for noncritical products. The industry has picked up on the potential of SLS, which raised the question whether it is possible to produce functional products with reproducible mechanical properties for application in critical sectors. Properties of SLS parts highly depend on the applied process settings. Hence, present work examined the influence of key process parameters (preheating temperature, laser power, scan spacing, scan speed, layer thickness, and part build orientation) on the properties (tensile strength, tensile modulus, elongation at break, and part density) of SLS produced parts. A design of experiments (DoE) approach was used to plan the experiments. Test samples according to DIN EN ISO 527-2 were produced on a sintering system (EOSINT P395) using polyamide 12 powder (EOS PA2200). Regression models that describe the relation between the process settings and resulting part properties were developed. Sensitivity analysis showed that mechanical properties of sintered parts were highly affected by layer thickness and scan spacing variations.
1. Introduction Selective laser sintering (SLS) is an additive manufacturing technique which uses a laser beam to locally melt polymer powder to build products in a layer by layer fashion. During the past years, laser sintering of polymers has developed and grown into a viable prototyping tool and production method for customized, noncritical products (e.g., figurines, phone cases, and jewellery). The industry has seen the potential of selective laser sintering, which raised the question whether it is possible to apply SLS to produce fully functional products with reproducible mechanical properties. SLS has the potential to become the number one choice for small series production of high strength polymer parts. Comparison between conventional injection moulding and SLS has shown that up to 1,000 parts SLS is more economical [1]. A schematic visualization of the SLS fabrication process and an overview of the production process are given in Figures 1 and 2. The important parameters that affect the energy input during sintering and thereby affect the resulting part
properties of the sintered products are laser power, scan speed, scan spacing, layer thickness, and preheating temperature. In addition to the energy related parameters, part build orientation has proven to have an important influence on the product quality as well. Caulfield et al. [2] investigated the effect of the energy input and the part build orientation on the mechanical behaviour of polyamide parts produced on a DTM Sinterstation. An increase in laser power resulted in an increase of the energy input, which was shown to have a positive effect on the apparent density of sintered parts. In turn, a high part density was correlated with high values for the mechanical properties of sintered parts (yield strength, tensile modulus, fracture strength, and elongation at break). However, the results of Caulfield et al. [2] indicated that an optimum energy input exists. Above a certain value, the increase of strength and stiffness flattens out or even decreases with increasing energy input. According to both Caulfield et al. [2] and Goodridge et al. [3] high laser power values can result in excess heat which can result in damaged or burnt
2
Advances in Materials Science and Engineering
Powder feeder
Laser scan system Heaters
Powder bed Sintered part
Recoater Powder container
Overflow bin
Build platform
z x y
Figure 1: Visualization of the SLS fabrication process.
3D model
Powder mixture
Model preparation
Machine preparation
Finished part
Fabrication
Cleaning
Postprocessing
Part positioning
Powder supply
Powder deposition
Cooling
Polishing
Slicing
Preheating
Preheating
Unpacking
Lacquering
Laser exposure
Cleaning
···
Assigning exposure parameters
Repositioning build platform
Figure 2: Schematic overview of the complete SLS production process.
powder, shear stresses between layers, and possible part distortion. A more extensive study using response surface modelling (RSM) to determine the correlation between process parameters and part properties in laser sintering was performed by Wegner and Witt [4]. Wegner and Witt [4] studied the effect of the laser power, scan spacing, scan speed, preheating temperature, and layer thickness on the tensile strength, tensile modulus, elongation at break, and part density of polyamide parts produced on a high-speed DTM Sinterstation. The scan spacing was varied between 0.25 mm and 0.45 mm and the scan speed varied between 5500 and 11000 mm/s This
study confirmed that there is indeed an optimum energy input: after a certain energy input value, the part properties stabilized or even decreased. In addition, Wegner and Witt [4] also confirm that there is a positive relation between the laser power and the part properties. However, based on the coefficients in the regression equations, the influence of the laser power was relatively small. More important parameters were found to be the scan spacing and layer thickness, which were not investigated by Caulfield et al. [2]. Negi et al. [5] performed both RSM and sensitivity analysis to investigate the effect of several process parameters (preheating temperature, laser power, scan speed, and scan
Advances in Materials Science and Engineering spacing) on the properties (tensile strength, elongation, yield strength, and tensile modulus) of glass filled polyamide parts produced with the SLS on an EOS sintering system. The scan speed varied between 2500 and 4500 mm/s. They found that all four parameters have a significant effect on the mechanical properties of sintered parts of which scan speed and scan spacing had the largest effect. Negi et al. [5] confirmed the results of Caulfield et al. [2] and Wegner and Witt [4] that the mechanical properties of sintered parts increase with an increase of laser power and preheating temperature and decrease with an increase in scan speed and scan spacing. The scan speed and scan spacing were found to have the largest (positive) effect on the properties, while the preheating temperature and laser power have a relatively small influence on the part properties. Similar results were found in Tontowi et al. [6] and Griessbach et al. [7]. They found that increasing the preheating temperature has a positive effect on the tensile properties and part density. It should be noted that Negi et al. [5] used a different material and did not include layer thickness and part build orientation. Pilipovi´c et al. [8] and Wegner and Witt [4] showed that the layer thickness has a very large influence on the part properties. An increase of layer thickness resulted in a decrease of the part density and the tensile properties and therefore recommend to strive for a layer thickness as thin as possible. Thinner layers, however, significantly increase total build time. Berretta et al. [9] recommended a minimal layer thickness of at least two times the average particle size. Ajoku et al. [10] found that parts built parallel to the layer orientation (0∘ ) had better tensile properties (higher tensile strength, Young’s modulus, and elongation at break) than parts built perpendicular to layer orientation (90∘ ). Caulfield et al. [2] found similar results. They concluded that the 90∘ orientation resulted in a better geometric accuracy but in a lower density, yield strength, tensile modulus, and fracture strength than the 0∘ oriented parts. Based on the aforementioned literature, the expectation is that the best properties are obtained with a high preheating temperature, high laser power, a small scan spacing, a low scan speed, a layer thickness as thin as possible, and a part build orientation parallel to the layer orientation. Although the aforementioned studies provide relationships between process parameters and part properties for PA12, the sensitivity for these parameters has not been addressed quantitatively yet. In addition, studies on PA12 were done on DTM Sinterstations only, which may make broader application of the results difficult. Therefore the present work examines the relation between the process parameters (laser power, scan speed, scan spacing, layer thickness, and preheating temperature) and part properties (the tensile strength, tensile modulus, elongation at break, and part density) of horizontally and vertically built samples using RSM and sensitivity analysis. The aim is to extend process knowledge on selective laser sintering of polymers, increase process control, and enable part property prediction by carrying out a comprehensive analysis of SLS which has not been considered up to now. The ultimate goal is to contribute to the progression of SLS to a full (rapid) manufacturing method (beyond prototyping and visualization) that
3
z x
y
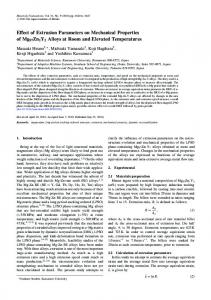
Figure 3: Example of an assembly with various tensile samples. Horizontally built samples are oriented parallel to the 𝑥𝑦-plane; vertically built samples are oriented along the 𝑧-axis.
enables the production of fully functional, critical products. Present work examined and quantified the relations between the input parameters and the part properties for polyamide 12 powder (EOS PA2200) on the EOSINT P395 sintering system for two build orientations (0∘ and 90∘ ). A fractional factorial design of experiments was used to plan the SLS experiments and response functions were created to study the individual and interaction effects between input parameters and the output (part properties). Sensitivity analysis was used to investigate the absolute effect of each input parameter using Monte Carlo simulation and linear correlation coefficients.
2. Materials and Experiments 2.1. Material. The material used for examination was polyamide 12 powder, PA2200, supplied by EOS GmbH (Germany). According to the powder manufacturer, the average particle size of the powder is 56 𝜇m and the bulk density is 0.45 g/cm3 . All samples were printed with refreshed PA2200. Refreshed PA2200 is a mixture of virgin (completely new) PA2200 powder and used PA2200 powder in a 1 : 1 ratio. The proper ratio of new and used powder is produced by the EOS IPCM P mixing system. This mixing system also controls the humidity which is brought to 30% relative humidity. 2.2. Experimental Setup. To be able to determine the properties of sintered objects, test samples were produced. All test samples were dog-bone tensile samples as defined in DIN EN ISO 527-2. All samples were produced on the EOSINT P395 SLS machine (EOS GmbH, Germany). This commercially available sintering apparatus is equipped with a 50 W CO2 laser and has a maximum building volume of 330 × 330 × 640 mm (length × width × height). Samples were printed both horizontally and vertically as schematically depicted in Figure 3.
4
Advances in Materials Science and Engineering
The part properties selected for evaluation were the part density, the tensile strength, the tensile modulus, and the elongation at break. The tensile properties were determined at 5 mm/min strain rate with a universal testing machine (TesT tensile tester). The clamping device was produced to match the dimensions of the tensile samples. This enabled reproducible clamping and prevented slip. The resulting force-displacement data was used to calculate the tensile strength [MPa] and elongation at break [%] of each sample. To be able to calculate the tensile modulus [MPa], the forcedisplacement data was translated into a stress-strain curve. Stress was defined as the force divided by the initial crosssectional area as measured per sample. Strain was defined as the measured displacement divided by the (measured) initial length of the sample. The mass of each sample was determined with a Mettler AT 200 scale, with a precision of 0.001 g. The dimensions of each sample were measured using a digital calliper with a precision of 0.01 mm. This data was used to determine the part density per sample. All values beyond the upper and lower fence were considered outliers and were excluded from further analysis.
3. Design of Experiments and Analysis 3.1. Parameter Selection. The parameters selected for investigation were the preheating temperature [∘ C], laser power [W], scan speed [mm/s], scan spacing [mm], layer thickness [mm], and the part build orientation (0∘ or 90∘ ). 3.2. Total Energy Input. A relation between three of the main process parameters of selective laser sintering has been described in an energy density equation which was introduced by Nelson [11]. Equation (1) specifies the energy density (𝐸𝑑 [J/mm2 ]) as a function of the laser power (𝑃), scan speed (V), and scan spacing (𝑠). The energy density represents the amount of energy supplied to the powder particles per unit area of the powder bed surface [2]. 𝐸𝑑 =
𝑃 . 𝑠⋅V
(1)
Thijs et al. [12] adapted this equation by adding the layer thickness as a fourth parameter thus describing the energy input per unit of volume as follows: 𝑉𝐸𝑑 =
𝑃 . 𝑠⋅V⋅𝑡
(2)
The former equations do not, however, fully capture the energy input needed to obtain powder melt. To this end, a measure for the total energy input per unit of volume has been defined by adding the energy input from the preheating phase to the volumetric energy density equation (2). This preheating energy input is defined as follows: 𝐸pr = 𝑐𝑝 ⋅ 𝜌 ⋅ 𝑇pr .
(3)
Combining the volumetric energy density and the preheating energy captures all the energy related process parameters
(4) and determines how much powder will melt. The total energy input 𝐸in is expected to correlate with the resulting part properties. 𝐸in =
𝑃 + 𝑐 ⋅ 𝜌 ⋅ 𝑇pr , 𝑠⋅V⋅𝑡 𝑝
(4)
where 𝐸in [J/mm3 ] is total volumetric energy input, 𝑃 [W] is laser power, 𝑠 [mm] is scan spacing, V [mm/s] is scan speed, 𝑡 [mm] is layer thickness, 𝑐𝑝 [J/g∘ C] is specific heat capacity, 𝜌 [g/mm3 ] is powder density, and 𝑇pr [∘ C] is preheating temperature. In the remainder of this article, the energy term (𝐸in ) is used to capture the five process parameters in one term. The specific heat capacity and the powder density are material constants. According to the EOS material data sheet the powder density of EOS PA2200 is 0.45 g/cm3 . According to the additive manufacturing company Cresilas, the specific heat capacity of PA12 is 1.64 J/g∘ C. Therefore, these values are used in the calculation of 𝐸in . 3.3. Process Settings. A design of experiments (DoE) approach has been used to determine the correlation between aforementioned process parameters (in total 5) and part properties (in total 4) for two part build orientations. To be able to investigate the linear and interaction effects of five factors simultaneously while minimizing the amount of print jobs, the choice has been made to use the one-half fractional factorial design of experiments with five factors and two levels (25-1 fractional factorial design). This allowed the determination of the main effects and two-factor interactions [13]. To be able to detect nonlinear effects, four centre points were added. This resulted in sixteen different parameter sets which were produced in four different print jobs. The four centre point sets were printed in four individual print jobs. Each parameters set was used to print 12 horizontally built and 12 vertically built tensile samples. This resulted in a total amount of 480 tensile samples. 3.4. Response Functions. The (fractional) factorial design resulted in a series of samples produced with different parameter sets and accompanying response(s). Based on this data, response functions were created. For the selected design, these equations are polynomial functions consisting of the overall mean response, the main effect for each factor, and the two-way interaction between factors [14, 15]. This resulted in the following function in which 𝑌 is the response value (output parameter) and 𝑋𝑛 are the input parameters: 𝑌 = 𝑐0 + ∑𝑐𝑖 𝑋𝑖 + ∑𝑐𝑖𝑖 𝑋𝑖 2 + ∑𝑐𝑖𝑗 𝑋𝑖 𝑋𝑗 , 𝑖
𝑖
𝑖50%) determined by the scan spacing and the layer thickness. The third and fourth main effects were the scan speed and preheating temperature followed by the laser power. When analysing the behaviour of the tensile modulus in more detail, a saw-tooth pattern was observed (Figure 6). The peaks of this saw-tooth pattern correspond to parameter sets printed with the smallest layer thickness, while the low values
Advances in Materials Science and Engineering
9 Tensile modulus
Tensile strength 0.6
0.6
0.4
0.4
0.2
0.2 0
0 −0.2
Spacing
Thickness
Speed
Preheating
Power
−0.2
−0.4
−0.4
−0.6
−0.6
−0.8
−0.8
Thickness
Spacing
Elongation at break
Power
Preheating
Power
Preheating
Part density
0.6
0.6
0.4
0.4
0.2
0.2
0 −0.2
Speed
0 Spacing
Speed
Thickness
Power
Preheating
−0.2
−0.4
−0.4
−0.6
−0.6
−0.8
−0.8 0∘ 90∘
Thickness
Spacing
Speed
0∘ 90∘
Figure 7: Linear correlation coefficients between the process parameters and the resulting part properties, sorted by size.
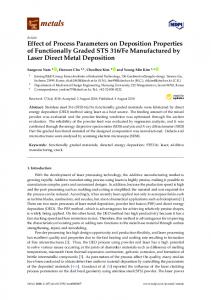
correspond to parameter sets printed with the thickest layers. The linear correlation coefficients and the corresponding sensitivities confirm that the layer thickness had the largest influence on the tensile modulus for both build orientations. As visualized in Figure 8, the layer thickness determines approximately 40% of the value for the tensile modulus. The second main effect was the scan spacing, followed by the scan speed and laser power. According to the sensitivity analysis the preheating temperature had a very minimal effect on the tensile modulus (1 to 4%). The elongation at break increased approximately linearly with an increase in energy input. According to the sensitivity analysis, elongation at break was mainly determined by scan spacing and scan speed. The third main effect was layer thickness, followed by laser power and preheating temperature. The adjusted 𝑅-squared value of the elongation at break equations is low compared to the other equations. This indicates that there might be another (not investigated) parameter which affects the elongation at break. The expectation is that this parameter is the cooling rate. The cooling rate determines the crystallinity of the material which affects the strain behaviour. Fast cooling results in low crystallinity, high ductility, and large elongation at break. Slow cooling results in high crystallinity, low ductility, and small elongation at break. Implementation of the cooling rate in the regression equation might improve the adjusted 𝑅-squared value of the elongation at break regression equations.
The graph in Figure 6 showed that the part density is very constant (minimal variability) and stabilizes quickly. Sensitivity analysis of horizontally built samples showed that layer thickness, scan spacing, and scan speed, respectively, determined the majority of the part density value, followed by the laser power and preheating temperature. This behaviour is comparable with the results of the sensitivity analyses of the other part properties. The sensitivity analysis of vertically built samples, however, led to different results. According to the analysis, preheating temperature had the largest effect on the part density of vertically built samples, followed by layer thickness and laser power. All other analyses showed that preheating temperature and laser power had the least significant effect. This deviation could be related to the stable behaviour of the part density. When a property does not (significantly) change despite varying input parameters, it is more complicated to assign an effect to a specific parameter.
5. Conclusion Present work quantified the part properties of 480 tensile samples produced with 17 different parameter sets. The design parameters were the preheating temperature, laser power, scan speed, scan spacing, layer thickness, and part build orientation. The part properties selected as output were the tensile strength, tensile modulus, elongation at break, and part density. Based on the measured data, a regression analysis was performed to obtain the response surfaces for the
10
Advances in Materials Science and Engineering Tensile modulus 1%
Tensile strength 12% 26%
20%
12% 12%
0∘
Elongation at break
17%
11%
10% 15%
42%
27%
Part density
31%
11%
23%
30%
35%
18%
27%
20%
(a)
Tensile modulus 4%
Tensile strength
26%
8% 20%
37%
26%
23%
26%
Speed Thickness
Preheating Power Spacing
22%
26% 17%
27%
18%
34%
23%
Preheating Power Spacing
Part density
12%
13%
20%
90∘
Elongation at break 2%
16%
Speed Thickness
Preheating Power Spacing
Speed Thickness
Preheating Power Spacing
Speed Thickness
(b)
Figure 8: Sensitivities of the process parameters on part properties of horizontally built samples (a) and vertically built samples (b).
part properties. The Monte Carlo simulation was performed using lattice hypercube sampling to determine the linear correlation coefficients and the sensitivities of the process parameters. Analysis of the part properties versus the energy input showed that the part properties increased with increasing energy input, until an upper limit was reached. In addition, the experiments showed that despite similar density values, the tensile properties of sintered products are directionally dependent. High energy input levels will decrease this anisotropy but will negatively affect the dimensional accuracy of the sintered parts. Sensitivity analyses showed that the most important process variables were scan spacing and layer thickness. Adjusting the settings of these variables will heavily affect the resulting part properties. Scan speed has the third largest impact on the part properties, followed by preheating temperature and laser power. However, the part density of vertically built samples was affected most by the preheating temperature (see Figures 7 and 8). For the elongation at break the second largest (0∘ ) and largest (90∘ ) impact was the scan speed with linear correlation coefficients of −0.47 and −0.62.
Acknowledgments
Competing Interests
[5] S. Negi, S. Dhiman, and R. K. Sharma, “Determining the effect of sintering conditions on mechanical properties of laser sintered glass filled polyamide parts using RSM,” Measurement, vol. 68, pp. 205–218, 2015.
The authors declare that there is no conflict of interests regarding the publication of this paper.
The authors would like to thank the 3D printing professional Oceanz for their contribution regarding sample production. In addition special thanks are due to Dr. Ir. M. P. M. A. Limpens (TNO), Dr. Ir. E. Meinders (TNO), and Dr. E. van der Garde (Oceanz) for their input and support.
References [1] S. Griessbach, R. Lach, and W. Grellmann, “Small series production of high-strength plastic parts,” Kunststoffe International, vol. 98, no. 5, pp. 11–14, 2008. [2] B. Caulfield, P. E. McHugh, and S. Lohfeld, “Dependence of mechanical properties of polyamide components on build parameters in the SLS process,” Journal of Materials Processing Technology, vol. 182, no. 1–3, pp. 477–488, 2007. [3] R. D. Goodridge, C. J. Tuck, and R. J. M. Hague, “Laser sintering of polyamides and other polymers,” Progress in Materials Science, vol. 57, no. 2, pp. 229–267, 2012. [4] A. Wegner and G. Witt, “Correlation of process parameters and part properties in laser sintering using response surface modeling,” Physics Procedia, vol. 39, pp. 480–490, 2012.
Advances in Materials Science and Engineering [6] A. E. Tontowi and T. H. C. Childs, “Density prediction of crystalline polymer sintered parts at various powder bed temperatures,” Rapid Prototyping Journal, vol. 7, no. 3, pp. 180–184, 2001. [7] S. Griessbach, R. Lach, and W. Grellmann, “Structure–property correlations of laser sintered nylon 12 for dynamic dye testing of plastic parts,” Polymer Testing, vol. 29, no. 8, pp. 1026–1030, 2010. [8] A. Pilipovi´c, B. Valentan, T. Brajlih et al., “Influence of laser sintering parameters on mechanical properties of polymer products,” in Proceedings of the 3rd International Conference on Additive Technologies, January 2010. [9] S. Berretta, O. Ghita, and K. E. Evans, “Morphology of polymeric powders in Laser Sintering (LS): from Polyamide to new PEEK powders,” European Polymer Journal, vol. 59, pp. 218–229, 2014. [10] U. Ajoku, N. Hopkinson, and M. Caine, “Experimental measurement and finite element modelling of the compressive properties of laser sintered Nylon-12,” Materials Science and Engineering: A, vol. 428, no. 1-2, pp. 211–216, 2006. [11] J. C. Nelson, Selective laser sintering: a definition of the process and an empirical sintering model [doctoral dissertation], University of Texas, Austin, Tex, USA, 1993. [12] L. Thijs, F. Verhaeghe, T. Craeghs, J. V. Humbeeck, and J.P. Kruth, “A study of the microstructural evolution during selective laser melting of Ti-6Al-4V,” Acta Materialia, vol. 58, no. 9, pp. 3303–3312, 2010. [13] R. J. M. M. Does, G. B. W. van Dongen, and A. Trip, An Introduction to Design of Experiments in Industry, CQM, Eindhoven, The Netherlands, 1992. [14] J. K. Telford, “A brief introduction to design of experiments,” Johns Hopkins APL Technical Digest, vol. 27, no. 3, pp. 224–232, 2007. [15] “Minitab 17, Multiple Regression,” http://support.minitab.com/ en-us/minitab/17/Assistant Multiple Regression.pdf. [16] I. Baran, C. C. Tutum, and J. H. Hattel, “Probabilistic analysis of a thermosetting pultrusion process,” Science and Engineering of Composite Materials, vol. 23, no. 1, pp. 67–76, 2016. [17] D. G. M. Wright, R. Dunk, D. Bouvart, and M. Autran, “The effect of crystallinity on the properties of injection moulded polypropylene and polyacetal,” Polymer, vol. 29, no. 5, pp. 793– 796, 1988. [18] A. K. Van der Vegt, Polymeren: van Keten tot Kunststof, Delft University Press, Delft, Netherlands, 1991. [19] H. Zarringhalam, N. Hopkinson, N. F. Kamperman, and J. J. de Vlieger, “Effects of processing on microstructure and properties of SLS Nylon 12,” Materials Science and Engineering A, vol. 435436, pp. 172–180, 2006. [20] Y. Shi, Z. Li, H. Sun, S. Huang, and F. Zeng, “Effect of the properties of the polymer materials on the quality of selective laser sintering parts,” Proceedings of the Institution of Mechanical Engineers, Part L: Journal of Materials: Design and Applications, vol. 218, no. 3, pp. 247–252, 2004.
11
Journal of
Nanotechnology Hindawi Publishing Corporation http://www.hindawi.com
Volume 2014
International Journal of
International Journal of
Corrosion Hindawi Publishing Corporation http://www.hindawi.com
Polymer Science Volume 2014
Hindawi Publishing Corporation http://www.hindawi.com
Volume 2014
Smart Materials Research Hindawi Publishing Corporation http://www.hindawi.com
Journal of
Composites Volume 2014
Hindawi Publishing Corporation http://www.hindawi.com
Volume 2014
Journal of
Metallurgy
BioMed Research International Hindawi Publishing Corporation http://www.hindawi.com
Volume 2014
Nanomaterials
Hindawi Publishing Corporation http://www.hindawi.com
Volume 2014
Submit your manuscripts at https://www.hindawi.com Journal of
Materials Hindawi Publishing Corporation http://www.hindawi.com
Volume 2014
Journal of
Nanoparticles Hindawi Publishing Corporation http://www.hindawi.com
Volume 2014
Nanomaterials Journal of
Advances in
Materials Science and Engineering Hindawi Publishing Corporation http://www.hindawi.com
Volume 2014
Journal of
Hindawi Publishing Corporation http://www.hindawi.com
Volume 2014
Journal of
Nanoscience Hindawi Publishing Corporation http://www.hindawi.com
Scientifica
Hindawi Publishing Corporation http://www.hindawi.com
Volume 2014
Journal of
Coatings Volume 2014
Hindawi Publishing Corporation http://www.hindawi.com
Crystallography Volume 2014
Hindawi Publishing Corporation http://www.hindawi.com
Volume 2014
The Scientific World Journal Hindawi Publishing Corporation http://www.hindawi.com
Volume 2014
Hindawi Publishing Corporation http://www.hindawi.com
Volume 2014
Journal of
Journal of
Textiles
Ceramics Hindawi Publishing Corporation http://www.hindawi.com
International Journal of
Biomaterials
Volume 2014
Hindawi Publishing Corporation http://www.hindawi.com
Volume 2014