place to study the strength characteristics of foundation soils. For this study, 387 ... Professor, Dept. of civil engineering. ..... Master degree Project, Faculty of Civil ...
International Journal of Computer Applications (0975 – 8887) Volume 36– No.11, December 2011
Spatial Correlation of Mechanical Properties of Subgrade Soil for Foundation Characterization Saklecha P.P Associate Prfessor, Dept.of civil engineering, Bapurao Deshmukh College of Engineering, Sevagram, Maharashtra, India. .
Katpatal Y.B
Rathore S.S.,
Professor, Dept. of civil engineering. Professor, Manoharbhai Patel Visvesvaraya National Institute of Institute of Engineering and Technology Nagpur, Maharashtra, India. Technology, Gondia, Maharashtra, India.
Agarawal D.K. Professor, Dept. of civil engineering, Bapurao Deshmukh College of Engineering, Sevagram, Maharashtr
ABSTRACT This study has examined the feasibility of simple regression analysis (SRA), and multiple regression analysis (MRA) in correlating the mechanical properties of subgrade soil (foundation soil) with strength characteristic CBR. These correlations have been further used to find the effect of an individual soil property, and effect of a combination of soil properties on strength characteristic CBR. Moderate correlation (R = 0.68) was obtained by SRA, while MRA generated good correlation (R = 0.8). It was shown that the correlation of mechanical properties of subgrade soils such as Atterberg limits and compaction properties could be used for foundation characterization by estimating the characteristic strength CBR of foundation soils
General Terms Correlation, Foundation soil, Strength characteristic, Subgrade.
Keywords Atterberg limits, California bearing ratio (CBR), Compaction properties, multiple regression analysis (MRA), Simple regression analysis (SRA).
1. INTRODUCTION Characterizing field material properties by using laboratory tests is an ongoing problem in the discipline of pavement design. This problem has two aspects. First, it is difficult to collect and test representative samples. Because of the large variability of typical pavement materials, a large number of random samples must be collected and tested to generate results with good statistical significance. Second, it is difficult to quantify the in situ sample condition and environment in a laboratory. This problem is particularly acute for subgrade material (foundation soil) layers in a weathered basaltic terrain, where the strength characteristics of a foundation soil vary rapidly as the extent of weathering changes from place to place. Papers presented by Daleiden et al [1], and Forsyth, R. [2] at the Transportation Research Board Annual Meeting in Washington D.C. highlight the inherent difficulties in using laboratory testing to characterize field subgrade conditions. It was observed that the
cost implications of conservative pavement designs, resulting from inability to adequately characterize the field subgrade strengths are staggering. Therefore, it is necessary to find alternative tools to empirical methods of foundation characterization. Spatial correlation of mechanical properties of foundation soil could be one such tool for foundation characterization because foundation strength is affected by different soil properties. In this research work, an attempt has been made apply simple regression analysis and multiple regression analysis to develop correlation models for foundation characterization of a weathered basaltic terrain by correlation of mechanical properties of foundation soil. The mechanical properties used are optimum moisture content (OMC), maximum dry density (MDD), liquid limit (LL), plastic limit (PL) and plasticity index (PI). The strength characteristic of foundation material is represented by California Bearing Ratio (CBR). A vast area in Maharashtra is occupied by Basalt and Wardha District is almost completely overlain by Basalts, thus offering it to be a suitable place to study the strength characteristics of foundation soils. For this study, 387 data sets of mechanical properties and corresponding CBR values have been collected for different locations in Wardha district in the state of Maharashtra, India. The data sets have been collected from laboratory test reports of different agencies, for various quarries and various ongoing road projects of Pradhan Mantri Gram Sadak Yojana (Prime Minister’s Rural Road Scheme).
2. PREVIOUS RESEARCH WORKS One of the first studies was on compaction characteristics by Jumikis [3]. Jumikis developed a correlation equation between liquid limit with optimum moisture content and plasticity index. Jumikis [4] applied the method to estimate the optimum moisture content and maximum dry density of the fine material soils. McRae [5] developed compaction classification index, which can be used in establishing compaction requirements for different soil types and in predetermining the approximate amount of compaction effort likely to be required on each particular soil in the field. Joslin [6] suggested compaction curves called Ohio compaction curves. Using liquid limit, plastic limit and plasticity index, Ring, Sallberg, and Collins [7] developed two correlations of OMC and MDD from approximate average particle diameter, content of particles finer than 0.001 mm, and fineness average.
20
International Journal of Computer Applications (0975 – 8887) Volume 36– No.11, December 2011 Linveh [8] stressed on the changes of the obtained experimental values, which were caused by changing in the geographical area all over the world. For this, Livneh made to verify of correlations between a series of penetration tests and in situ California bearing ratio tests. Al-refeai and Al-Suhaibani [9] have done a study on the estimation of CBR by using conic penetrometer experiment. Kin [10] calculated the CBR values by correlating the soil index properties and measured CBR values. Gunaydin [11] studied the estimation of the compaction parameters with soil index properties by using statistical analysis and artificial neural networks. Yildirim and Gunaydin [12] used soft computing systems for estimation of CBR value.
3. STATISTICAL DATA USED
PARAMETERS
OF
The statistics of the collected data sets of foundation soils are given in Table 1.
4. SIMPLE (SRA)
REGRESSION
ANALYSIS
Five Models have been developed by simple regression analysis to show the effect of an individual mechanical property of soil on characteristic strength index CBR of foundation soil. The proposed Models are as under – Model 1: Model 2: Model 3: Model 4: Model 5:
OMC vs. CBR, MDD vs. CBR LL vs. CBR PL vs. CBR PI vs. CBR
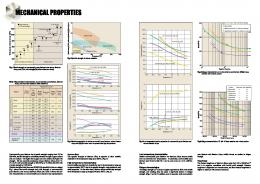
The correlations of CBR with OMC, MDD, LL, PL and PI for these models are shown in fig. 1 to Fig. 5. The SRA analyses of various Models have been used to establish correlation equations between an individual foundation soil property and Characteristic strength index CBR of foundation soil (Table 2). The obtained correlation equations were used for prediction of CBR values. The values of the soil properties from collected 387 data sets were fed into respective correlation equation to obtain the predicted CBR values. Statistical parameters of CBR predicted by various SRA Models have been presented in Table 3. The statistical parameters indicate that Model 2 has given the best performance as it has the highest R-value of 0.68 and Rsquare value (R2) of 0.46. Models 1, 4, 3 and 5 have performed in decreasing order by showing R-values equal to 0.49, 0.08, and 0.02 and -0.03. R- Square value (R2) is 0.24, 0.01, 0.00, and 0.00 for Models 1, 4, 3, and 5. These R and R2 values indicate poor performance of Models 1, 3, 4 and 5. Further, for Model 2, the average % error with actual CBR is lowest at 33.52 %, and skewness is 0.94, which show better correlation. Amongst all the five SRA Models, Model 2 exhibits good correlation between predicted CBR and actual CBR.
4.1. Effect of individual soil property on CBR value The effect of an individual soil property on CBR value is depicted by comparing the R-values for various Models. The Rvalues are plotted in fig. 6. The plot showed that that Model 2 (MDD) has the highest impact on CBR value, followed by Model 2 (OMC), Model 4 (PL), Model 3 (LL), and Model 5 (PI) in decreasing order.
5. MULTIPLE REGRESSION ANALYSIS (MRA) Five models (Table 4) with different combinations of soil properties were analyzed by MRA for the correlation of a combination of different soil properties with Characteristic strength index CBR of subgrade soil. The collected 387 data sets of mechanical properties of foundation soil and CBR values were used for this purpose. The results of the MRA were obtained in the form of correlation equations (Table 5), and statistical parameters like correlation coefficients (R) and Rsquared (R2) values (Table 6). The values of the soil properties were put into respective correlation equations to obtain the predicted CBR values. The predicted CBR values were then correlated with actual CBR values by generating the best linear fit curves and finding the coefficient of correlation between them (Fig.7 to Fig.11). An attempt has also been made to find out the effect of these Models on CBR value of a subgrade soil. The statistical parameters of MRA indicated that Model 3 and model 4 gave the best performance by showing the highest Rvalue of 0.8 and R- square value (R2) of 0.63. Models 1, 5, and 2 have performed in decreasing order by showing R-values equal to 0.68, 0.69, and 0.75. For these Models, R- square values (R2) were found to be 0.47, 0.47, and 0.57. These statistical results indicate that models 3 and 4 performed well as compared to other models
5.1 Effect of regression Models on CBR The statistical results obtained in table VI were used to show the effect of various Models on CBR. It was observed that Model 3, and Model 4 have the highest effect on CBR value. Model 2, 5 and 1 affect the CBR in decreasing order. The effect of these Models on CBR value is presented in Fig.12.
6. CONCLUSION Results of SRA have shown that SRA Model 2 (R= 0.68, R2 = 0.46) was able to generalize moderately with characteristic strength CBR of foundation soil. Other SRA Models indicated low correlations. However, these correlations could be used as in indicator to show the effect of an individual mechanical property of foundation soil on characteristic strength CBR. The SRA showed that MDD has highest effect on the CBR value of foundation soil, followed by OMC, PI, LL and PI in decreasing order. Results of MRA showed remarkably improved correlations. Model 3 was able to generate R, and R2 value to the extent of 0.8 and 0.63 respectively, showing good generalizations. It was also observed that a combination of soil properties viz. MDD,
21
International Journal of Computer Applications (0975 – 8887) Volume 36– No.11, December 2011 OMC, LL, PL and PL produced the maximum effect on strength characteristic CBR. Therefore, it can be concluded that a combination of soil properties viz. MDD, OMC, LL, and PL and PI correlated well with strength characteristic CBR of foundation soil (subgrade soil) as compared to an individual soil property. Consequently, it can be concluded that spatial correlation of mechanical properties of foundation soil can be used as an alternative tool to field and laboratory methods for foundation characterization.
Table 4: MODELS USED FOR MRA ANALYSIS Model 1
MDD and OMC vs. CBR
Model 2
MDD, OMC and LL vs. CBR
Model 3
MDD, OMC, LL and PL vs. CBR
Model 4
MDD, OMC, LL, PL and PI vs. CBR
Model 5
MDD, OMC, and PI vs. CBR
Table 1: STATISTICS OF DATA USED
Statistics
OMC %
MDD gm/cc
LL %
PL %
PI %
CBR %
Min value Max value Range Mean value Median Mode Variance Std deviation Skewness
8.40 25.5 17.1 15.5 15.3 18.2 9.03 3.01 0.09
1.46 2.31 0.85 1.82 1.79 1.72 0.02 0.15 0.94
20.30 79.70 59.40 35.57 33.64 35.10 76.96 8.77 1.49
15.60 44.48 28.88 25.08 24.30 26.92 32.82 5.73 1.25
3.60 52.60 49.00 10.49 7.88 6.92 42.28 6.50 2.35
1.80 52.60 50.80 7.81 3.70 3.15 68.50 8.28 2.11
Table 5: CORRELATION EQUATIONS OBTAINED BY MRA MRA Model Model 1 Model 2 Model 3 Model 4 Model 5
Correlation equation CBR = 0.26 OMC + 42.55 MDD -73.62 CBR = 0.24OMC + 49.79 MDD + 0.33 LL -97.94 CBR = 0.62 OMC + 58.9 MDD +0.11 LL + 0.53 PL - 126.18 CBR =0.63OMC+59.1MDD40.94LL+41.59PL+41.05PI-126.76 CBR = 0.18 OMC + 42.13 MDD + 0.11 PI - 72.69
Table 6: STATISTICAL RESULTS OF MRA Table 2: CORRELATION EQUATIONS OBTAINED BY SRA Model Model 1 Model 2 Model 3 Model 4 Model 5
Correlation equation CBR = -1.3407OMC + 28.623 CBR = 38.38MDD - 61.95 CBR = 0.022LL + 7.025
MRA Model
R
R2
Model 1 Model 2 Model 3 Model 4 Model 5
0.68 0.75 0.80 0.80 0.69
0.47 0.57 0.63 0.63 0.47
CBR = 0.108PL + 5.085 CBR = -0.044PI + 8.274
Table 3: STATISTICAL RESULTS OF SRA. Statistics R R2 % error Std deviation Variance Skewness
Model 1 0.49 0.24 53.12
Model 2 0.68 0.46 33.52
Model 3 0.02 0.00 79.84
Model 4 0.08 0.01 80.39
Model 5 -0.03 0.00 79.45
4.03
5.81
0.75
1.00
0.43
16.23 -0.09
33.72 0.94
0.56 1.49
1.01 1.25
0.19 2.35
Fig. 1. Correlation of CBR and OMC model 1)
22
International Journal of Computer Applications (0975 – 8887) Volume 36– No.11, December 2011
Fig. 2. Correlation of CBR and MDD (Model 2)
Fig. 5. Correlation of CBR and PI (Model 5)
Fig. 3. Correlation of CBR and LL (Model 3) Fig.6. Effect of SRA Models on CBR value
Fig. 4. Correlation of CBR and PL (Model 4)
Predicted CBR % by MLR model 1
35.00 y = 0.4679x + 4.1558 R2 = 0.4679
30.00 25.00 20.00 15.00 10.00 5.00 0.00 0.00 -5.00
10.00
20.00
30.00
40.00
50.00
60.00
-10.00 Actual CBR %
Fig. 7. Correlation between actual CBR and CBR predicted by MRA Model 1
23
International Journal of Computer Applications (0975 – 8887) Volume 36– No.11, December 2011
P r e d i c t e d
40.00 y = 0.5686x + 3.3693 R2 = 0.5686
Predicted CBR % by MLR model 2
35.00 30.00 25.00 20.00 15.00
y = 0.6335x + 2.8625 R2 = 0.6335
35.00 30.00 25.00
C 20.00 B R 15.00 %
10.00 5.00
10.00
0.00 0.00 -5.00
40.00
10.00
20.00
30.00
40.00
50.00
60.00
-10.00 Actual CBR %
Fig. 8. Correlation between actual CBR and CBR predicted by MRA Model 2
M 5.00 o d 0.00 e 0.00 10.00 20.00 30.00 40.00 50.00 60.00 l -5.00 4
-10.00 Actual CBR % y = 0.6335x + 2.8625 R2 = 0.6335
35.00
Fig. 10. Correlation between actual CBR and CBR predicted by MRA Model 4
30.00 25.00 20.00
35
15.00
30
10.00 5.00 0.00 0.00 -5.00
10.00
20.00
30.00
40.00
50.00
60.00
-10.00 Actual CBR %
Fig. 9. Correlation between actual CBR and CBR predicted by MRA Model 3
Predicted CBR % by model 5
Predicted CBR% by MLR model 3
40.00
y = 0.4749x + 4.101 R2 = 0.4749
25 20 15 10 5 0 0.00 -5
10.00
20.00
30.00
40.00
50.00
60.00
-10 Actual CBR %
Fig. 11. Correlation between actual CBR and CBR predicted by MRA Model 5
24
International Journal of Computer Applications (0975 – 8887) Volume 36– No.11, December 2011 [5] McRae, J. L. (1958). “Index of compaction characteristics.” Symposium on application of soil testing in highway design and construction (pp. 119–127) ASTM Special Technical Publication, No. 239. [6] Joslin, J. G. (1959). “Ohio’s typical moisture-density curve.” ASTM STP 239, 111–118. [7] Ring, G.W., Sallberg, J.R., Collins, W.H. (1962). “Correlation of compaction and classification test data”. Highway Research Bulletin (Vol. 325, pp. 55-75). Highway Research Board, National Research Council, Washington, D.C. [8]
Livneh, M., and Ishai, I. (1988). ”The Relationship Between In Situ CBR Test and the Various Penetration Tests”. Proc. First Int. Conf. on Penetration Testing, Orlando, Fl, pp. 445-452.
[9]
Al-Refeai, T., & Al-Suhaibani, A. (1996). “Prediction of CBR using dynamic cone penetrometer.” Journal of King Saud University (Engineering Sciences), 2, 191–204 (A.H. 1417/1997).
Fig 12. Effect of various MRA Models on CBR value.
7. REFERENCES [1] Daleiden, J., Rauhut, B, and Killingsworth, B.,"Evaluation of the AASHTO Flexible pavement Design Equation Utilizing the SHRP LTPP Database," Presented at Transportation Research Board 72 nd Annual Meeting, Jan., 1993, Washington D.C., Paper No. 93117 I. [2] Forsyth, R.,"The Case for Reliability in Pavement Design." Presented at Transportation Research Board 72nd Annual Meeting, Jan., 1993, Paper No.9 331005. [3]
Jumikis, A. R. (1946). “Geology and soils of the Newark (NJ) metropolitan area”. Journal of Soil Mechanics and Foundations, ASCE, 93(SM2), 71–95.
[4] Jumikis, A. R. (1958). “Geology and soils of the Newark (NJ) metropolitan area.” ASCE Journal of Soil Mechanics and Foundations Division, 94(2).
[10] Kin, M. W. (2006). “California bearing ratio correlation with soil index properties”. Master degree Project, Faculty of Civil Engineering, University Technology Malaysia. [11]
Gunaydin, O. (2009). “Estimation of compaction parameters by using statistical analyses and artificial neural networks”. Environmental Geology Journal, 57, 203–215.
[12]
Yildirim, B., and Gunaydin, O. (2011). ‘Estimation of California bearing ratio by using soft computing systems”. Expert Systems with Applications, 38, 6381–6391.
25