∗
Cost Estimation of Spatial k-Nearest-Neighbor Operators Ahmed M. Aly
Walid G. Aref
Mourad Ouzzani
Purdue University West Lafayette, IN
Purdue University West Lafayette, IN
[email protected]
[email protected]
Qatar Computing Research Institute Doha, Qatar
ABSTRACT Advances in geo-sensing technology have led to an unprecedented spread of location-aware devices. In turn, this has resulted into a plethora of location-based services in which huge amounts of spatial data need to be efficiently consumed by spatial query processors. For a spatial query processor to properly choose among the various query processing strategies, the cost of the spatial operators has to be estimated. In this paper, we study the problem of estimating the cost of the spatial k-nearest-neighbor (k-NN, for short) operators, namely, k-NN-Select and k-NN-Join. Given a query that has a k-NN operator, the objective is to estimate the number of blocks that are going to be scanned during the processing of this operator. Estimating the cost of a k-NN operator is challenging for several reasons. For instance, the cost of a k-NN-Select operator is directly affected by the value of k, the location of the query focal point, and the distribution of the data. Hence, a cost model that captures these factors is relatively hard to realize. This paper introduces cost estimation techniques that maintain a compact set of catalog information that can be kept in main-memory to enable fast estimation via lookups. A detailed study of the performance and accuracy trade-off of each proposed technique is presented. Experimental results using real spatial datasets from OpenStreetMap demonstrate the robustness of the proposed estimation techniques.
1. INTRODUCTION The ubiquity of location-aware devices, e.g., smartphones and GPS-devices, has led to a variety of location-based services in which large amounts of geo-tagged information are created every day. This demands spatial query processors that can efficiently process spatial queries of various complexities. One class of operations that arises frequently in practice is the class of spatial k-NN operations. Examples of spatial k-NN operations include: (i) Find the k-closest hotels to my location (a k-NN-Select), and (ii) Find for each school the k-closest hospitals (a k-NN-Join). The k-NN-Select and k-NN-Join operators can be used along with other spatial or relational operators in the same query. In this ∗This research was supported in part by National Science Foundation under Grants IIS 0916614, IIS 1117766, and IIS 0964639.
c 2015, Copyright is with the authors. Published in Proc. 18th Inter⃝ national Conference on Extending Database Technology (EDBT), March 23-27, 2015, Brussels, Belgium: ISBN 978-3-89318-067-7, on OpenProceedings.org. Distribution of this paper is permitted under the terms of the Creative Commons license CC-by-nc-nd 4.0 .
[email protected]
case, various query-execution-plans (QEPs, for short) for the same query are possible, but with some of the QEPs having better execution times than the others. The role of a query optimizer is to arbitrate among the various QEPs and pick the one with the least processing cost. In this paper, we study the problem of estimating the cost of the k-NN-Select and k-NN-Join operators. To demonstrate the importance of estimating the cost of these operators, consider the following example query: ‘Find the k-closest restaurants to my location such that the price of the restaurant is within my budget’. This query combines a spatial k-NN-Select with a relational select (price ≤ budget). There are two possible QEPs for executing this query: (i) Apply the relational select first, i.e., select the restaurants with price ≤ budget and then get the k-closest out of them, or (ii) Apply an incremental k-NN-Select (i.e., distance browsing [14]) and evaluate the relational select on the fly; execution should stop when k restaurants that qualify the relational predicate are retrieved. Clearly, the two QEPs can have different performance. Thus, it is essential to estimate the cost of each processing alternative in order to choose the cheaper QEP. Observe that distance browsing is also applicable to non-incremental k-NNSelect (i.e., to QEP(i)). [14] proves that for non-incremental k-NNSelect, the number of scanned blocks is optimal in distance browsing. Thus, in this paper, we model the cost of distance browsing being the state-of-the-art for k-NN-Select processing. In addition to modeling the cost of the k-NN-Select, we study the cost of the k-NN-Join. The k-NN-Join is a practical spatial operation for many application scenarios. For example, consider the following query that combines a relational or a spatial predicate with a k-NN-Join predicate. Assume that a user wants to select for each hotel, its k-closest restaurants (k-NN-Join predicate) such that the restaurant/hotel’s price is within the user’s budget (relational predicate), or that the restaurant/hotel’s location is within a certain downtown district (spatial range predicate). Clearly, estimating the cost of a k-NN-Join is important to decide the ordering of the relational, spatial, and k-NN operators in the QEP. A k-NNJoin can also be useful when multiple k-NN-Select queries are to be executed on the same dataset. To share the execution, exploit data locality and the similarities in the data access patterns, and avoid multiple yet unnecessary scans of the underlying data (e.g., as in [11]), all the query points are treated as an outer relation and processing is performed in a single k-NN-Join. In this paper, we introduce a cost model for locality-based k-NN-Join processing [22], which is the state-of-the-art in k-NN-Join processing. While several research efforts (e.g., see [2, 3, 4, 5, 7, 15, 17, 18, 23]) estimate the selectivity and cost of the spatial join and range operators, they are not applicable to k-NN operators. For instance, the cost of a spatial range operator is relatively easy to estimate because the spatial region of the operator, in which the query answer
• We introduce the Staircase technique for estimating the kNN-Select cost. • We introduce three novel techniques for estimating the kNN-Join cost, namely the Block-Sample, Catalog-Merge, and Virtual-Grid techniques. • We conduct extensive experiments to study the performance and accuracy tradeoff that each of the proposed technique offers. Our experimental results demonstrate that: – the Staircase technique outperforms the techniques in [24] by two orders of magnitude in estimation time and by more than 10% in estimation accuracy, – the Catalog-Merge technique achieves an error ratio of less than 5% while keeping the estimation time below one microsecond, and – the Virtual-Grid technique achieves an error ratio of less than 20% while reducing the storage required to maintain the catalogs by an order of magnitude compared to the Catalog-Merge technique. The rest of this paper proceeds as follows. Section 2 introduces some preliminaries and discusses the related work. Section 3 presents the Staircase technique for estimating the cost of k-NNSelect. Section 4 presents the Block-Sample, Catalog-Merge, and Virtual-Grid techniques for estimating the cost of k-NN-Join. Section 5 provides an experimental study of the performance of the proposed techniques. Section 6 contains concluding remarks.
p
z y
T IS IN D
D
AX
M
A
T
IS
M
resides, is predefined and fixed in the query. In contrast, the spatial region that contains the k-nearest-neighbors of a query point, in the case of a k-NN-Select, or a point of the outer relation in the case of a k-NN-Join, is variable since it depends on the value of k, the location of the point, and the density of the data (i.e., its distribution). These three parameters render the problem of k-NN cost-estimation more challenging. In this paper, we introduce the Staircase technique for estimating the cost of k-NN-Select. The Staircase technique distinguishes itself from existing techniques by the ability to quickly estimate the cost of any query using an O(1) lookup. The main idea of the Staircase technique is to maintain a compact set of catalog information that summarize the cost. We perform various optimizations to limit the size of the catalog such that it can easily fit in main-memory. We empirically compare the performance of the Staircase technique against the state-of-the-art technique [24]. We show that the Staircase technique has better accuracy for spatial non-uniform data in the two-dimensional space while achieving orders-of-magnitude gain in query estimation time. Having a fast query execution time is vital for location-based services that serve multiple queries at very high rates, e.g., thousands of queries per second. Thus, estimating the cost needs to be extremely fast as it is a preliminary step before the query itself is executed. In addition to estimating the cost of k-NN-Select, we introduce three new techniques for estimating the cost of k-NN-Join. Similarly to the Staircase technique, the proposed techniques employ a compact set of catalogs that summarize the cost and enable fast estimation. First, we present the Block-Sample as our baseline technique. Then, we introduce the Catalog-Merge technique that has better estimation time than the Block-Sample technique, but incurs relatively high storage overhead. Then, we introduce the VirtualGrid technique that incurs less storage overhead than the CatalogMerge technique. To the best of our knowledge, estimating the cost of k-NN-Join has not been addressed in previous work. The contributions of this paper can be summarized as follows:
B
MAXD
IST
q
MINDIST
Dk x
C
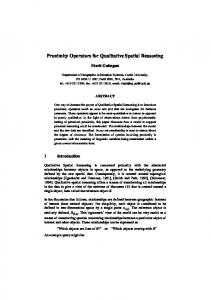
Figure 1: The MINDIST and MAXDIST metrics. In distance browsing [14], when k = 2 and q is a query focal point of a k-NN-Select, only blocks A and C are scanned, i.e., cost = 2.
2.
PRELIMINARIES & RELATED WORK
We focus on the variants of the k-NN operations given below. Assume that we have two tables, say R and S, that represent two sets of points in the two-dimensional space. For simplicity, we use the Euclidean distance metric. • k-NN-Select: Given a query-point q, σk,q (R) returns the kclosest to q from the set of points in R. • k-NN-Join: R 1kN N S returns all the pairs (r, s), where r ∈ R, s ∈ S, and s is among the k-closest points to r. Observe that the k-NN-Join is an asymmetric operation, i.e., the two expressions: (R 1kN N S) and (S 1kN N R) are not equivalent. In the expression (R 1kN N S), we refer to Relations R and S as the outer and inner relations, respectively. We assume that the data points are organized in a spatial index structure. However, we do not assume a specific indexing structure; our proposed techniques can be applied to a quadtree, an Rtree, or any of their variants, e.g. [12, 20, 13, 6, 16]. These are hierarchical spatial structures that recursively divide the underlying space/points into blocks until the number of points inside a block satisfies some criterion (e.g., being less than some threshold). We assume the existence of an auxiliary index, termed the CountIndex. The auxiliary index does not contain any data points, but rather maintains the count of points in each data block. We make extensive use of the MINDIST and MAXDIST metrics [19]. Refer to Figure 1 for illustration. The MINDIST (or MAXDIST) between a point, say p, and a block, say b, refers to the minimum (or maximum) possible distance between p and any point in b. Similarly, the MINDIST (or MAXDIST) between two blocks is the minimum (or maximum) possible distance between them. In some scenarios, we process the blocks in a certain order according to their MINDIST from a certain point (or block). An ordering of the blocks based on the MINDIST from a certain point (or block) is termed MINDIST ordering. Before describing how to estimate the cost of the k-NN operations, we briefly describe the state-of-the-art algorithms for processing the k-NN-Select and k-NN-Join. Existing k-NN-Select algorithms prune the search space following the branch-and-bound paradigm. [19] applies a depth-first algorithm to read the index blocks in MINDIST order with respect to the query point. Once k points are scanned, the distance between q and the k-farthest point encountered is marked. Refer to Figure 1 for illustration. Assume that k = 2. Scanning the blocks starts with Block A (MINDIST = 0). Two points, y and z, are encountered, so the distance between q and z (the farthest) is marked and scanning
3
the blocks continues (Block C then Block B) until the MINDIST of a scanned blocks is greater than the distance between q and z. Thus, the overall number of blocks to be scanned is 3. The above algorithm is suboptimal and cannot be applied for incremental k-NN retrieval. The distance browsing algorithm of [14] achieves optimal performance and can be applied for incremental as well as non-incremental k-NN processing. The main idea of this algorithm is that it can incrementally retrieve the nearest-neighbors to a query point through its getNextNearest() method. Two priority queues are maintained: (1) a priority queue for the blocks that have not been scanned yet (blocks-queue for short), and (2) a priority queue for the tuples in the already scanned blocks that have not been returned as nearest-neighbors yet (tuples-queue for short). The entries in the tuples-queue are prioritized based on the distance from the query point, while the entries in the blocks-queue are prioritized based on the MINDIST from the query point. Upon an invocation of the getNextNearest() method, the top, say t, of the tuples-queue is returned if the distance between t and the query point is less than the MINDIST of the top of the blocks-queue. Otherwise, the top of the blocks-queue is scanned and all its tuples are inserted into the tuples-queue (ordered based on the distance from the query point). To illustrate, we apply the distance browsing algorithm to the example in Figure 1. Assume that k = 2. Block A is scanned first. Points y and z are inserted into the tuples-queue. The MINDIST of Block C is less than the distance of the top of the tuples-queue, and hence Block C is scanned and Point x is inserted into the tuples-queue. Now, Point x is retrieved as the nearestneighbor followed by Point y. Observe that the algorithm avoids scanning Block B. Thus, the overall number of scanned blocks is 2 that is less than the number of blocks to be scanned if the algorithm in [19] is applied. In addition to being optimal, the distance browsing algorithm is quite useful when the number of neighbors to be retrieved, i.e., k, is not known in advance. One use case is when a k-NN-Select predicate is combined with a relational predicate within the same query. Consider, for example, a query that retrieves the k-closest restaurants that provide seafood. The distance browsing algorithm gets the nearest restaurant and then examines whether it provides seafood or not. If it is not the case, the algorithm retrieves the next nearest restaurant. This process is repeated until k restaurants satisfying the condition (i.e., provide seafood) are found. Being the state-of-the-art in k-NN-Select processing, we model the cost of the distance browsing algorithm in this paper. Observe that the cost of the distance browsing algorithm is dominated by the number of blocks that get scanned. Thus, given a k-NN-Select, the goal is to estimate the number of blocks to be scanned without touching the data points. Observe that this goal is challenging because the cost depends on: (1) the value of k, (2) the location of the query point, and (3) the distribution of the data that directly affects the structure of the index blocks. These factors have direct impact on the cost. Refer to Figure 1 for illustration. If the value of k is relatively large, MINDIST scanning of the blocks will continue beyond Block C, and thus leading to a larger overall number of scanned blocks. Similarly, if the location of q is different, the MINDIST values will change, and thus leading to different block ordering during the MINDIST scan, and different overall number of scanned blocks. Also, if the distribution of the data is different, the index blocks will have completely different shapes and locations in space, and this will affect the values of MINDIST, and hence will affect the overall number of scanned blocks. [8, 9, 24] study the problem of estimating the cost of a kNN-Select operator for uniformly distributed datasets. The authors of [24] further extend their techniques to support non-uniform
datasets. The main idea is to estimate the value of Dk (Figure 1), i.e., the smallest radius of a circle centered at the query point and that contains k points. Once the value of Dk is estimated, the number of blocks that overlap with the circle whose center is the query point and whose radius is Dk is determined. This number can be computed by scanning the blocks of the Count-Index in MINDIST order from q. Given a non-uniform dataset, [24] assumes that the points in each block are uniformly distributed and that each block has a constant density. Histograms are maintained to estimate the density of each block in the index. To estimate the cost, [24] applies the following algorithm. The blocks of the Count-Index are scanned in MINDIST order from q. Hence, the scanning starts from the block, say b, that is closest (according to MINDIST ) to q. Observe that if q falls within any block, the MINDIST corresponding to that block will be zero, and hence scanning will start from that block. Given the density of Block b, the area of a circle containing k points for that density is computed and then the value of Dk is determined. If the circle is fully contained inside Block b, the search terminates; otherwise, further blocks are examined and the combined density of these blocks is computed. Given the combined density, the area of a circle containing k points is determined. This process is repeated until the computed circle is fully contained within the bounds of the examined blocks. We refer to this algorithm as the density-based algorithm. Although the density-based algorithm in [24] achieves good estimation accuracy, it incurs relatively high overhead in many cases. For instance, if the value of k is high or if the density of the blocks around the query point is low, the algorithm will keep extending its search region by examining further blocks until its search region contains k points. In addition, at each iteration of the algorithm, the combined density of the encountered blocks is computed, which can be a costly operation. The process of estimating the cost of a database operator has to be extremely fast. Typically, a database query optimizer keeps a set of catalog information that summarizes the cost estimates. Then, given a query, it performs quick lookups or simple computations to estimate the corresponding cost. With that goal in mind, we propose a new cost estimation technique that incurs no computational overhead at query time, but rather requires O(1) lookups. Several query processing techniques have been proposed in the literature for processing k-NN-Join operators, e.g., [10, 25, 22]. [22] represents the state-of-the-art technique in k-NN-Join and has proved to achieve better performance than other existing techniques. The key idea that distinguishes [22] from other existing techniques is that in any other technique, each point in a block independently keeps track of its k-nearest-neighbors encountered thus far with no reuse of neighbors of one point as being neighbors of another point in its spatial proximity. In contrast, [22]’s approach identifies a region in space (termed locality) that contains all of the k-nearest-neighbors of all the points in a block. Once the best possible locality is built, each point searches only the locality to find its k-nearest-neighbors. This block-by-block processing methodology results in high performance gains. A naive way to estimate the cost of a k-NN-Join operator using the density-based algorithm of [24] is to treat every point from the outer relation as a query point for a k-NN-Select operator and then aggregate the cost across all the points from the outer relation. However, this approach is costly. Furthermore, this approach does not capture the rationale behind the block-by-block processing methodology in k-NN-Join processing as stated above. This calls for efficient cost estimation techniques that can represent the cost of the state-of-the-art techniques in k-NN-Join processing.
Ladder Technique
Ladder Technique
r Technique
Actual Cost = 11
Actual Cost = 6
ost = 1
q
q q
(a) Cost = 1
(b) Cost = 6
(c) Cost = 10
Figure 2: Variability of the cost (number of blocks to be scanned) ofLadder a query point given its position with respect to the center of the Technique 11 / 36 12 / 36 block. Assume that the dashed circle includes exactly k points. The cost tends to increase as the query point gets farther from the center of the block. The maximum cost is at the corners of the block if we assume uniform distribution of the points within the block.
3. K-NN-SELECT COST ESTIMATION
L
q
3.1 The Staircase Technique In this section, we present the Staircase technique; a new technique for estimating the cost (i.e., number of blocks to be scanned) of a k-NN-Select σk,q (R). The main idea of the Staircase technique is to maintain a set of catalog information that enables quick estimation of the cost via lookups. Conceptually, the catalog should reflect the cost of a k-NN-Select for every possible query location and for every possible value of k. Given a query point, say q, and the value of k, we can search the catalog and determine the cost. However, maintaining a catalog that covers the domains of these two parameters (k and the location of q) is prohibitively expensive in terms of computation cost and storage requirements. The number of possible locations of q is infinite and the value of k can range from 1 to the size of the underlying table. One key insight to improve the above approach is to exploit the spatial locality of the k-NN operation to reduce the size of the catalog. We observe that the k-nearest-neighbors of a query point, say q1 , are likely to be among the k-nearest-neighbors of another query point, say q2 , if q1 and q2 are within the spatial proximity of each other. In addition, any spatial index structure aims at grouping the points that are within spatial proximity in the same block. This means that the k-nearest-neighbors of the points of the same block have high overlap, and hence the query points that fall within the same block are likely to have similar costs. Given a query point, say q, we can estimate the cost corresponding to q by the cost corresponding to the center of the block in which q is located. Although the above approach yields good estimation accuracy, it is slightly inaccurate because the cost corresponding to a query point, say q, may vary according to the location of q with respect to the center of the block, say b, in which q is located. For a fixed value of k, the cost corresponding to q is minimum if q is near the center of b and tends to increase as q gets far from the center until it reaches its maximum value in the corners of b. Refer to the example in Figure 2 for illustration of this observation. This observation is particularly true if we assume that within a leaf index block, the points are uniformly distributed. Such assumption is practically reasonable. A typical spatial index tends to split the data points (which can be non-uniformly distributed) until the points are almost balanced across the leaf blocks, and hence points that are within the same block tend to have a uniform distribution within that block. Applying the above observation, we estimate the cost corresponding to a query point, say q, by combining two values: 1) the cost corresponding to the center of the block, Ccenter , (i.e., the minimum cost), and 2) the cost corresponding to one of the corners,
Figure 3: Cost estimation respect to the center of a block. 𝜟 = Cost (locality) - Costwith (center)
Estimate = Cost (center) +𝜟 2L/Diag
Ccorner , (i.e., the maximum cost). More precisely, the estimated 14 / 36 cost can be computed as: Cost = Ccenter + ∆ ·
2L , Diagonal
(1)
where Diagonal is the length of the diagonal of the block, L is the distance between q and the center of the block, and ∆ = Ccorner − Ccenter .
(2)
Refer to Figure 3 for illustration. Thus, we do not need to precompute the k-NN cost for every possible query location. Instead, we precompute the cost only for the center and the corners of every block. Although this can reduce the size of the catalog, we still need to precompute the cost for every possible value of k, i.e., from 1 to the size of the table. This can still be prohibitively expensive because it needs to be performed for every block in the index. We observe that the cost corresponding to any query point tends to be constant for different ranges of values of k. The reason is that the number of points in a block is relatively large, and hence the cost (number of blocks to be scanned) tends to be stable for a range of values of k. To illustrate this idea, consider the example in Figure 1. Assume that Blocks A and B have 1000 points each. Assume further that k1 = 500 tuples in Block A have a distance that is less than the MINDIST betweeb Block B and the query point q. Applying the distance browsing algorithm [14] as explained in Section 2, points in Block A will be inserted in the tuples-queue. The k1 points in Block A will be retrieved from the tuples-queue before Block B is scanned. Thus, the cost (number of scanned blocks) will equal to 1 for k ∈ [1, k1 ]. For k > k1 , Block B will have to be scanned, and thus the cost will equal to 2. However, the cost will remain equal to 2 for k ∈ [k1 + 1, k2 ], where k2 equals the number of points in the tuples-queue that have distance less than the MINDIST between Block C and the query point q. To better illustrate the above observation, we use the OpenStreetMap dataset and build a quadtree index on top (as detailed in Section 4), and then measure the cost corresponding to a random query point. Figure 4 illustrates that the cost is constant for
13 / 36
Ladder Technique
kNN-Select Cost Estimation
Block-Locality [kstart, kend] Cost
Number of Blocks
Number of Blocks
4
153 102
Building can
be incremental
51 00
1
2000
4000
6000 k
8000
(a)
10000
[1, 520]
3
[521, 675]
7
[676, 3496]
8
[3497, 6799]
12
[4700, 5837]
13
[5838, 10000]
14
(b)
Figure 4: Stability of the cost for different values10of/ 36k. large intervals of k.1 The shape of the graph resembles a staircase diagram (and hence the name Staircase for the technique). As the figure demonstrates, the cost is constant for relatively large intervals of k. For instance, when k ∈ [1, 520], the cost is 3 blocks, and when k ∈ [521, 675], the cost is 7 blocks. Observe that this stability increases as the maximum block capacity increases, i.e., the intervals become larger. We leverage the above stability property to reduce the storage size associated with every block in the index. Instead of blindly computing the cost corresponding to the center (and the corners) of a block for every possible value of k, we determine the values of k at which the cost changes. We store a set of intervals and associate with each interval the corresponding cost. We refer to this information as the catalog. The catalog is a set of tuples of the form ([kstart , kend ], size). Refer to Figure 4 for illustration.
3.2 Building the Catalog The process of building a catalog, be it for the center of a block or for one of the corners, is straightforward. Similarly to the distance browsing algorithm in [14], we maintain two priority queues, a tuples-queue and a blocks-queue. The blocks-queue orders the blocks according to a MINDIST scan. In contrast, the tuples-queue orders the points according to their distance from the query point, say q. We start with the block in which q is located and insert all the block’s points into the tuples-queue. At this point, the cost = 1. We keep removing points from the tuples-queue until the MINDIST in the blocks-queue is less than the top of the tuples-queue. The number of points, say k1 , removed so far from the tuples-queue represents the first interval in the catalog, i.e., ([1, k1 ], 1). Then, we scan the next block in the blocks-queue, insert all its points into the tuples-queue, and increment the cost. We repeat this process until all the blocks are scanned or a sufficiently large value of k is encountered. Pseudocode of the process of building the catalog of a query point is illustrated in Procedure 1. For every block in the index, we precompute five catalogs, one for the center and one for each corner. We merge the four catalogs corresponding to the corners into one catalog that stores for each value of k, the maximum cost amongst the four corners. Thus, we store only two catalogs, one for the center (center-catalog, for short), and one that corresponds to the maximum cost at the corners (corners-catalog, for short).
3.3 Cost Estimation Given a query with a k-NN-Select at Location q, the cost can be estimated as follows. First, we identify the block that encloses q and then search in the center-catalog and the corners-catalog for the 1 A similar behaviour occurs for any query point, but with different values.
Procedure 1 Building the k-NN-Select-Cost Catalog. Terms: q: The query point to which we need to build the catalog. M AX_K: The maximum possible/maintained value of k. 1: tupleQ ← ∅; blockQ ← MINDIST scan w.r.t. q 2: cost ← 0; currentK ← 1; catalog ← ∅ 3: while (currentK < M AX_K) do 4: currentBlock ← blockQ.next() 5: cost + + 6: tupleQ.insert(currentBlock.allP oints) ordered according to the distance from q 7: startK ← currentK 8: while (tupleQ.top.distance ≤ blockQ.top.MINDIST ) do 9: tupleQ.removeT op() 12 / 36 10: currentK + + 11: end while 12: catalog.add([startK, currentK], cost) 13: end while 14: return catalog
Query Optimization Flow Catalog
Query Output
k < 10,000
k-NN
Select
Estimator
Cost
Estimate
Planner
Execution Pipeline
k ≥ 10,000
Count Index
Data Index 26 / 36
Figure 5: Cost estimation for a k-NN-Select.
intervals to which the value of k belongs. Observe that the above process for building a catalog yields a sorted list of ranges of values of k, and hence binary search can be applied to find the enclosing interval and the corresponding cost in logarithmic time w.r.t. the number of intervals. Then, the cost is estimated using Equations 1 and 2. Because the Staircase technique relies on precomputing the estimates, the auxiliary index that contains the statistics, e.g., counts and cost estimates, has to be a space-partitioning index, e.g., quadtree or grid, so that the query point always falls inside a block. Observe that the structure of the auxiliary index can be independent of the index that contains the actual data points, i.e., the data-index. If the data-index is a space partitioning index, then the auxiliary index can have the same exact structure as the data-index. If the data-index is a data-partitioning index, e.g., R-Tree, then the structure of the auxiliary index will be different. In either case, the query point will never be outside a block in the auxiliary index, and hence we will always be able to estimate the cost Because the number of blocks in the index can be large, the storage overhead of the catalogs can be significant. We hence limit the maximum value of k that a catalog supports to a practically large constant, e.g., k = 10, 000. This would result in compact catalogs that can be practically maintained for each index block. In the case when a k-NN-Select query has a k value that is greater than 10, 000, we can estimate its cost by applying the algorithm
kNN Cost 25
2
25
3
25
4
25
5
25
6
25
7
25
8
25
9
25
10
25
X
Y
T
1
Q
11
25
12
25
13
25
14
25
15
25
16
25
17
25
18
25
19
25
20
25
21
25
22
25
23
25
24
25
25
25
27
AX
25
28
25
29
25
DI
26
Z
31
ST
30
56 42 28 14
25 25
34
25
35
25
36
25
37
25
700 points 38
25
39
25
40
25
41
25
42
25 25
44
25
45
25
46
25
47
25
48
25
49
25
50
25
51
25
52
25
53
25
54
25
55
25
56
25
57
25
58
25
59
25
60
25
61
25
62
25
63
25
64
25
in [24] using the Count-Index. Figure 5 illustrates the typical flow of a k-NN-Select query. Queries with k > 10, 000 (that do not arise frequently in practice) are directed to the Count-Index. All other queries (k ≤ 10, 000) are served through the catalogs. In Section 5, we show that for a real dataset of 0.1 Billion points, the overhead to store all the catalogs is less than 4 MBs. 65
25
66
25
67
25
68
25
69
25
70
25
71
25
72
25
73
25
74
25
75
25
76
25
77
25
78
25
79
25
4. K-NN-JOIN COST ESTIMATION 80
25
81
25
82
25
83
25
As highlighted in Section 2, the state-of-the-art technique [22] in k-NN-Join processing applies a block-by-block mechanism in which, for each block from the outer relation, the locality blocks are determined from the inner relation. The locality blocks of a block, say bo , from the outer relation represent the minimal set of blocks in which the k-nearest-neighbors of any point ∈ bo exist. Thus, each point from the outer relation searches only the locality of its enclosing block to find its k-nearest-neighbors. Before estimating the cost of k-NN-Join, we briefly explain how the locality of a block is computed. Given a block from the outer relation, say bo , the corresponding locality blocks in the inner relation are determined as follows. Blocks of the inner relation are scanned in MINDIST order from bo . The sum of the count of points in the encountered blocks is maintained. Once that sum reaches k, the highest MAXDIST, say M , of an encountered block is marked and scanning of the blocks continues until a block of MINDIST greater than M is encountered. The encountered blocks represent the locality of bo . For example, consider the process of finding the locality of Block Q in Figure 6 where k = 10. Blocks are scanned in MINDIST order from Block Q. This means that scanning starts with Block Z. Assume that Block Z contains 700 points. Now, the sum of the count of points in the encountered blocks (in this case, only Block Z) exceeds k. The MAXDIST between Block Q and Block Z is marked, and scanning the blocks continues (Blocks X, Y , and T , respectively) until Block L is encountered. At this point, scanning is terminated because Block L has MINDIST from Block Q that is greater than the marked MAXDIST (between Blocks Q and Z). Hence, the number of blocks in the locality of Block Q is 4. A naive way to estimate the cost (i.e., the total number of scanned blocks) of a k-NN-Join is to compute the size of the locality blocks for each block in the outer relation and sum these sizes. However, this can be expensive because the number of blocks in the outer relation can be arbitrarily large. In the rest of this section, we present three different techniques that address this problem. 84
25
85
25
86
25
87
25
88
25
89
25
2000
4000
6000
8000
10000
Locality
Size
[1, 313]
25
[314, 5380]
41
[5381, 6537]
54
[6538, 9368]
57
[9369, 10882]
63
(b)
Figure 7: Stability in the size of the locality for different values of k.
Figure 6: Building the locality of a block. The gray block Q is a block from the outer relation; other blocks are from the inner relation. 43
1
[kstart, kend]
(a)
25
33
0 k
25
32
Catalog
70
25
M
L
Number of Locality Blocks
k
4.1 The Block-Sample Technique
16
Instead of computing the locality for each block of the outer relation, we pick a random sample of these blocks, compute the locality size of each block in the sample, and then aggregate the total size and scale it to the total number of blocks in the outer relation. We refer to this technique as the Block-Sample technique. Given a set of no blocks from the outer relation, we pick a random sample of size s. If the aggregate locality size of the s blocks o . The samis agg, then we estimate the overall join cost as agg×n s ple blocks are chosen to be spatially distributed across the space in which the blocks of the outer relation reside. To get such sample of blocks, we do either a depth-first or breadth-first index traversal for the blocks of the outer relation and skip blocks every nso . Although the above technique can result in high accuracy when the sample size increases, it incurs computational overhead upon receiving a k-NN-Join query. As mentioned earlier in Section 2, a typical query optimizer requires fast estimation of the cost, pos1 sibly through quick catalog-lookups. With this goal in mind, we introduce next a catalog-based approach.
4.2
The Catalog-Merge Technique
The main idea of the Catalog-Merge technique is to precompute the size of the locality of each block in the outer relation and store it in a catalog. Given a k-NN-Join query, we can simply aggregate the precomputed values in the catalogs of the blocks of the outer relation. However, the size of the locality depends on the value of k, so we need to precompute it for every possible value of k, which can be prohibitively expensive. Similarly to the case of k-NN-Select, we observe that the size of the locality of a given block tends to be constant (stable) for relatively large intervals of k. To illustrate, consider the example in Figure 6. Assume that Block Z has 700 points. If k has any value between 1 and 700, exactly the same set of blocks will represent the locality of Block Z, i.e., the size of the locality will be the same. To better illustrate this observation, we use the OpenStreetMap dataset and build a quadtree index on top (as detailed in Section 4), and then measure the locality size of a randomly selected block.2 Figure 7 illustrates that the size of the locality is stable for large intervals of k. To build the locality-catalog of a block, we identify the inflection points in the range of values of k at which the locality size changes, e.g., k = 313, 5380, . . . , 9368 in Figure 7. This can be performed using binary search within the range of values of k. In particular, we start with k = 1 and compute the locality size, say S. Then, we perform a binary search for the smallest value of k at which the 2 A similar behaviour occurs for any block, but with different values.
Procedure 2 Building the locality-catalog of a block. Terms: Q: The block to which we need to build the catalog. M AX_K: The maximum possible/maintained value of k. 1: // Initializations: 2: CountScan ← MINDIST Scan from Q 3: cBlock ← CountScan.next() 4: M axScan ← MINDIST Scan from Q 5: mBlock ← M axScan.next() 6: C ← 1; aggCost ← 0; 7: Catalog ← ∅; highestM axDist ← 0 8: while (C < M AX_K) do 9: startK ← C 10: while (cBlock.MAXDIST ≤ highestM axDist) do 11: C+ = cBlock.count 12: cBlock ← CountScan.next() 13: end while 14: highestM axDist ← cBlock.MAXDIST from Q 15: endK ← C 16: while (mBlock.MINDIST ≤ highestM axDist) do 17: aggcost + + 18: mBlock ← M axScan.next() 19: end while 20: Catalog.add([startK, endK], aggCost) 21: end while Exact Estimation 22: return Catalog Block 1
2
Block 2
5
Block 3 Block b
[kstart, kend] Cost
k1 13 6
…
locality size would be greater than S, i.e., the inflection point, say ki . At this moment, we identify the first range of values as [1, ki − 1]. Afterwards, we perform another binary search starting from k = ki to get another range of values of k. This process is repeated until no inflection points are found, i.e., when the maximum value of k is reached. A more efficient approach is to build the locality-catalog incrementally through two rounds of MINDIST scan of the Count-Index. These MINDIST scan rounds can be achieved using two priority queues in which the blocks of the Count-Index are ordered according to their MINDIST from the block we need to build the catalog for. The two MINDIST scan rounds are interleaved. One scan explores the blocks that should contain at least C points. We refer to this scan as Count-Scan. The other scan explores the blocks that have MINDIST ≤ the highest MAXDIST value of the explored blocks so far from Count-Scan. We refer to this queue as Max-Scan. We maintain a counter, say C. Whenever a block from Count-Scan is retrieved, its MAXDIST, say M , is marked and the value of C is incremented by the number of points in the retrieved block. Then, blocks from Max-Scan are scanned until the MINDIST is greater than the highest value encountered for M . At this point, a new entry is created in the catalog by aggregating the number of blocks retrieved from Max-Scan thus far. This process is repeated until C reaches the maximum value of k or all the blocks of the inner relation are consumed by Count-Scan.. Pseudocode for the process is given in Procedure 2. Refer to Figure 6 for illustration, where we compute the catalog of Block Q. We start with C = 1. In Count-Scan, we explore Block Z, update C to be 700, and mark the highest MAXDIST encountered. Then, in Max-Scan, we explore Blocks X, Y , and T because their MINDIST is less than the largest MAXDIST encountered. At this moment, we create a catalog entry ([1, 700], 4) that represents the start and end values of C with the cost of four blocks (namely, Z, X, Y and T ). Afterwards, we continue Count-Scan to explore Block X. Assuming that Block X has 500 points, we update C to be 700 + 500 = 1200 and also mark the MAXDIST between Blocks X and Q. Then, in Max-Scan, we explore Block L because its MINDIST is less than the highest MAXDIST marked thus far. Now, the cost is incremented by 1 due to Block L. We create a new catalog entry ([701, 1200], 5). Observe that the above approach is cheap because it relies only on counting (using the Count-Index) with no scan of the data. Assume that for a given block from the outer relation, the number of blocks in its locality is L. The above approach visits each of the L blocks at most twice, i.e., the running time is O(L) per block. Note that, by definition, the locality conservatively includes all the blocks needed for the k-NN search (see [22] for details), i.e., the locality contains the k-NN for every point in the outer block, say Q. Although it is true that for some k1 > k all the nearest-neighbors of some points in Q may exist in already scanned blocks (by CountScan), there will be some points, e.g., near the corners of Q, that might have some of their k-NN in unscanned blocks. Hence, in our approach, we jump into new ranges of k (and new corresponding cost) whenever a block is retrieved through Count-Scan. Observe that if a block retrieved from Count-Scan has MAXDIST that is less than or equal to the highest MAXDIST encountered thus far, it will not lead to any scan in Max-Scan, and hence will lead to a repeated cost in the next entry of the catalog. For instance, in Figure 6, if the MAXDIST between Blocks Q and Z is greater than the MAXDIST between Block Q and Block X (the next in CountScan), then the next new entry in the catalog will be ([701, . . .], 4), i.e., will have the same cost. To get rid of these redundant entries in the catalog, we continue Count-Scan until the value of the highest encountered MAXDIST changes.
4
k3 9 k2 8
Temporary catalogs of blocks
from the outer relation
Merger
[1, k1] [k1, k2]
17 25
[k2, k3] [k3, …] … […, MAX_K]
29 32 … …
k-NN-Join Merge-Catalog
Figure 8: Flow of the Catalog-Merge process. 23 31 / 45
4.2.1
Preprocessing
For each block in the outer relation of the k-NN-Join, we compute a temporary catalog that is similar to the one in Figure 7(b). If the number of blocks in the outer relation is no , then this process requires O(no · L), where L is the average size of the locality of a block. This can be costly if no is large. To solve this problem, we take a spatially distributed random sample of the blocks of the outer relation. We compute a temporary catalog only for the sample blocks and not for each block in the outer relation. Afterwards, we merge all the temporary catalogs, and produce a single catalog that contains the aggregate cost of all the temporary catalogs. Each entry in the final catalog has the form ([kstart , kend ], size), where size is the estimated join cost when kstart ≤ k ≤ kend . Because each temporary catalog is sorted with respect to the ranges of values of k, we apply a plane sweep over the ranges of values of k and aggregate the cost. To illustrate, consider the example in Figure 8. k1 is the smallest value of k in the catalog entries. This means that the aggregate cost for the interval [1, k1 ] is 2 + 5 + 6 + 4 = 17. k2 is the next smallest value of k, and hence another interval [k1 , k2 ] with aggregate cost = 17 − 5 + 13 = 25 is created in the output catalog. Similarly, for interval [k2 , k3 ], the aggregate cost = 25 − 4 + 8 = 29 and for interval [k3 , · · · ], the aggregate cost = 29 − 6 + 9 = 32. A min-heap is used to efficiently
Estimation by Virtual Grid Join Virtual Grid
determine the next smallest value across all the temporary catalogs in the plane sweep process. To reduce the size of the catalog, we limit the maintained values of k to some practically large constant, e.g., 10,000. In Section 5, we show that for a real dataset of 0.1 Billion points, the size of the catalog is about 1 MB.
Inner Index
4.2.2 Cost Estimation Observe that the resulting k-NN-Join catalog is sorted w.r.t. the values of k. Given a k-NN-Join query, we can lookup the estimate cost using a binary search to find the catalog entry corresponding to the given k value. Although the process of building the catalog is performed once, it can be costly if the number of tables in the database schema is large, say n. The k-NN-Join catalog information is required for every( possible pair of tables in the database schema, and hence ) 2 × n2 catalogs need to be built (because the k-NN-Join is asymmetric). Although sampling can speed up the merging process ( of ) the temporary catalogs, it is still expensive to compute 2 × n2 , i.e., a quadratic number of catalogs across the database tables. To address this issue, we introduce our third cost estimation technique that requires only a linear number of catalogs.
32 / 36
Figure 9: The Virtual-Grid technique for k-NN-Join cost estimation.
4.3 The Virtual-Grid Technique Similarly to the Catalog-Merge technique, in the Virtual-Grid technique, we maintain a set of catalog information that is built only once before executing any queries. The key idea is to estimate the cost corresponding to a dataset, say D, when D is the inner relation of a k-NN-Join. Given the n relations in the database schema, where each can potentially be an outer relation in a k-NN-Join with D, instead of computing n catalogs corresponding to D, we compute only one catalog that corresponds to the join cost between a virtual index and D.
4.3.1 Preprocessing Refer to Figure 9 for illustration. Given the index of a dataset (e.g., the red quadtree decomposition in the figure), we assume the existence of a virtual grid that covers the whole space.3 For each block (grid cell) in the virtual-grid, we compute a catalog that is similar to the one in Figure 7(b) with the difference that the locality is computed with respect to the given index. We associate all these virtual-grid catalogs with the given index (e.g., the quadtree). We repeat this process for each relation in the database schema, i.e., associate with every index a virtual-grid-cost. Observe that unlike the Catalog-Merge approach, this requires linear storage (and preprocessing time) overhead.
4.3.2 Cost Estimation Given a k-NN-Join query, we retrieve the virtual-grid corresponding to the inner relation. Then, we estimate the cost by scaling the cost corresponding to the part of the virtual-grid that overlaps with the outer relation. In particular, for each grid cell, say C, in the virtual-grid, we retrieve the locality size, say L, stored in C’s catalog. Then, we select the blocks in the outer relation that overlap with C. This can be performed using a range query on the outer relation. For each of the overlapping blocks, say O, in the outer relation, we multiply L by the ratio between the diagonal length of Block O and the diagonal length of Block C. We sum these products across all the cells of the virtual-grid. The overall sum represents the join cost estimate. 3 This can be achieved for real datasets where the bounds of the earth are fixed.
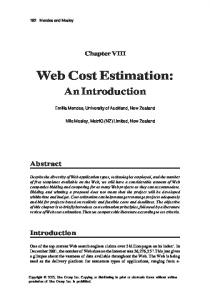
Figure 10: A sample of OpenStreetMap GPS data and the corresponding region-quadtree decomposition overlaid on top.
Assuming that the number of blocks in the outer relation is no , the estimation process is O(no ). The reason is that eventually, all the blocks of the outer relation get selected (through the range query performed at each grid cell). In other words, regardless of the grid size, all the blocks will be selected and the corresponding products have to be aggregated. In Section 5, we study the estimation time for different grid sizes while fixing the size of the outer relation and demonstrate that the estimation time is almost constant for different grid sizes.
5.
EXPERIMENTS
In this section, we evaluate the performance of the proposed estimation techniques. We realize a testbed in which we implement the state-of-the-art techniques for k-NN-Select estimation [24] as well as our proposed estimation techniques. To have a ground truth for the actual cost of the k-NN operators, we implement the Distance Browsing algorithm for k-NN-Select as well as the locality based k-NN-Join. Our implementation is based on a region-quadtree index [21], where each node in the quadtree represents a region of space that is recursively decomposed into four equal quadrants, or subquadrants, with each leaf node containing points that correspond to a specific subregion. The maximum block capacity in the quadtrees used in our experiments is set to 10,000 points. All implementations are in Java. Experiments are conducted on a machine running Mac OS X on Intel Core i7 CPU at 2.3 GHz and 8 GB of main memory. We use a real spatial dataset from OpenStreetMap [1]. The number of data points in the dataset is 0.1 Billion points. Figure 10 displays a sample of the data that we plot through a visualizer that
Estimation Time (sec)
Error Ratio
35% 26% 18% Staircase (Center+Corners) Staircase (Center Only) Density-Based
9% 0%
1
2
3
4
5
6
7
8
9
10
Staircase (Center+Corners) Staircase (Center Only) Density-Based
1E-03 1E-04 1E-05 1E-06 1E-07
1
4
16
64
Scale Factor
Figure 11: k-NN-Select estimation accuracy.
In this section, we present the performance of the Staircase technique in estimating the cost of a k-NN-Select and compare it with the density-based technique of [24]. We evaluate two variants of the Staircase technique, 1) Center-Only, where the cost corresponding to a query point, say q, is estimated as the cost corresponding to the center in which q is located, and 2) Center+Corners, where the cost is estimated using Equations 1 and 2.
5.1.1 Estimation Accuracy In this experiment, we measure the average error ratio in estimating the cost of 100,000 queries that are chosen at random. For each query, we compute the actual cost, compare it with the estimated cost, and measure the error ratio. We compute the average error ratio of all the queries. Figure 11 illustrates that the Staircase technique achieves a smaller error ratio than that of the density-based technique. The error ratio reaches less than 20% when the cost is estimated using the Center+Corners variant.
5.1.2 Estimation Time In this experiment, we measure the time each estimation technique requires to estimate the cost of a query. Figure 12 illustrates that the Staircase technique is almost two orders of magnitudes faster than the density-based technique. Observe that the Center+Corners variant of the Staircase technique is slightly slower than the Center-Only variant because the former requires two catalog lookups, one from the center-catalog and the other from the corners-catalog. Also, observe that the estimation time of the density-based technique increases as the value of k increases. The reason is that the density-based technique keeps scanning the index blocks until the encountered blocks are estimated to contain k points. In contrast, the estimation time of the Staircase technique is constant regardless of the value of k because the Staircase technique relies on just a single catalog lookup (two lookups in case of the Center+Corners variant).
1024
4096
Preprocessing Time (sec)
Figure 12: k-NN-Select estimation time.
we have built as part of our testbed. The figure also displays a region-quadtree decomposition that is built on top of the data. To test the performance of our techniques at different data scales, we insert portions of the dataset into the index at multiple ratios. For instance, for scale = 1, we insert 10 Million points, for scale = 2, we insert 20 Million points, and so on until scale = 10 in which all the 0.1 Billion points are inserted. Our performance metrics are the estimation accuracy (i.e., error ratio), the estimation time, the preprocessing time, and the storage overhead. We limit the maximum maintained value of k in all the catalogs to 10,000.
5.1 KNN-Select Cost Estimation
256
k
200
Staircase (Center+Corners) Staircase (Center Only) Density-Based
150 100 50 0
1
2
3
4
5
6
7
8
9
10
Scale Factor
Figure 13: Preprocessing time of the k-NN-Select estimation techniques.
5.1.3
Storage Overhead and Preprocessing Time
In this experiment, we measure the storage requirement and preprocessing time of each estimation technique. Observe that the density-based technique has no preprocessing time requirements because it precomputes no catalogs. Figure 13 illustrates that the Staircase technique incurs relatively high preprocessing overhead to precompute the catalogs of all the index blocks. Observe that as the scale factor increases, the preprocessing time increases because more blocks will need to be processed. Also, observe that the Center-Only variant incurs less preprocessing overhead than the Center+Corners variant because the former computes only one catalog per block while the latter computes five catalogs and merges four of them. Notice that this preprocessing phase is an offline process that does not affect the performance of the online cost estimation process. Figure 14 illustrates that density-based technique consumes little storage overhead, basically, due to the density values maintained at each block in the index. In contrast, the Staircase technique has higher storage overhead due to the maintained catalogs. Observe that as the scale factor increases, the storage overhead increases because more blocks will be present in the index and each of them will have a separate catalog. However, the storage requirements of the Staircase technique are less than 4 MBs even for the largest scale factor. Also, observe that the Center-Only variant of the Staircase technique incurs less storage overhead than the Center+Corners variant because the former maintains only one catalog per block while the latter maintains two catalogs.
5.2
K-NN-Join Cost Estimation
In this section, we study the performance of the proposed techniques for estimating the k-NN-Join cost, namely the BlockSample, Catalog-Merge, and Virtual-Grid techniques.
Storage Overhead (MB)
4
Staircase (Center+Corners) Staircase (Center Only) Density-Based
3 2 1 0
1
2
3
4
5
6
7
8
9
10
Scale Factor
Merge technique is more than four orders of magnitude faster than the Block-Sample and Virtual-Grid techniques. The reason for this variance in performance is that the Catalog-Merge technique maintains one catalog for every pair of relations (indexes) in which the estimate cost is maintained; the cost is directly retrieved from the catalog via one lookup. In contrast, the Block-Sample technique computes the locality for a sample of blocks, which is costly. Also, the Virtual-Grid technique aggregates the cost across each of the grid cells after computing the overlap with the outer relation, which is costly as well. 1E+00
Estimation Time (sec)
Figure 14: Storage requirements of the k-NN-Select estimation techniques.
5.2.1 Estimation Accuracy In this experiment, we estimate the cost of a k-NN-Join between two indexes of 0.1 Billion points each for a random value of k, compare it with the actual cost, and then calculate the error ratio. We repeat this process for various sampling sizes for both the BlockSample and Catalog-Merge techniques, and for various grid sizes for the Virtual-Grid technique. Figure 15 illustrates that the BlockSample and Catalog-Merge techniques can reach an error ratio that is less than 5% for a sample size > 400. Figure 16 illustrates that the Virtual-Grid technique achieves less than 20% error ratio.
60% Catalog-Merge Block-Sample
40%
1E-06 4
16
1024
4096
Figure 18 gives the performance of the Block-Sample and Catalog-Merge techniques for different sample sizes. Observe that the estimation time of the Block-Sample technique increases as the sample size increases.4 In contrast, the estimation time of the Catalog-Merge technique is constant irrespective of the sample size because estimation is performed through one lookup through a precomputed catalog, i.e., the sample size only affects the preprocessing time as we show next. 2
100 150 200 250 300 350 400 450 500
Sample Size
Figure 15: k-NN-Join estimation accuracy.
1E-02 1E-04
9.65E-06 9.18E-06 9.22E-06 9.40E-06 9.24E-06 9.38E-06 9.40E-06 9.51E-06
Time Virtual GridTime Sampling Time Merge 0.0067521 0.1021397 2.00E-06
4 8 16 32 64 128 256 512 1024 2048 4096 8192
1E+00
0.0067521 0.0057706 0.0065028 0.0054803 0.0060371 0.0075605 0.0060793 0.0055929 5.7448E-03 0.0060307 0.0062047 5.4428E-03
0.1027982 0.1027574 0.1033054 0.100227 0.1015519 0.1058457 0.1170518 0.1127618 1.10811E-01 0.1132967 0.121824 0.1268454
1.90E-06 2.60E-06 2.00E-06 2.20E-06 3.00E-06 2.60E-06 2.30E-06 2.40E-06 3.00E-06 3.70E-06 3.80E-06 3.80E-06
9.73E-06 1.01E-05 1.03E-05 1.09E-05 1.25E-05 1.55E-05
Block-Sample Catalog-Merge
1E-06 100
50%
300
500
700
900
Sample Size
Virtual Grid
40%
256
Figure 17: k-NN-Join estimation time.
k
50
64
k
20% 0%
30%
Figure 18: k-NN-Join estimation time.
20% 10%
Sample Size
4x4
Sampling
CatalogMerge
8x8 50 0.700916281112x12 0.7008260071 100 150 200 250 300 350 400 450 500
Grid Size
0.3707252654 0.2661080514 0.1582350472 0.1091684442 0.0724024064 0.0485313713 0.045080457 0.045080457 0.0589030922
0.3696292927 0.2067652432 0.1564650453 0.1091684442 0.0425112648 0.045096186 0.0436056034 0.045080457 0.0436056034
16x16 0.2990837189 20x20 0.2991739929 0.6292747346 0.7338919486 0.8417649528 0.8908315558 0.9275975936 0.9514686287 0.954919543 0.954919543 0.9410969078
Figure 16: k-NN-Join estimation accuracy.
Estimation Time (sec)
Error Ratio
Virtual Grid Sampling Catalog-Merge
1E-04
1
Estimation Time (sec)
Error Ratio
80%
1E-02
0.6303707073 0.7932347568 0.8435349547 0.8908315558 0.9574887352 0.954903814 0.9563943966 0.954919543 0.9563943966
5.2.2 Estimation Time In this experiment, we measure the time required to estimate the cost of a k-NN-Join between two indexes of 0.1 Billion points each. Figure 17 gives the performance for different values of k. The number of samples used in the Catalog-Merge and Block-Sample techniques is fixed to 1000. The grid size used in the Virtual-Grid technique is 10 × 10. As the figure demonstrates, the CatalogGrid Size
1E-02
1.54E-07
1.55E-07
9.65E-06
2.60E-07
1.56E-07
9.18E-06
2.32E-07
1.59E-07
9.22E-06
2.44E-07
1.58E-07
9.40E-06
2.27E-07 2.78E-07
1.60E-07 1.61E-07
9.24E-06 9.38E-06
2.27E-07 2.82E-07 2.30E-07
1.60E-07 1.59E-07 1.60E-07
9.40E-06 9.51E-06 9.73E-06
2.29E-07 2.58E-07 2.39E-07 2.49E-07 2.48E-07
1.57E-07 1.58E-07 1.60E-07 1.63E-07 1.60E-07
1.01E-05 1.03E-05 1.09E-05 1.25E-05 1.55E-05
8E-03 5E-03 Virtual Grid
3E-03 1E-06
sample size Time Sampling Time Merge 100 0.1102873 2.48E-06
4x4
8x8 200 300 400 500 600 700 800 900 1000
12x12 0.1172895 0.1356163 0.1534903 0.1673582 0.1936306 1.9159E-01 0.2346427 0.2266451 0.2276914
16x16
20x20
2.10E-06
Grid Size 1.90E-06 1.90E-06 2.70E-06 2.00E-06 2.00E-06 2.10E-06 2.00E-06 2.10E-06
Figure 19: k-NN-Join estimation time. 4
The slope of the curve is low due to the use of a log-scale.
Virual Grid
4x4
0.1543370573 0.8456629427
5x5 6x6 7x7 8x8 9x9 10x10 11x11 12x12 13x13
0.1397974233 0.1303050121 0.1392917668 0.1285501486 0.1356028624 0.1464797119 0.1483712172 0.1425453636 0.1466681863
0.8602025767 0.8696949879 0.8607082332 0.8714498514 0.8643971376 0.8535202881 0.8516287828 0.8574546364 0.8533318137
1.54E-07
1.55E-07
9.65E
2.60E-07
1.56E-07
9.18E
2.32E-07
1.59E-07
9.22E
2.44E-07
1.58E-07
9.40E
2.27E-07
1.60E-07
9.24E
Storage Overhead (MB)
Figure 19 gives the performance of the Virtual-Grid technique for different grid sizes. As the figure demonstrates, the estimation time is almost constant regardless of the grid size. As highlighted in Section 4, the reason is that the time required for estimation depends on the number of blocks in the outer relation, not on the number of cells in the grid. For each grid cell, the overlapping blocks from the outer relation have to be retrieved regardless of the size of the grid.
2
1 Catalog-Merge 0
100
300
500
5.2.3 Storage Overhead and Preprocessing Time
3
4
5
6
7
8
9
Storage Overhead (MB)
0.1
0
4x4
200
10
9
2
SF
Ladder 1
0
1
2
3
2 3 4 5 6 7 8 9 10
1.05732
4
Merge
5
1.3338 1.728 1.93104 2.07576 1.93104 1.86408 1.74204 1.67292 1.66212
0.041364
6
0.041364 0.041364 0.041364 0.041364 0.041364 0.041364 0.041364 0.041364 0.041364
VG 979 1235 1600 1788 1922 1788 1726
Ladder (No Corners)
1613
7
8
9
10
1549 1539
Scale Factor
Merge
Sampling
Merge
600
0.97848
700
1.26684
800
1.32732
900
1.48716
1000
1.61136
4 Grid Size
2 0
100
0.7 0.5
Catalog-Merge
Virual Grid
4x4
0.01092
5x5 6x6 7x7 8x8 9x9 10x10 11x11 12x12 13x13 14x14 15x15 16x16 17x17
0.01128 0.01788 0.02424 0.02748 0.03648 0.04296 0.05328 0.05796 0.06276 0.07584 0.08592 0.09048 0.10932
18x18 19x19
0.12936 0.13752
20x20
0.14616
300
500
700
900
Sample Size
(a)
91 94 149 202 229 304 358 444 483 523 632
0.010 0.011 0.017 0.024 0.027 0.036 0.042 0.053 0.057 0.062 0.075
716
0.085
1.54E-07
1.55E-07
2.60E-07
1.56E-07
2.32E-07
1.59E-07 1078
2.44E-07
1.58E-07 1146
2.27E-07 2.78E-07
1218 1.60E-07 1.61E-07
2.27E-07 2.82E-07 2.30E-07
1.60E-07 1.59E-07 1.60E-07
9.4 9.5 9.7
2.29E-07 2.58E-07 2.39E-07 2.49E-07 2.48E-07
1.57E-07 1.58E-07 1.60E-07 1.63E-07 1.60E-07
1.0 1.0 1.0 1.2 1.5
754 911
9.6
0.090 9.1 0.109 9.2 0.129 9.4 0.137 0.146 9.2
9.3
0.4 Virtual Grid 0.2 0 No
4x4
8x8
12x12
16x16
20x20
383 383 383 383 383 383 383
With 1.05732 0.041364 1.3338 0.041364 1.728 sample 0.041364 size Time Sampling Time Merge 1.93104 0.041364 100 2.48E-06 3.186099 2.07576 0.041364 1.93104 0.041364 1.86408 0.041364
200
3.5950122
2.10E-06
0.03994458
383
1.74204
300 0.041364
4.0731507
1.90E-06
0.04525723
383 383
1.67292 1.66212
0.041364 0.041364
700
6.1541415
2.00E-06
0.06837935
800
6.3598923
2.10E-06
0.07066547
Grid Size
(b)
0.0354011
storage and preprocessing time as 2.00E-06 the sample size increases. The 900 7.2662589 0.08073621 1000 2.10E-06 9.3590946 0.10398994 reason is that, as the sample size increases, more temporary catalogs get created during the process of merging the catalogs, which are likely to result in more entries in the final merged catalog. Similarly, Figs. 22(b) and 23(b) demonstrate that the Virtual-Grid technique requires more storage and preprocessing time as the grid size Size Virual Grid increases because itGrid maintains a catalog for every grid cell. 4x4 0.2425302
In Figure 23, we fix the scale factor to 10. As Figs. 22(a) and 23(a) demonstrate, the Catalog-Merge technique requires more
VG
0.39096
Figure 23: Preprocessing time 1.90E-06 of the k-NN-Join 0.05010251 estimation 400 4.5092259 500 2.70E-06 4.9857399 0.05539711 techniques. 600 2.00E-06 5.5953702 0.06217078
Figure 21: Preprocessing time of the k-NN-Join estimation techniques.
SF
20x20
6
Preprocessing Time (sec)
Preprocessing Time (sec)
Figure 20: Storage requirements of the k-NN-Join estimation techniques.
5
16x16
8
10
Virtual Grid Block-Sample Catalog-Merge
12x12
300 0.54648 Figure 22: Storage requirements of the k-NN-Join estimation 400 0.66204 500 0.81864 techniques.
Scale Factor
7
8x8
(b)
Catalog-Merge Virtual Grid
2
Virtual Grid
sample size Time Sampling 100 0.17712
1.0
1
0.2
Grid Size
10.0
0.0
900
(a)
Preprocessing Time (sec)
Storage Overhead (MB)
In this experiment, we measure the storage and preprocessing time requirements for maintaining a set of catalogs for the estimation of k-NN-Join queries between 10 indexes that we create. We test the performance at different scale factors, i.e., create 10 different indexes for each scale factor. For instance, if the scale factor is 5, this means that we create 10 indexes and insert 50 Million points into each of them. In Figure 20, we fix the grid size in the Virtual-Grid technique to 10 × 10 and the sample size for the Catalog-Merge technique to 1000. As the figure demonstrates, the Virtual-Grid technique requires almost an order of magnitude less storage than the CatalogMerge techniques. The reason is that the Catalog-Merge( technique ) maintains a catalog for every pair of indexes, i.e, 2 × 10 = 90 2 catalogs. In contrast, the Virtual-Grid technique maintains a catalog for every index, i.e., only 10 catalogs. Figure 21 demonstrates that the Virtual-Grid technique requires a constant amount of preprocessing time (about two seconds) regardless of the scale factor. The reason is that the preprocessing time depends on the number of grid cells; for each grid cell, a catalog is computed.
0.1
700
Sample Size
VG
0.0558084
0.246354
5.022756
2.46354
0.0534019
0.246354
4.806171
2.46354
0.0658084
0.264411
5.922756
2.64411
0.0734019
0.243485
6.606171
2.43485
0.0724877
0.243437
6.523893
2.43437
8.24852E-02
0.345739
7.423668
3.45739
5x5 6x6 7x7 8x8 9x9 10x10 11x11 12x12 13x13 14x14 15x15
0.2692439 0.2998002 0.3353776 0.3899065 0.4321302 0.4201452 0.4276126 4.50404E-01 0.4947063 0.505288 0.5272559
1.54E-07
1.55E-07
9.65E
2.60E-07
1.56E-07
9.18E
2.32E-07
1.59E-07
9.22E
2.44E-07
1.58E-07
9.40E
2.27E-07 2.78E-07
1.60E-07 1.61E-07
9.24E 9.38E
2.27E-07 2.82E-07 2.30E-07
1.60E-07 1.59E-07 1.60E-07
9.40E 9.51E 9.73E
2.29E-07 2.58E-07 2.39E-07
1.57E-07 1.58E-07 1.60E-07
1.01E 1.03E 1.09E
Summary
k-NN-Select
Cost Estimation
Estimation
Time
Estimation Accuracy
Storage Overhead
Preprocessing Time
Density-Based
Medium
Medium
None
None
Staircase (Center-Only)
Low
Medium
Low
Medium
Staircase (Center+Corners)
Low
High
Low
High
Block-Sample
High
High
None
None
Catalog-Merge
Low
High
Medium
Medium
Virtual-Grid
Medium
Medium
Low
Low
k-NN-Join
Cost Estimation
Figure 24: Summary of the pros and cons of each estimation technique.
6. CONCLUDING REMARKS In this paper, we study the problem of estimating the cost of the k-NN-Select and k-NN-Join operators. We present various estimation techniques; Figure 24 summarizes the tradeoffs each technique offers. Performance evaluation using real spatial datasets from OpenStreetMap demonstrates that: 1) the Staircase technique for k-NN-Select cost estimation is faster than the state-of-the-art technique [24] by more than two orders of magnitude and has better estimation accuracy; 2) the Catalog-Merge and Virtual-Grid techniques for k-NN-Join cost estimation achieve less than 5% and 20% error ratio, respectively, while keeping the estimation time below one microsecond and one millisecond, respectively; and 3) the Virtual-Grid technique reduces the storage required to maintain the catalogs by an order of magnitude compared to the Catalog-Merge technique.
7. REFERENCES [1] OpenStreetMap bulk gps point data. http://blog.osmfoundation.org/2012/04/ 01/bulk-gps-point-data/. [2] S. Acharya, V. Poosala, and S. Ramaswamy. Selectivity estimation in spatial databases. In SIGMOD Conference, pages 13–24, 1999. [3] N. An, Z.-Y. Yang, and A. Sivasubramaniam. Selectivity estimation for spatial joins. In ICDE, pages 368–375, 2001. [4] W. G. Aref and H. Samet. Estimating selectivity factors of spatial operations. In FMLDO, pages 31–43, 1993. [5] W. G. Aref and H. Samet. A cost model for query optimization using R-Trees. In ACM-GIS, pages 60–67, 1994. [6] N. Beckmann, H.-P. Kriegel, R. Schneider, and B. Seeger. The R*-tree: An efficient and robust access method for points and rectangles. In SIGMOD Conference, pages 322–331, 1990. [7] A. Belussi and C. Faloutsos. Estimating the selectivity of spatial queries using the ‘correlation’ fractal dimension. In VLDB, pages 299–310, 1995. [8] S. Berchtold, C. Böhm, D. A. Keim, and H.-P. Kriegel. A cost model for nearest neighbor search in high-dimensional data space. In PODS, pages 78–86, 1997. [9] C. Böhm. A cost model for query processing in high dimensional data spaces. ACM Trans. Database Syst., 25(2):129–178, 2000.
[10] C. Böhm and F. Krebs. The k-nearest neighbour join: Turbo charging the kdd process. Knowl. Inf. Syst., 6(6):728–749, 2004. 29 / 36 [11] S. Chandrasekaran and M. J. Franklin. Streaming queries over streaming data. In VLDB 2002, Proceedings of 28th International Conference on Very Large Data Bases, August 20-23, 2002, Hong Kong, China, pages 203–214, 2002. [12] M. Y. Eltabakh, R. Eltarras, and W. G. Aref. Space-partitioning trees in postgresql: Realization and performance. In ICDE, page 100, 2006. [13] A. Guttman. R-trees: A dynamic index structure for spatial searching. In SIGMOD Conference, pages 47–57, 1984. [14] G. R. Hjaltason and H. Samet. Distance browsing in spatial databases. ACM Trans. Database Syst., 24(2):265–318, 1999. [15] Y.-W. Huang, N. Jing, and E. A. Rundensteiner. A cost model for estimating the performance of spatial joins using R-trees. In SSDBM, pages 30–38, 1997. [16] H.-P. Kriegel, P. Kunath, and M. Renz. R*-tree. In Encyclopedia of GIS, pages 987–992. 2008. [17] N. Mamoulis and D. Papadias. Selectivity estimation of complex spatial queries. In SSTD, pages 155–174, 2001. [18] V. Poosala, Y. E. Ioannidis, P. J. Haas, and E. J. Shekita. Improved histograms for selectivity estimation of range predicates. In SIGMOD Conference, pages 294–305, 1996. [19] N. Roussopoulos, S. Kelley, and F. Vincent. Nearest neighbor queries. In SIGMOD Conference, pages 71–79, 1995. [20] H. Samet. Foundations of Multidimensional and Metric Data Structures. Morgan Kaufmann Publishers Inc., 2006. [21] H. Samet and R. E. Webber. Storing a collection of polygons using quadtrees. ACM Trans. Graph., 4(3):182–222, 1985. [22] J. Sankaranarayanan, H. Samet, and A. Varshney. A fast all nearest neighbor algorithm for applications involving large point-clouds. Computers & Graphics, 31(2):157–174, 2007. [23] C. Sun, D. Agrawal, and A. El Abbadi. Selectivity estimation for spatial joins with geometric selections. In EDBT, pages 609–626, 2002. [24] Y. Tao, J. Zhang, D. Papadias, and N. Mamoulis. An efficient cost model for optimization of nearest neighbor search in low and medium dimensional spaces. IEEE Trans. Knowl. Data Eng., 16(10):1169–1184, 2004. [25] C. Xia, H. Lu, B. C. Ooi, and J. Hu. Gorder: An efficient method for KNN join processing. In VLDB, pages 756–767, 2004.